The Return of Realism in Global Oil Forecasts: A Critique of the International Energy Agency World Energy Outlook 2025
Listen to the Report
Letter from the Executive Director
With this report, the National Center for Energy Analytics (NCEA) returns to the issue of future oil demand and supply, with a particular focus on the forecasts in the World Energy Outlook 2025 (WEO 2025) from the International Energy Agency (IEA). The IEA is widely viewed as the international gold standard for data and credible analyses, and WEO is used by policymakers, energy companies, and investors.
Last year, NCEA’s critique of WEO 2024 focused on a core issue: All of the IEA forecasts were based on assumptions that nations would successfully implement various energy transition goals. Those forecasts led to predictions of a near-term peak in oil demand. However, none accounted for a scenario in which the world continued along the energy path that was actually unfolding. In short, what was missing was a forecast based on, at minimum, what the IEA labels a Current Policies Scenario (CPS).
With WEO 2025, the CPS has been reinstated, a welcome inclusion that restores some much-needed realism for policymakers. Notably, the CPS shows no peak in oil demand out to 2050. Even in the Stated Policies Scenario (STEPS), in which nations do execute stated energy policies, oil demand peaks later and at higher levels than posited in WEO 2024. While the restoration of some realism is welcome, as this NCEA report discusses, there remain numerous assumptions in WEO 2025 that continue to tilt to the improbable and aspirational.
To evaluate WEO 2025’s key assumptions regarding oil, we turned for help to two well-known and highly respected experts in oil domains and energy forecasting: Neil Atkinson, a visiting fellow with NCEA and former head of the IEA Oil Industry and Markets Division; and Adam Sieminski, a former Wall Street financial analyst and former administrator of the U.S. Energy Information Administration. Their candid analysis comes at a critical time, as the world is once again reminded of the importance of understanding the current state and future of oil markets.
As with NCEA’s previous critiques, we hope this work will help motivate the IEA to continue to embrace additional aspects of energy realism in its models. The stakes are high, given the potential consequences from misallocations of both political and financial capital in energy markets.
Mark P. Mills
Executive Director, NCEA
Executive Summary
World Energy Outlook 2025 (WEO 2025) represents a consequential recalibration by the International Energy Agency (IEA). For the past several years, WEO scenarios that have underpinned IEA forecasts of the global energy system were based on aspirations or promises that became increasingly disconnected from observed outcomes. Now, in WEO 2025, the IEA has reinstated a Current Policies Scenario (CPS) that constitutes a more realistic baseline against which ambitions of policymakers and investors can be assessed. WEO 2025 conveys a clear message: Global energy demand is expected to grow steadily through 2050, accompanied by an increase in hydrocarbon use. A significant reduction in fossil fuel consumption, particularly oil, remains unlikely.
The CPS shows global oil use increasing through 2050. And the Stated Policies Scenario (STEPS) forecast levels of oil demand are higher than those in WEO 2024. However, as this report demonstrates, the STEPS continues to be based on unrealistic assumptions about “stated” policies taking effect and continues to portray an unlikely plateau in oil demand around 2030.
WEO 2025 confirms that policy-driven energy transition aspirations are being overwhelmed by several key factors: population growth, rising incomes, and living standards in developing economies; continued electrification and industrial expansion in wealthier economies; and, more recently, the rapid growth of data centers. Even with full implementation of stated policies, the STEPS still projects rising energy demand. The implication is unavoidable: The global energy system is evolving through additions, rather than transitioning away from any of the conventional fuels—including oil.
Assumptions about rapid adoption of electric vehicles (EVs) have been a central component of the IEA’s analysis of future oil demand. However, current trends suggest that these goals are unlikely to be met, as the rate of EV adoption is slowing and policies supporting EVs—such as mandates and subsidies—are being weakened or even eliminated. Forecasts of EV adoption have consistently been, and continue to be, overly optimistic.
WEO 2025 also acknowledges the critical minerals constraint embedded in the energy technologies that are central to transition policies. However, none of the WEO scenarios properly model the well-documented potential for severe disruptions in mineral supply and cost, considering risks such as the concentration of minerals production, especially in China; the decline in ore grades; and the challenges to social license. These constraints are particularly relevant for EVs, and they materially weaken assumptions underlying the potential for oil demand displacement in transportation.
The restoration of a more realistic baseline scenario should prompt a reassessment of investment risks and supply adequacy in global oil markets. Continued long-term demand growth, combined with the natural production decline rates in operating oil fields—particularly in U.S. shale domains—implies the need for substantially higher upstream oil and gas investments than are now evident. This, too, contradicts the IEA’s previous calls to halt all such new investments. Indeed, WEO 2025 now acknowledges that sustained underinvestment could lead to oil supply shortfalls, price volatility, and geopolitical dependencies.
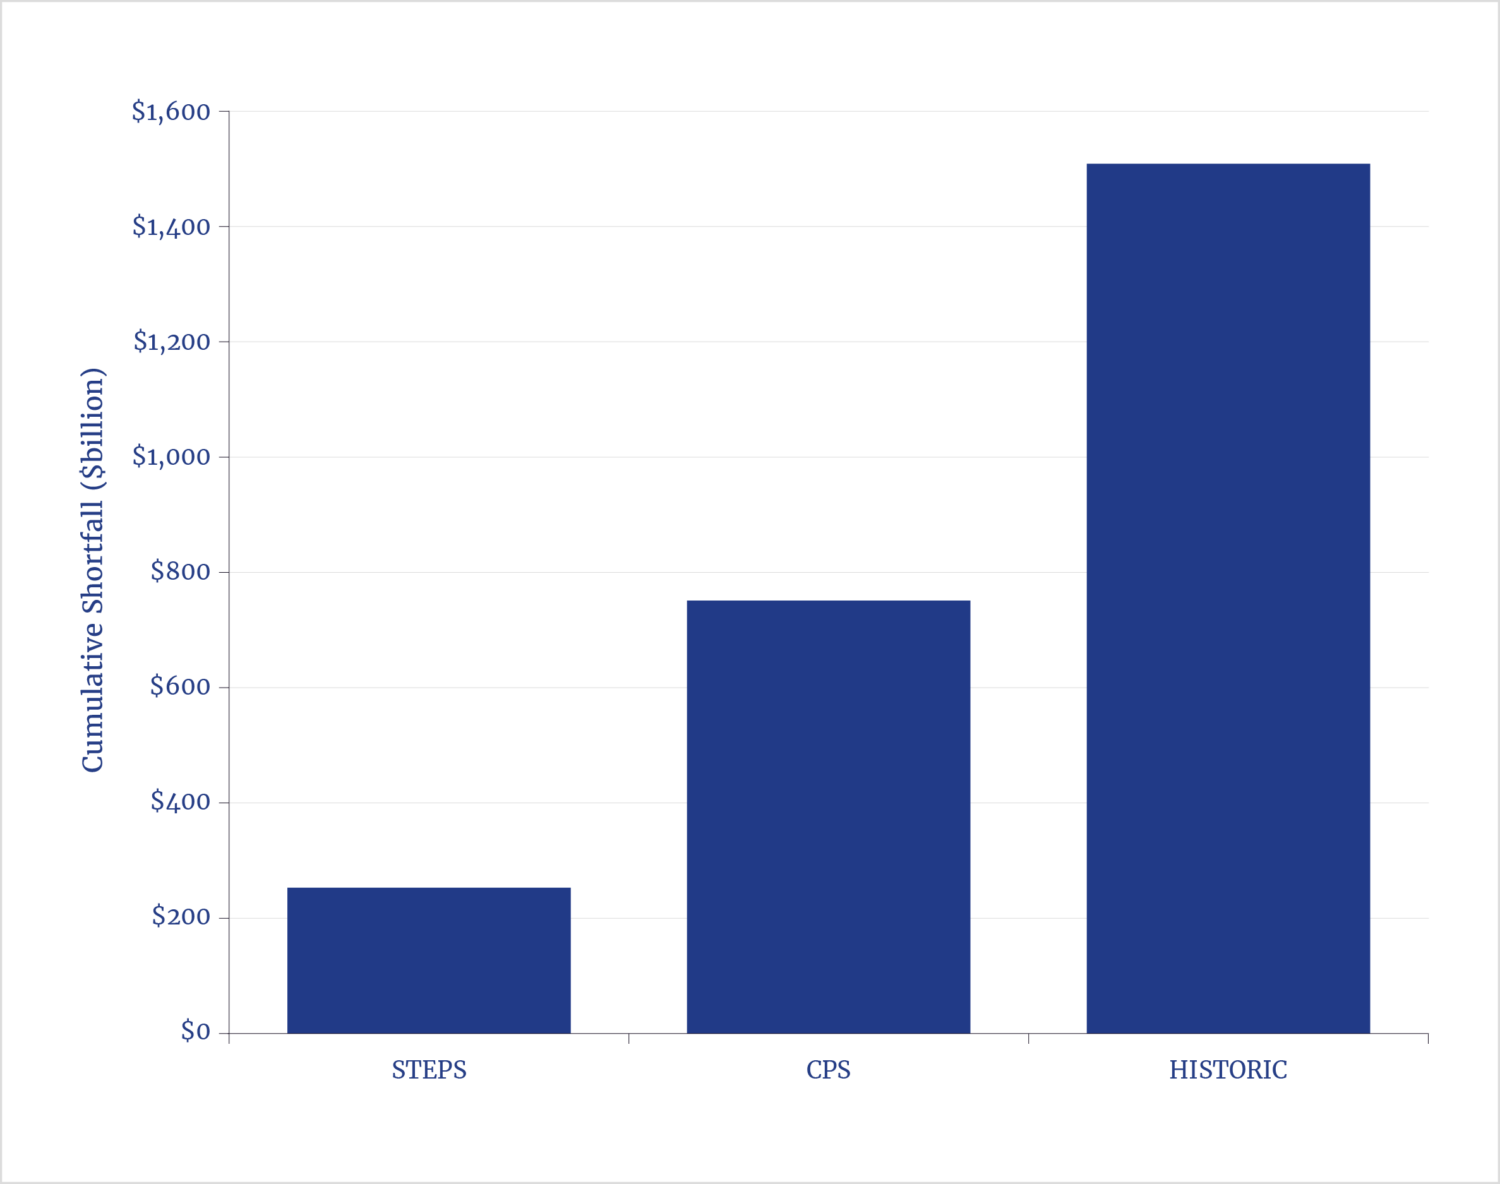
If the CPS proves to be a reasonable approximation of how the near future unfolds, the world will require an additional $750 billion in cumulative investment in exploration over the coming decade to ensure that new oil and gas supplies are available. Global spending on oil and gas exploration and development dropped by 30% a decade ago and has since remained close to that lower level. WEO 2025 indicates that—even under the STEPS, which shows an essentially no-growth scenario for oil—maintaining current spending levels would result in a cumulative shortfall of $300 billion in exploration investment over the next 10 years. For context, if the world were to need exploration and development at the level seen during the first 15 years of the twenty-first century, the coming decade would be short $1,500 billion in cumulative exploration investment (see figure ES-1). The realistic possibility of a future with significant undersupply of oil raises important questions about both the extent of the resulting price increases and the sources of supply that would fill the gap. The former has clear economic implications, while the latter carries significant geopolitical consequences.
Figure ES-1. Investment Shortfalls in Global Oil and Gas Exploration and Development: 2025–35
In recent years, the IEA’s focus on the aspirations that are inherent in many national energy policies—rather than on including realities—paints a picture of possible futures that are self-evidently unrealistic and can thus mislead policymakers and investors who view WEO as an important, if not key, contribution to planning. WEO 2025 marks a significant yet incomplete return to analytical realism. The world will consume more energy, including more oil, for far longer than previously projected. This emphasizes the urgent need for policies that balance emissions reduction goals with affordability, security, and economic development—three factors that are vital for global prosperity and stability.
Introduction and Context
In the energy policy world, the annual publication of the International Energy Agency’s World Energy Outlook (WEO) is a seminal event. The 2025 edition may be one of the most consequential in recent years, marking a significant change in tone from the 2024 report.
Herein is the second National Center for Energy Analytics (NCEA) analysis of WEO. It builds on the January 2025 report Energy Delusions: Peak Oil Forecasts: A Critique of Oil “Scenarios” in the IEA World Energy Outlook 2024. In that report, NCEA identified 23 “flawed assumptions” in the IEA’s analysis regarding the future of oil. NCEA’s analysis concluded that “the IEA’s current preoccupation with promoting an energy transition has resulted in its signature annual report . . . offering policymakers a view of future possibilities that are, at best, distorted and, at worst, dangerously wrong.”1
The critique of WEO 2024 focused on three of the IEA’s models—Stated Policies Scenario, Announced Pledges Scenario, and Net Zero Emissions by 2050 Scenario—that were anchored in an unrealistic, aspirational view. The 2024 report considered only scenarios that assumed the energy transition policies and goals would, either wholly or in part, become reality. In short, the IEA had abandoned its Current Policies Scenario (CPS), a forecast based on traditional assumptions that had been a mainstay of WEO through 2019. The IEA removed the CPS from the 2020 edition and subsequent publications of WEO. Yet with the 2025 edition, the IEA has made a welcome return to including a more realistic and balanced analysis of energy systems in general and oil demand in particular.
The five-year exclusion of the CPS constituted a significant gap in the analytical framework. The IEA was correct in its observation that fully implementing the energy policy goals promised by its member governments would lead to a significant transformation of the global energy mix. However, policymakers are ill-served if the CPS is not included as a baseline with which to assess the likely continuation of business-as-usual trends.
Indeed, many policies have not been implemented as intended, and the global energy system has continued to evolve through energy additions rather than energy transitions. In 2024, fossil fuels accounted for 80.6% of all primary energy consumption, only slightly down from 81.5% in 2023 and little changed from 87% in 2010.2 That reality, despite the enormous increase in renewable energy investments in many countries, risks eroding the IEA’s credibility by focusing only on scenarios that are arguably or demonstrably unrealistic.
Contemporaneous with NCEA’s critique of WEO 2024, many other organizations also faulted the IEA’s focus on aspirations, including pressure from the United States government3 that called for reinstatement of the CPS to reflect the reality of energy markets. Now that the IEA has done so, the CPS presents policymakers with a future view that is closer to reality—one significantly different from any considered in WEO 2024. This is particularly relevant for understanding future demand and investment in the upstream oil and gas sectors, a subject that will be explored further in a more detailed response to some of the IEA’s assumptions in WEO 2025.
By reinstating the CPS, the IEA has gone a long way toward answering the criticism that its scenarios are divorced from reality. The IEA’s shift, as recommended in NCEA’s previous assessment, aligns with views expressed by several major energy market participants and commentators, including Bloomberg, which has applauded the IEA’s higher projection of future energy demand as a more pragmatic reflection of underlying realities4—one that could help governments to better balance emissions reduction objectives with the growing need for reliable and affordable energy. The U.S. Energy Information Administration has historically forecast that oil demand will grow strongly through 2050,5 in line with the IEA’s restored CPS. Within the energy industry, Exxon welcomed the IEA’s shift.6
In WEO 2025, the IEA asserts that the restored CPS is not, strictly speaking, a business-as-usual (BAU) scenario.7 That is a reasonable stance, as BAU conveys the unlikely implication that no further policy changes will be implemented. However, a true BAU scenario remains valuable for policymakers because it can highlight the extent to which the CPS diverges, and thus it can establish a baseline for understanding the magnitude and cost of any gains from prioritizing decarbonization policies.
It is clear that any energy transition will proceed, at best, at a far slower pace than the IEA anticipated in WEO 2024. As the IEA and others have noted, many governments are scaling back from programs such as electric vehicles subsidies or target dates for bans on the sales of new internal combustion engine vehicles. Budgetary pressures, strategic and security issues, and political resistance are all playing an increasing role in this pushback.
In WEO 2024, the IEA saw peak demand for fossil fuels by 2030.8 Yet the evidence is undeniable that the use of oil, natural gas, and coal is growing, with each seeing record demand in 2025. The problem is that projections of near-term peak demand can influence investment decisions by energy companies, which are crucial to ensuring sufficient supply.
The unavoidable truth is that fossil fuels are central to enabling developing countries to move out of poverty, even as they also invest in renewable energy. China and India are the lead examples. Since 2000, their consumption of renewable energy has soared by a factor of 17 in the case of China and sixfold in India, yet the share of total energy consumption from fossil fuels remains well above 90% for both countries.9
In rich countries, earlier ambitions for rapid and widespread electrification of transport are not being met. Additionally, there is the relatively new demand factor from the enormous expansion of data centers to support the artificial intelligence (AI) revolution, with 24-7 electricity needs being largely supplied (thus far) by fossil fuel–generated electricity. The full impact of this revolution cannot be easily assessed at this early stage, and—as the IEA has noted—the scale is quite significant in the Western nations where earlier forecasts had not taken AI into account.
A striking development in WEO 2025 is the IEA’s decision to drop its Announced Pledges Scenario (APS), a wildly ambitious scenario that featured a wish list of every possible transition policy with the assumption that all would be implemented. But the APS was often interpreted by media and policymakers as a central or even plausible trajectory, especially when paired with the IEA’s recent messaging on peak fossil fuel demand by 2030.
Given how far today’s energy mix is from the ambitions laid out by policymakers, retaining the APS seemed pointless, and it is hard to envision it reappearing in WEO anytime soon.
Nonetheless, the IEA continues to retain the controversial Net Zero Emissions (NZE) by 2050 Scenario, which—at the other end of the spectrum from the CPS—envisages a world that actually achieves net-zero carbon dioxide emissions by 2050. The value in this scenario is that it can serve as a reference point to illustrate what would have to happen in only 25 years to achieve net zero. However, this path now seems even more unrealistic than when it was first published in 2021. Indeed, in an epic understatement, the IEA itself states in WEO 2025:
Actual emissions have risen year after year, and continued investment in high-emitting infrastructure has constrained the path ahead. To meet the near-term emissions benchmarks necessary to avoid substantially exceeding the 1.5°C target, each successive edition of the NZE Scenario has featured more rapid near-term emissions reductions, stretching feasibility to its limits [emphasis added].10
In WEO 2025, the IEA has introduced a new scenario. The Accelerating Clean Cooking and Electricity Services Scenario (ACCESS) outlines policies to achieve universal energy coverage. Currently, according to the IEA, about 730 million people lack access to electricity and 2 billion people cook food using relatively primitive energy sources.11 To its credit, the IEA has for several years sought to bring together policymakers and financial institutions to propose solutions. On December 11, 2025, the IEA announced a 2026 summit in Kenya to further advance this objective.12 Leading countries, including the United States,13 are supporting this initiative.
Commentary and Critiques Regarding the IEA’s Key Questions in WEO 2025
WEO 2025 contains 10 key questions that the IEA uses to frame the energy future.14 Since NCEA’s analysis at this time is focused mainly on oil forecasts, this critique does not address all 10 questions and instead comments on the four that are relevant to oil—namely, numbers 1, 2, 7, and 10.
WEO 2025 #1. The CPS and STEPS are exploratory in that they work forward from slightly different starting assumptions. What do these scenarios tell us about the direction in which the energy world is heading?
Comment: The answer to the IEA’s question about where the world is heading is clear—more fossil fuels will be needed for far longer than earlier hypothesized.
The two scenarios present a 2050 outlook that can be summed up as being more of everything than the IEA projected this past year in WEO 2024. Since the IEA published the previous CPS in 2019—before the COVID-19 pandemic and its effects—it is difficult to compare the CPS in WEO 2025 with that of previous versions. In 2020, oil demand fell by nearly 9 million barrels per day (mb/d), which is equivalent to 8.5%, and other energy sources also showed steep declines; this dramatically lowered the base from which future outlooks were made.
The CPS in WEO 2025 clearly shows that—absent a widespread and politically unlikely tightening of climate policies—total energy consumption in 2050 will be 32% higher than in 2024, with an average growth rate of 1.1%. The STEPS, using the same comparison, shows growth of 19% at an annual average rate of 0.7%. Given shifting governments and policy uncertainties inherent in a 25-year scenario horizon, policy priorities can and may change radically.
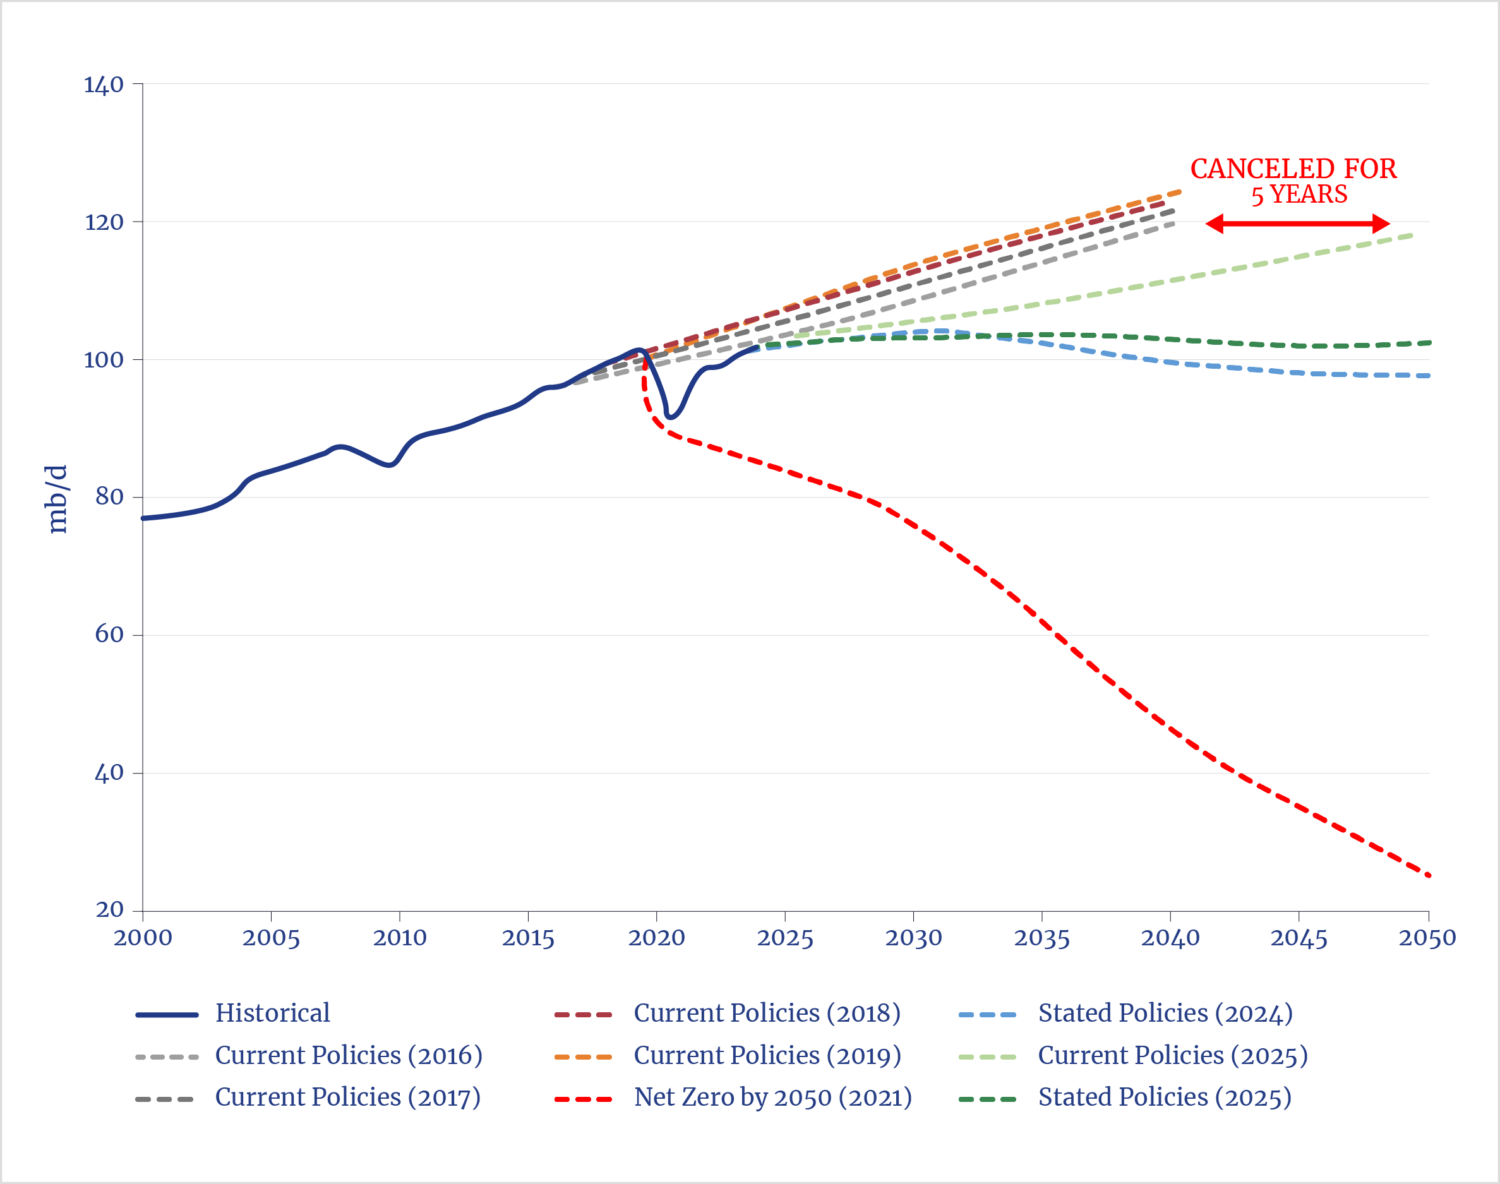
Meanwhile, reality has a habit of getting in the way. Figure 1, compiled by Rapidan Energy Group, illustrates how the STEPS in WEO 2025 constitutes a major difference with respect to oil demand compared with just one year ago. Understandably, the CPS data for the years prior to its discontinuance did not anticipate COVID-19, which caused a brief but significant drop in oil demand.
Figure 1. IEA Long-Term Global Oil Demand Forecasts
Both the CPS and STEPS in WEO 2025 project steadily rising total energy demand through 2050. Under an assumption of weaker support for energy transition policies, the CPS shows continued growth in oil and natural gas consumption through 2050, while even coal—the demise of which has been a staple of IEA outlooks for some years—is expected to decline by less than the previously anticipated 22% by 2050.15 Notably, in mid-December 2025, the IEA released its annual five-year coal outlook,16 which projects that coal consumption will peak in 2025 or 2026 and fall to only about 3% below the 2024 level by 2030.
In the STEPS, liquid fuels—dominated by oil—reach a plateau in the early 2030s and are little changed in 2050. Natural gas continues to grow out to 2050, and coal, as in the CPS, experiences only a modest decline during that period.
Projections in the CPS and STEPS out to 2035—as WEO does not show data for 2030—are very similar in their outlooks for oil demand (see figure 1). By contrast, looking out to 2050, WEO 2025 forecasts a substantial increase in oil demand relative to that stated in WEO 2024.
Comparing the STEPS in WEO 2025 and WEO 2024 similarly reveals a pronounced increase in projected fossil fuels demand by 2035 (see figure 2).
Figure 2. Comparison of Fossil Fuel Demand Outlooks
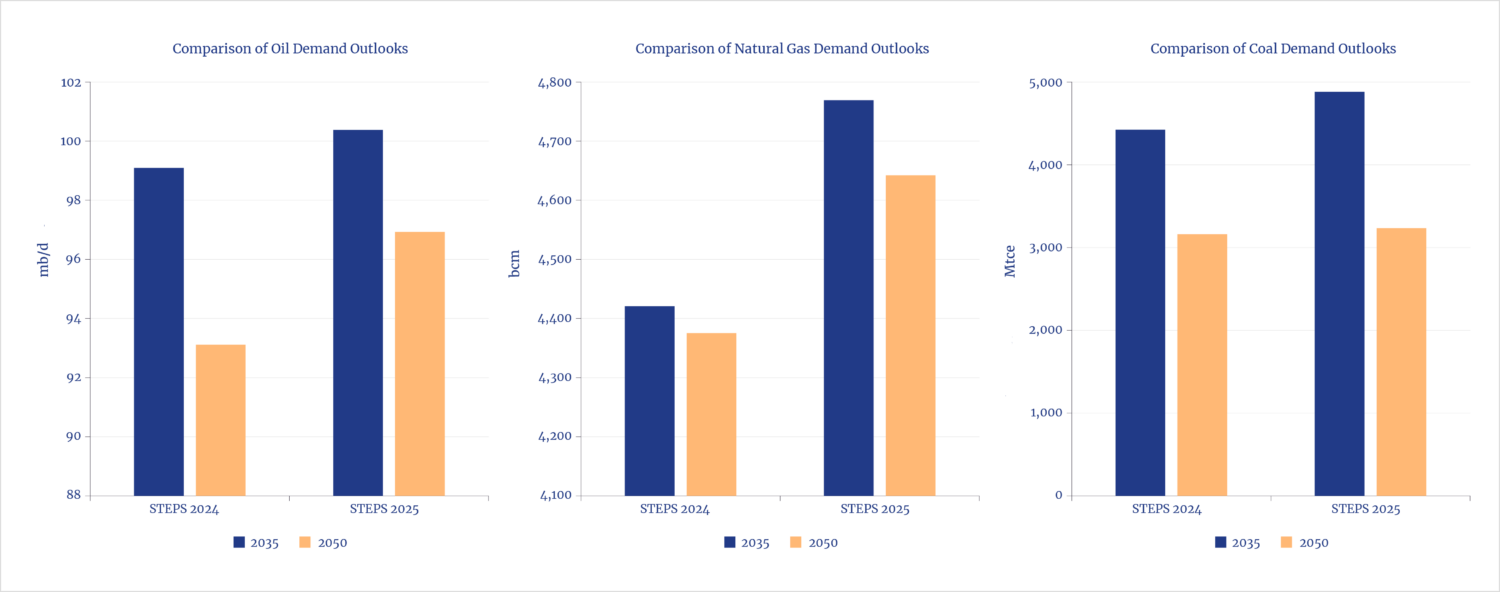
Source: Data from IEA, World Energy Outlook 2025 (IEA, 2025); calculations by the authors.
For the relatively short time horizon to 2035, the WEO 2025 projection for oil demand exceeds the WEO 2024 forecast by 1.3 mb/d; by 2050, the increase in forecast demand is nearly 4 mb/d higher than modeled in WEO 2024. These are consequential changes in demand within the oil sector that necessitate substantially greater investments in exploration and production than envisioned in WEO 2024.
Natural gas and coal—neither of which is the main focus of this report—also exhibit substantial upward revisions relative to WEO 2024. In the shorter term to 2035, demand estimates for gas and coal increase by 9% and 10%, respectively. By 2050, demand revisions rise by 6% and 2%, respectively.
Taken together, these changes effectively undermine the IEA’s oft-repeated claim of peak fossil fuel demand by 2030—a theory that has dangerously influenced many energy policies.
WEO 2025 #2. What are the implications of all the IEA scenarios for energy-related emissions and the rise in global average temperatures, and what does this imply for the discussions at COP 30 in Belém, Brazil?
Critique: The Conference of the Parties (COP) process faces growing challenges in addressing real-world energy needs and bridging implementation gaps in climate discussions.
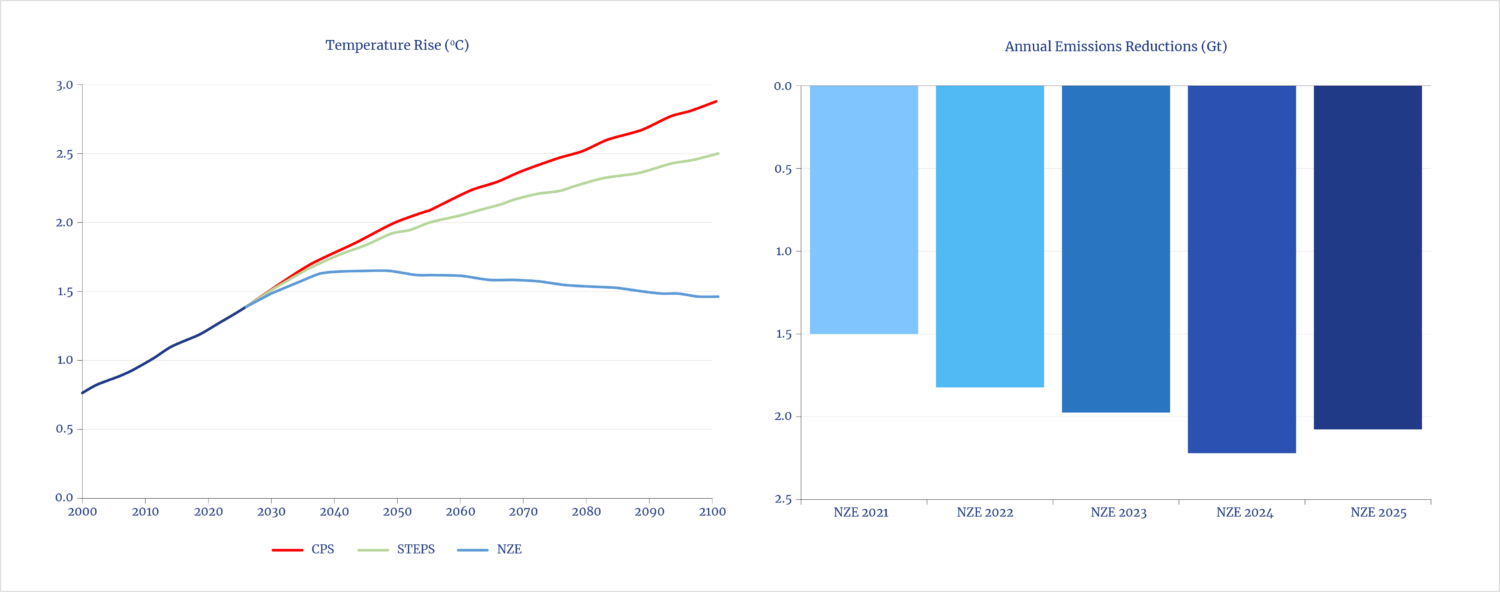
The IEA states that climate models assume global average temperatures will rise during the forecast period to 2050 (see figure 3):
In the CPS, warming exceeds 2°C around 2050, reaches 2.9°C in 2100, and is set to keep rising from there. In the STEPS, lower levels of emissions produce outcomes that diverge somewhat from those in the CPS. Warming exceeds 2°C by around 2060 and reaches around 2.5°C by 2100. The 2025 version of STEPS shows an increase in warming compared to its previous iterations.17
It is outside the scope of this project to critique the accuracy of climate models. However, it should be noted that such models underpin energy transition policies—including those intended to radically reduce oil use—that are assumed or advanced by the IEA.
Figure 3. Global Temperature Rises and Emissions Reductions
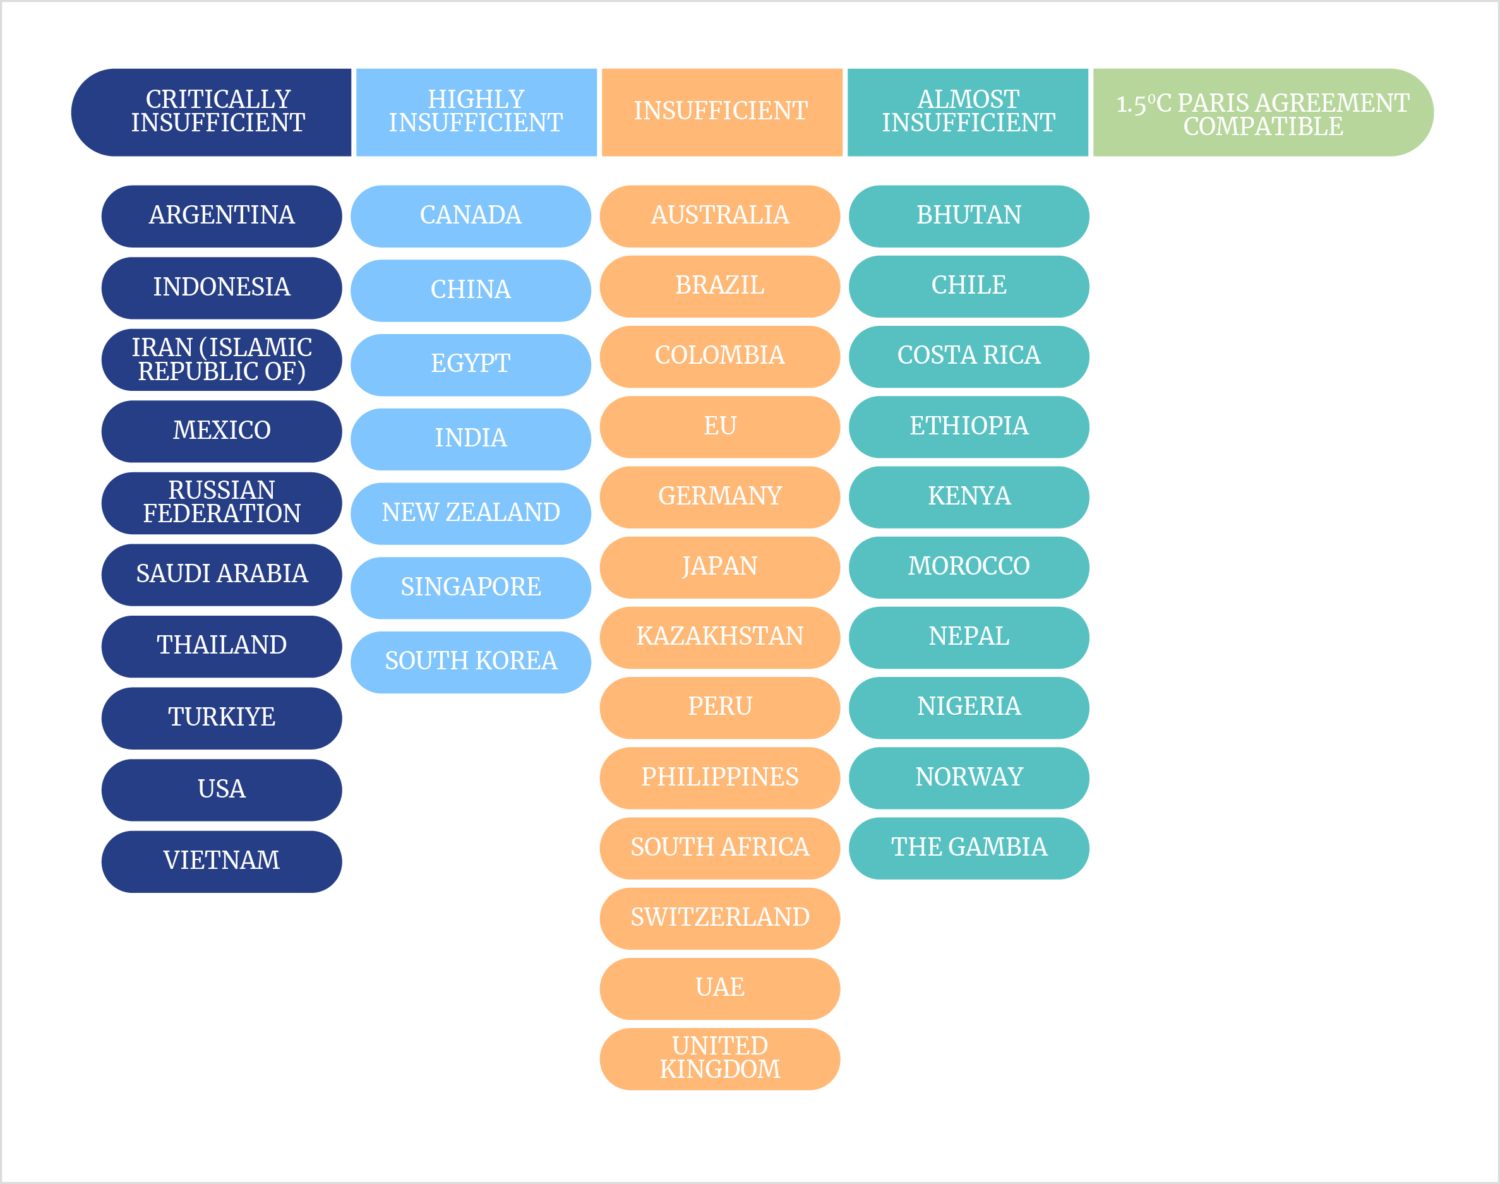
In the WEO 2025 version of the STEPS, the IEA’s model shows steadily rising emissions through 2050. Viewing these scenarios in the context of the COP process highlights the growing gap between the Paris Agreement’s ambitions, which animate the WEO energy scenarios, and the actual trajectory of the global energy system. As figure 4 shows, countries’ performance in meeting their announced or implemented energy-related climate goals remains very poor. Major economies18—adding up to 70% of global gross domestic product—are rated either insufficient, highly insufficient, or critically insufficient in regard to implementing policies or aspirations intended to reduce hydrocarbon use in general and oil in particular. This reality underscores the importance of the IEA’s restoration of the CPS.
Figure 4. Lack of Progress in Implementing Climate Policies
While WEO has in the past been published prior to each year’s COP, WEO 2025 was released in mid-November 2025 after the COP 30 conference in Brazil had already begun. Nonetheless, the IEA’s scenarios are likely to have influenced the discussions. The COP process has become increasingly disconnected from real-world energy systems planning. It needs to broaden its focus to include greater emphasis on climate adaptation and resilience rather than to maintain a singular focus on a drastic reduction in fossil fuel use—an outcome that no realistic forecast suggests will happen.
Meanwhile, there has been an increasing focus on the role of adaptation and resilience in response to future climate changes. Many analysts and policy influencers, including Bill Gates,19 suggest that wealthy countries should focus more on combating disease and poverty in the world’s poorest nations. And, in many developed countries, political pushback is mounting against climate policies that are seen as partly responsible for high energy prices, especially those affecting electricity. Given the realities in play and the changing sentiment toward climate policies in many countries, the IEA’s work with respect to climate should include a deeper analysis with scenarios that lean toward adaptation. In WEO 2025, that word appears only once; future editions of WEO should address this further.
WEO 2025 #7. Export controls on rare earth elements in 2025 have highlighted the importance of these new dimensions to energy security. How are critical minerals and other emerging issues changing the energy security landscape?
Critique: The supply and costs of energy minerals are central features of energy transition scenarios—particularly those involving the replacement of oil-burning vehicles—but WEO 2025 would benefit from a more comprehensive approach to modeling scenarios that reflects the realistic potential for shortfalls and price escalations in minerals.
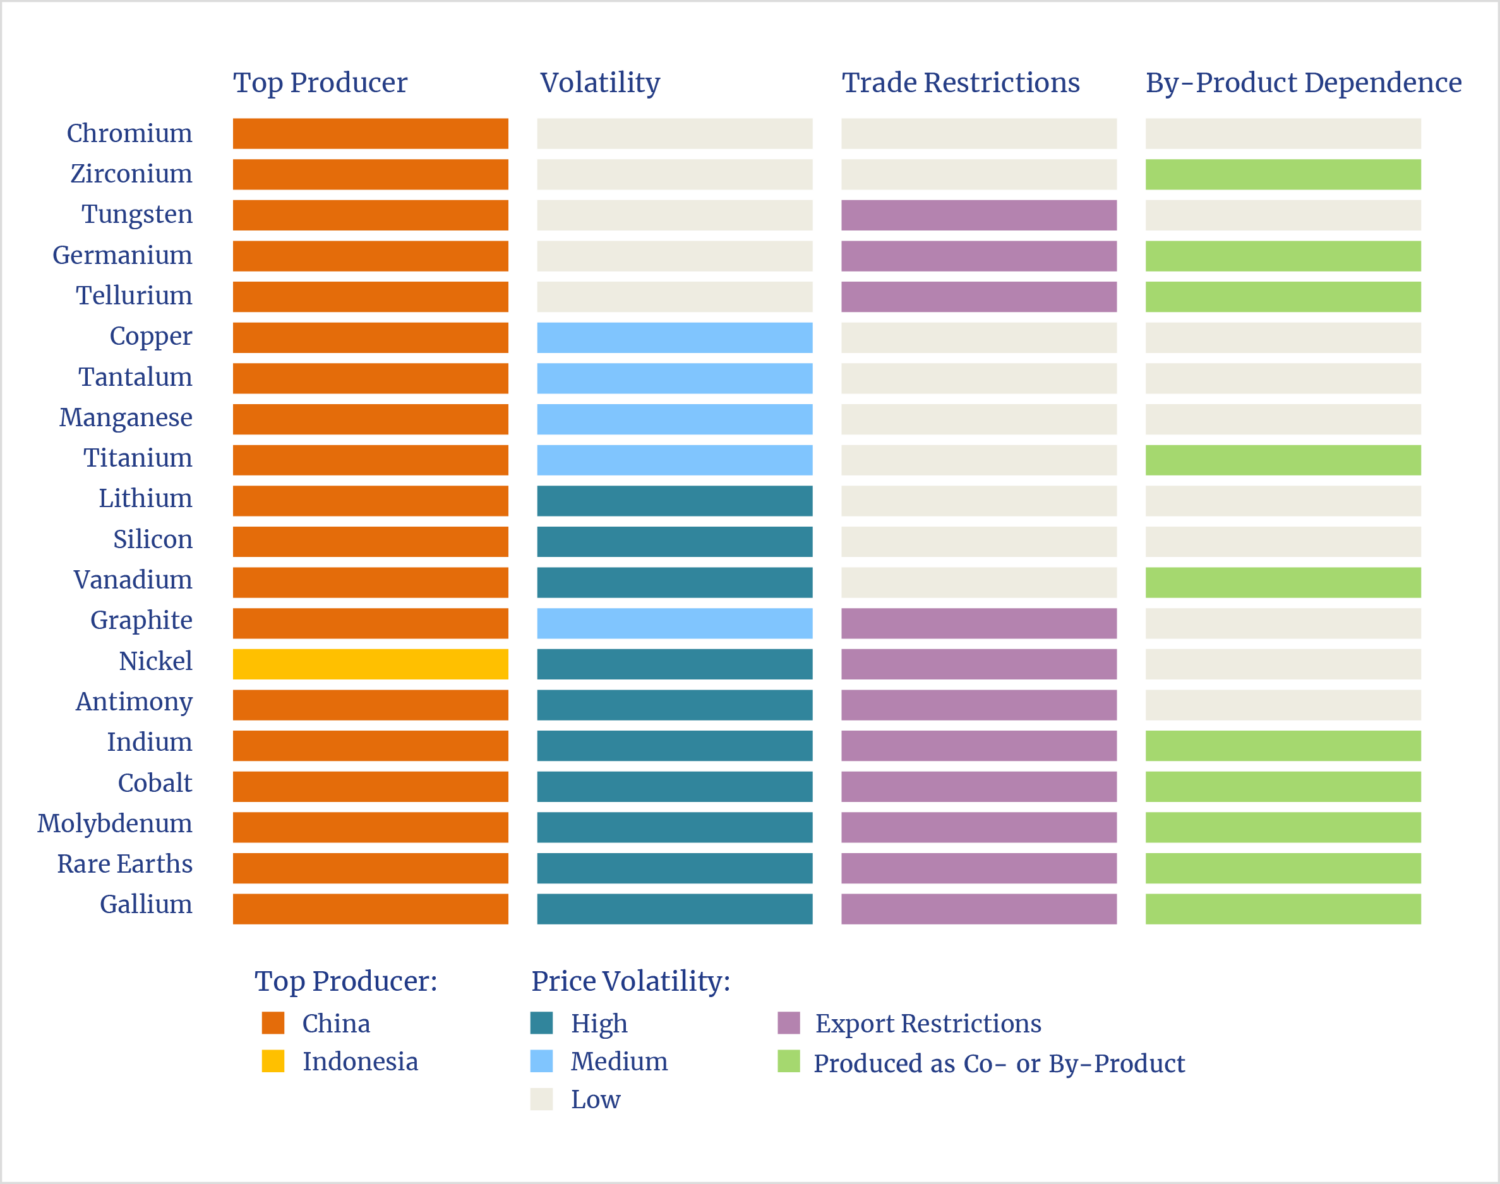
In WEO 2025, the IEA appropriately highlights the heavy concentration of critical energy minerals production and refining in a limited number of countries, as well as recent trends in export restrictions imposed by several countries. WEO 2025 contains dozens of references to critical minerals. The issue of global supply concentration—particularly with reference to China—is analyzed in chapter 5.2.3, which features an excellent chart that summarizes the state of play (see figure 5).
Figure 5. Concentration of Critical Minerals
On May 21, 2025, the IEA published Global Critical Minerals Outlook 2025, a 312-page report on this issue.20 In turn, on October 21, 2025, NCEA published a criticism of key shortcomings in the IEA’s analysis:
The IEA report neglects to sufficiently identify and analyze the market-shaping activities by countries such as China, which undermine Western investment and operations. This is a massive supply-chain security issue that affects nearly every mineral at different stages of the value chain. The U.S. and other nations remain vulnerable to supply shocks and shortages if they are unable to deploy the tools and create investment conditions to compete with China’s market dominance.
The IEA does not adequately address the mining industry’s struggle to secure and maintain a “social license to operate” (SLO). SLO issues delay or undermine industry attempts to increase the supply of critical minerals. They also lead to broken trust with resource-rich communities and a lack of shared purpose around minerals projects, ultimately undermining prosperity for all stakeholders.
The IEA report neglects to adequately account for ore grade decline and the lack of innovation in critical areas, such as tailings (waste), water, and mining energy usage. Innovation is desperately needed to address these challenges and requires a multi-sector approach.
The IEA does not fully explore the implications of projected minerals deficits. This is purely a numbers game, and highly specific to each mineral. While the IEA report does project a 30% shortfall in copper supply21 . . . the global energy and industrial market disruptions that would occur as a result are insufficiently unpacked. Further, the implications of lithium, nickel, and rare earth shortages are also ignored, despite the serious consequences.22
WEO 2025 contains a section titled “Serious threats are hanging over critical minerals supply chains.”23 Although it addresses the concentration of critical minerals production and processing, as well as export controls, the report omits any discussion or analysis of mineral transportation to markets—even assuming that no impediments to exports or barriers to expanding refining and trade exist. Given the nature of these bulk materials, oceangoing ships are the primary means of transport, but the report neither discusses nor models the potential for a severe shipping capacity squeeze.
Earlier in 2025, NCEA addressed this issue in a report that explored the challenges for the shipping industry to meet the magnitude of materials needed in energy transition plans:
According to the IEA and others, building all that renewable hardware entails a massive fourfold to sixfold increase in the use of critical and rare earth minerals. That unprecedented increase in the volume of these minerals mined and refined will necessarily entail a collateral increase in the need to transport all those gigatons of materials, most of them by sea. The global maritime industry already faces significant logistical, infrastructure, and manpower challenges to meet today’s needs for moving bulk goods. Advocates of an energy transition have failed to consider the shipping capacity required to transport the staggering rise in maritime ton-miles needed for the transition.24
The IEA has correctly identified access to minerals as a major weakness of efforts to decarbonize energy, particularly in substituting for oil-burning vehicles. Although WEO 2025 highlights practical mineral supply challenges as well as growing security and geopolitical risks, the IEA’s scenario modeling requires significant development to reflect the real-world challenges that are starkly evident in these domains.
WEO 2025 #10. Answers to many of the biggest questions about the future will depend on investment. What do energy investment projections tell us about potential gaps and risks?
Critique: WEO contributed to a potential emerging shortfall in critical oil supplies through its narrative in recent years of a near-term peak in oil demand, accompanied by calls to end exploration and development. As WEO 2025 finally acknowledges, far more upstream oil investment is needed to supply rising demand; with very little spare production capacity, this investment must be ramped up soon.
This analysis confines its comments to the oil sector. Ahead of the WEO 2025 release, the IEA published an important September 2025 study on oil and gas field decline rates25—its first such in-depth discussion of this issue since 2010.26 The NCEA published a response in October 2025.27
The reintroduction of the CPS has forced the IEA to backtrack on its landmark 2021 report Net Zero by 2025: A Roadmap for the Global Energy Sector28 (updated in 202329), which called for an immediate end to all investment in new oil and gas projects. With the assumption that unrealistic policy goals would be achieved, the IEA concluded that investments in new upstream oil and gas projects would become unnecessary. Indeed, the IEA warned of oil and gas investments becoming stranded assets.
In a consequential reversal, the CPS in WEO 2025 projects oil demand reaching an additional 12.8 mb/d above 2024 levels by 2050. This more realistic scenario underscores the obvious need for substantial additional investments in new production to meet rising demand and for spending on projects and technologies that will offset the natural rates of decline in existing fields. The IEA’s analysis distinguishes between observed field decline rates and natural decline rates. Observed decline rates average nearly 6% globally. Natural decline rates—defined by the IEA as the potential decrease in production if all upstream investment ceased—indicate that global oil production would fall by an average of 8.5% annually, a rate of decline that has increased in recent years. This equates to an annual loss of approximately 5.6 mb/d. Although a complete halt in investment is an extreme and unlikely scenario, even a small decline from current upstream investment levels would lead to consequential global oil supply shortfalls.
The major factor contributing to the faster overall decline rate reported by the IEA is the growing share of U.S. shale oil production in the global total. By the end of 2025, U.S. shale oil production had reached a monthly average of just over 9 mb/d,30 with total U.S. crude oil production just below 14 mb/d. While production growth has been extraordinary—U.S. shale oil production was under 0.5 mb/d in January 2008—the decline rates, however, are significantly high. A recent study by the IEA states:
The natural decline rate for tight oil and shale gas, i.e., the drop in production if all capital investment and drilling were to stop, is very steep. More than three-quarters of the 10[,]000 tight oil wells that began production in 2025 in the United States are needed simply to compensate for declines at existing wells. Based on a detailed play-by-play assessment, we estimate that if no new wells were to be completed after the end of 2025, then U.S. tight crude oil and condensate production would fall by around 3.5 mb/d by the end of 2026 (a 35% decline), and by an additional 1.2 mb/d in the year thereafter (a further 18% decline).31
As noted, according to the IEA, the global average post-peak natural decline rate is about 8.5%.
While not all investment and drilling will stop, the IEA’s analysis and its CPS estimate of rising oil demand through 2050 underscore the necessity of policies that encourage increased U.S. oil production—even if only to offset decline. The IEA anticipates that the U.S. will be the second-largest contributor, in dollar terms, to upstream oil and gas investment through 2035, after Russia (see figure 6). However, the weakening of oil prices toward the end of 2025 and into 2026 raises doubts about the pace of investment growth.
Figure 6. Oil and Gas Investment Outlook
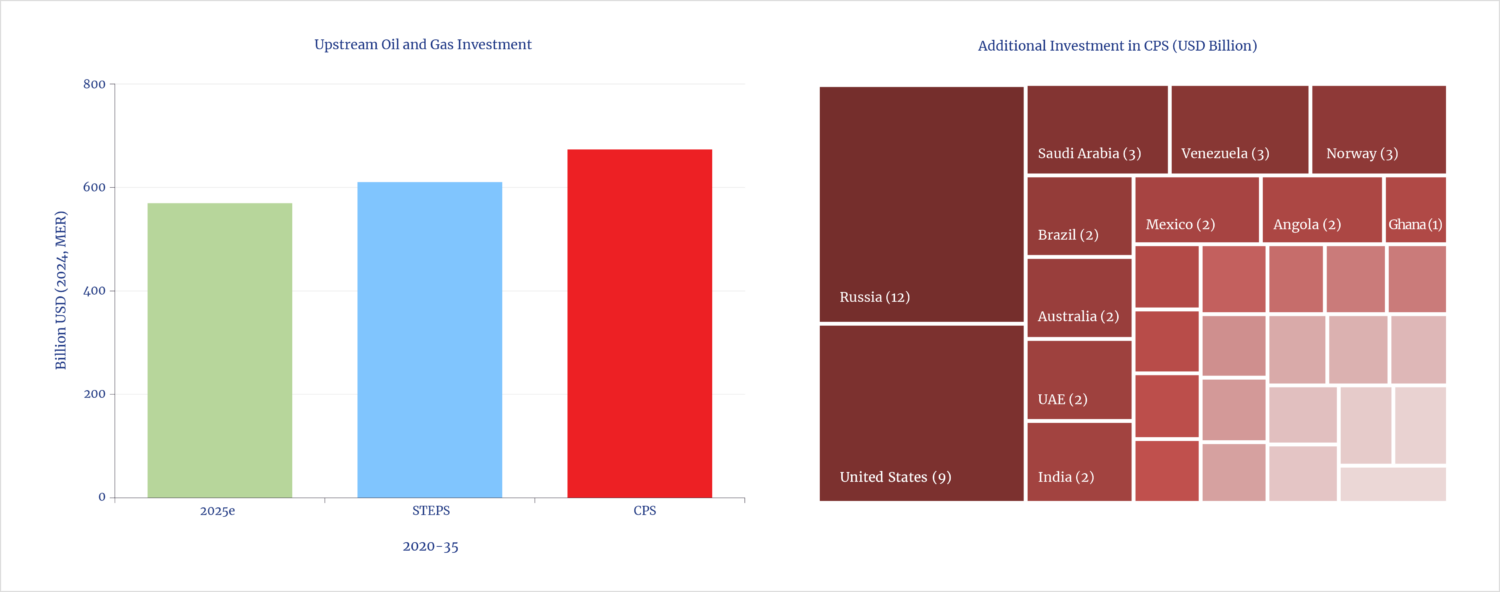
To meet the record levels of oil demand anticipated by the CPS for 2050, more investment will be needed not only in the upstream sector but also in pipelines, export and import terminals, refining, and shipping.
There are, of course, important geopolitical issues at play—many of which are difficult to model or predict. It is impossible to know how the geopolitical landscape will evolve even in the short term, much less by 2050. As WEO 2025 states, “the CPS assumes that by the latter part of the projection period constraints on oil production and trade in countries currently subject to sanctions ease, so their output is determined by the underlying economics.”32 The countries referred to are Iran, Russia, and Venezuela; the IEA implies that these nations will be able to invest in their industries, expand production, and—crucially—grow exports.
The biggest potential for any significant future increase in oil production lies with Venezuela, which, at the time of writing, remains subject to considerable political uncertainty.
In reality, global oil and natural gas investment has been weak over the past decade (see figure 7).33 After a peak in 2015, investment plummeted following the oil price collapse of that year and was further affected by the COVID-19 pandemic in 2020. The IEA’s 2025 investment estimate remains lower than that of 2019.
Figure 7. Oil and Gas Capital Expenditures
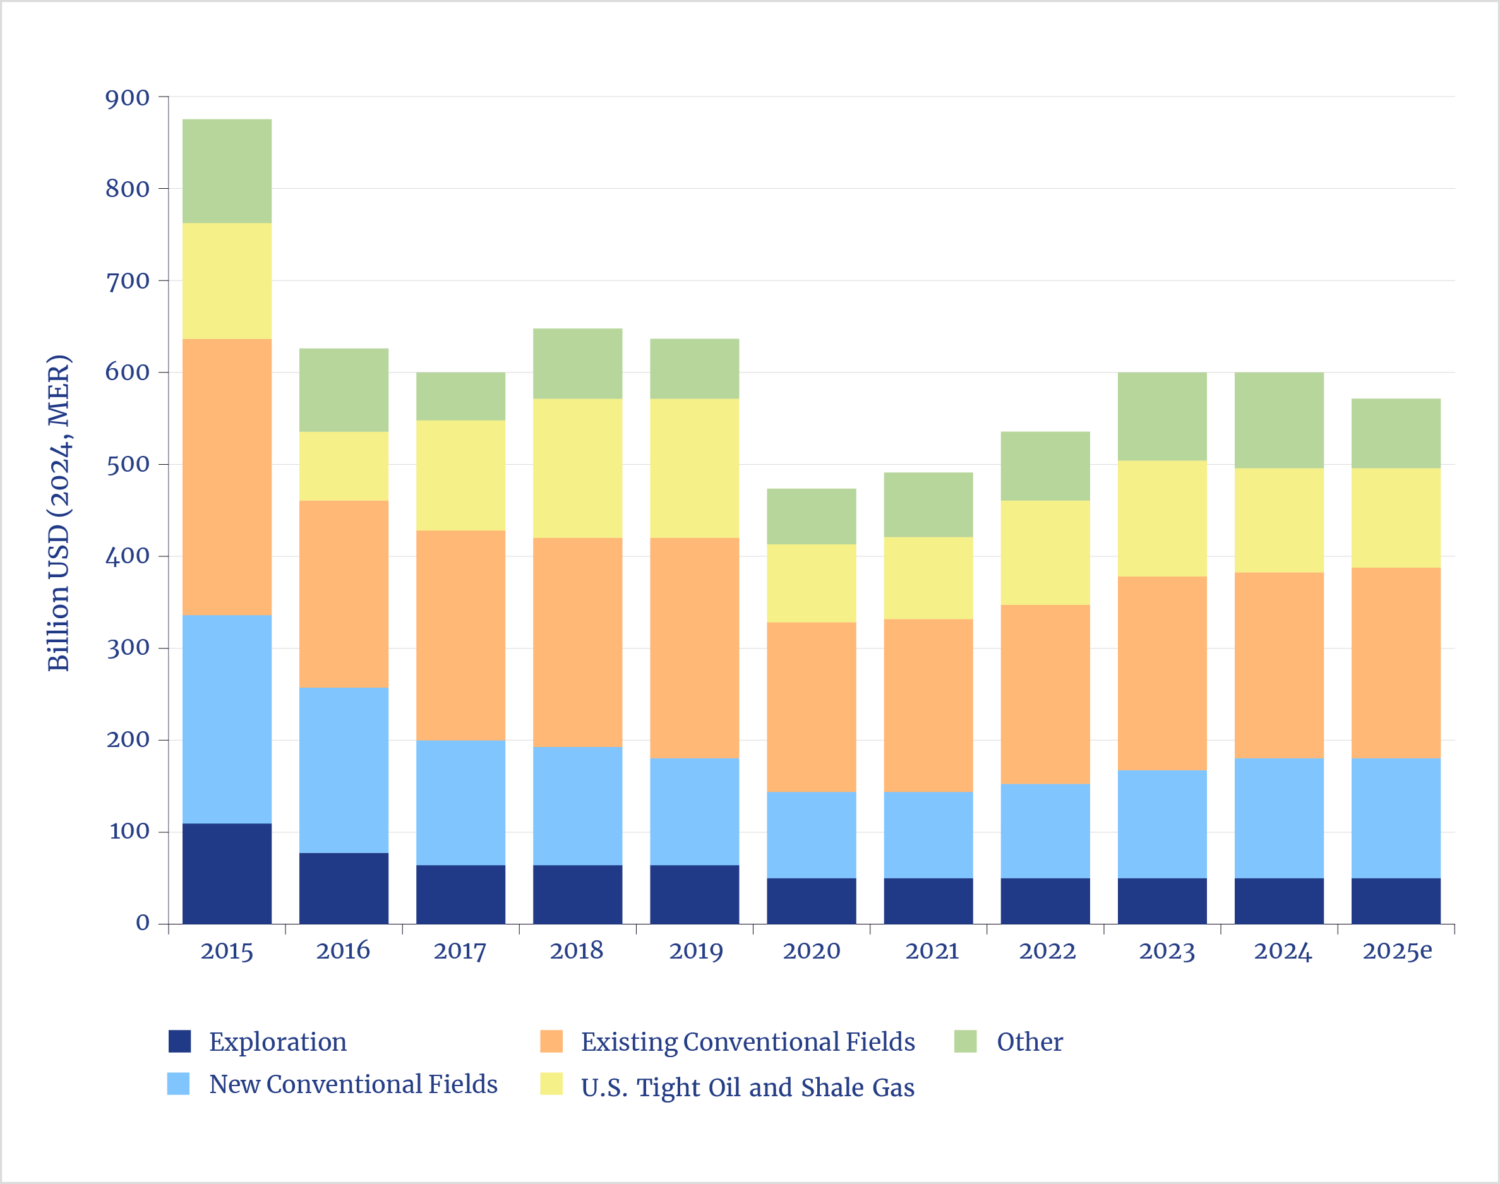
Source: Adapted from IEA, The Implications of Oil and Gas Field Decline Rates (IEA, 2025), 21, figure 16.
It remains to be seen whether the sensible restoration of the CPS in WEO and its implications for long-term oil demand growth will provide sufficient justification for oil companies to increase upstream investment. Over the past decade, pressure from investors and analysts—including those advocating for environmental, social, and governance reasons—has sometimes led to a reluctance to invest in new oil production. The IEA’s projection of peak oil demand by 2030, which functions more as a de facto forecast than a scenario due to its short time frame, has been highly influential in promoting a mindset and even investment decisions that, should the CPS reflect the actual outcome, risk the emergence of a severe global undersupply of oil.
In WEO 2025, the IEA presents two scenarios for upstream oil and gas investment, though these are projected only through 2035 (see figure 6). The increase in the CPS investment figure for 2035 is only slightly higher than the 2025 estimate, and it remains well below the 2015 level. Depending on assumptions regarding capital and technical efficiency—as well as about the geopolitical situation vis-à-vis Iran, Russia, and Venezuela—the main Middle East producers and the U.S. are expected to continue to invest significantly.
In the short term, neither the fall in oil prices seen at the end of 2025—in mid-December, Brent crude oil briefly traded below $60 per barrel for the first time since February 2020 amid the start of the COVID-19 pandemic—nor the expectation that oil prices will remain subdued until well into 2026 offers much encouragement for either domestic U.S. or international oil companies (IOCs) to increase their investment expenditures. Nonetheless, the revived CPS in WEO provides support for policies that are anchored in the likelihood of greater long-term demand for oil and gas.
The need for more investment in the upstream sector is amplified by the uncomfortable reality that, following the unwinding of voluntary output cuts in 2025 by members of the OPEC+ alliance,34 it remains unclear how much spare production capacity exists. The consensus among experienced analysts is that about 3 mb/d of spare capacity remains, nearly all of which is found in Saudi Arabia, Kuwait, and the United Arab Emirates. Spare capacity is critical for mitigating unexpected production losses—whether due to natural disasters, geopolitical conflicts, or other issues—that could then trigger substantial and even destructive price spikes. Non-OPEC+ countries are deemed to be producing at or near full capacity. If the CPS is even roughly accurate concerning demand growth, significant increases in investment will be necessary in the next few years. Additionally, the CPS in WEO 2025 projects that OPEC+ alliance countries will have a 55% share of global liquids production by 2050, an increase from the 50% seen in 2024;35 this highlights the ongoing geopolitical importance of the alliance.
Even before the IEA reinstated the CPS in WEO, IOCs were scaling back and even abandoning investments in non–fossil fuel sectors. Most companies are adopting a back-to-basics approach and refocusing on their core expertise in producing fossil fuels. Recent examples from Shell and BP, documented in the Financial Times, illustrate this trend.36 Additionally, there has been pushback against investments in clean hydrogen projects in the U.S.,37 with similar examples of resistance emerging in other areas.
KEY OIL MARKET ISSUES IN WEO 2025
Electric Vehicles and Gasoline
Critique: Forecasts for electric vehicle (EV) adoption have long been overly optimistic, leading to overestimates of oil demand destruction for light-duty vehicles.
Assumptions about rapid adoption of EVs have been a central component of the IEA’s analysis of future oil demand. In the developed world, WEO 2025 assumes in the STEPS that the share of total EV sales will rise from 15% in 2025 to 55% by 2035; in the more conservative CPS, the share in 2035 will be as high as 45%. However, current travel trends make such goals unlikely to be met as the rate of uptake of EVs is slowing and the policies supporting EVs—such as mandates and subsidies—are being watered down or even eliminated.
Historically, forecasts of EV adoption have been far too optimistic. In August 2025, Bloomberg compiled a history of various EV adoption forecasts, excluding the IEA. As figure 8 shows, some of these forecasts were wildly inaccurate, with actual adoption rates falling far short of predictions.38
Figure 8. EV Adoption Forecasts
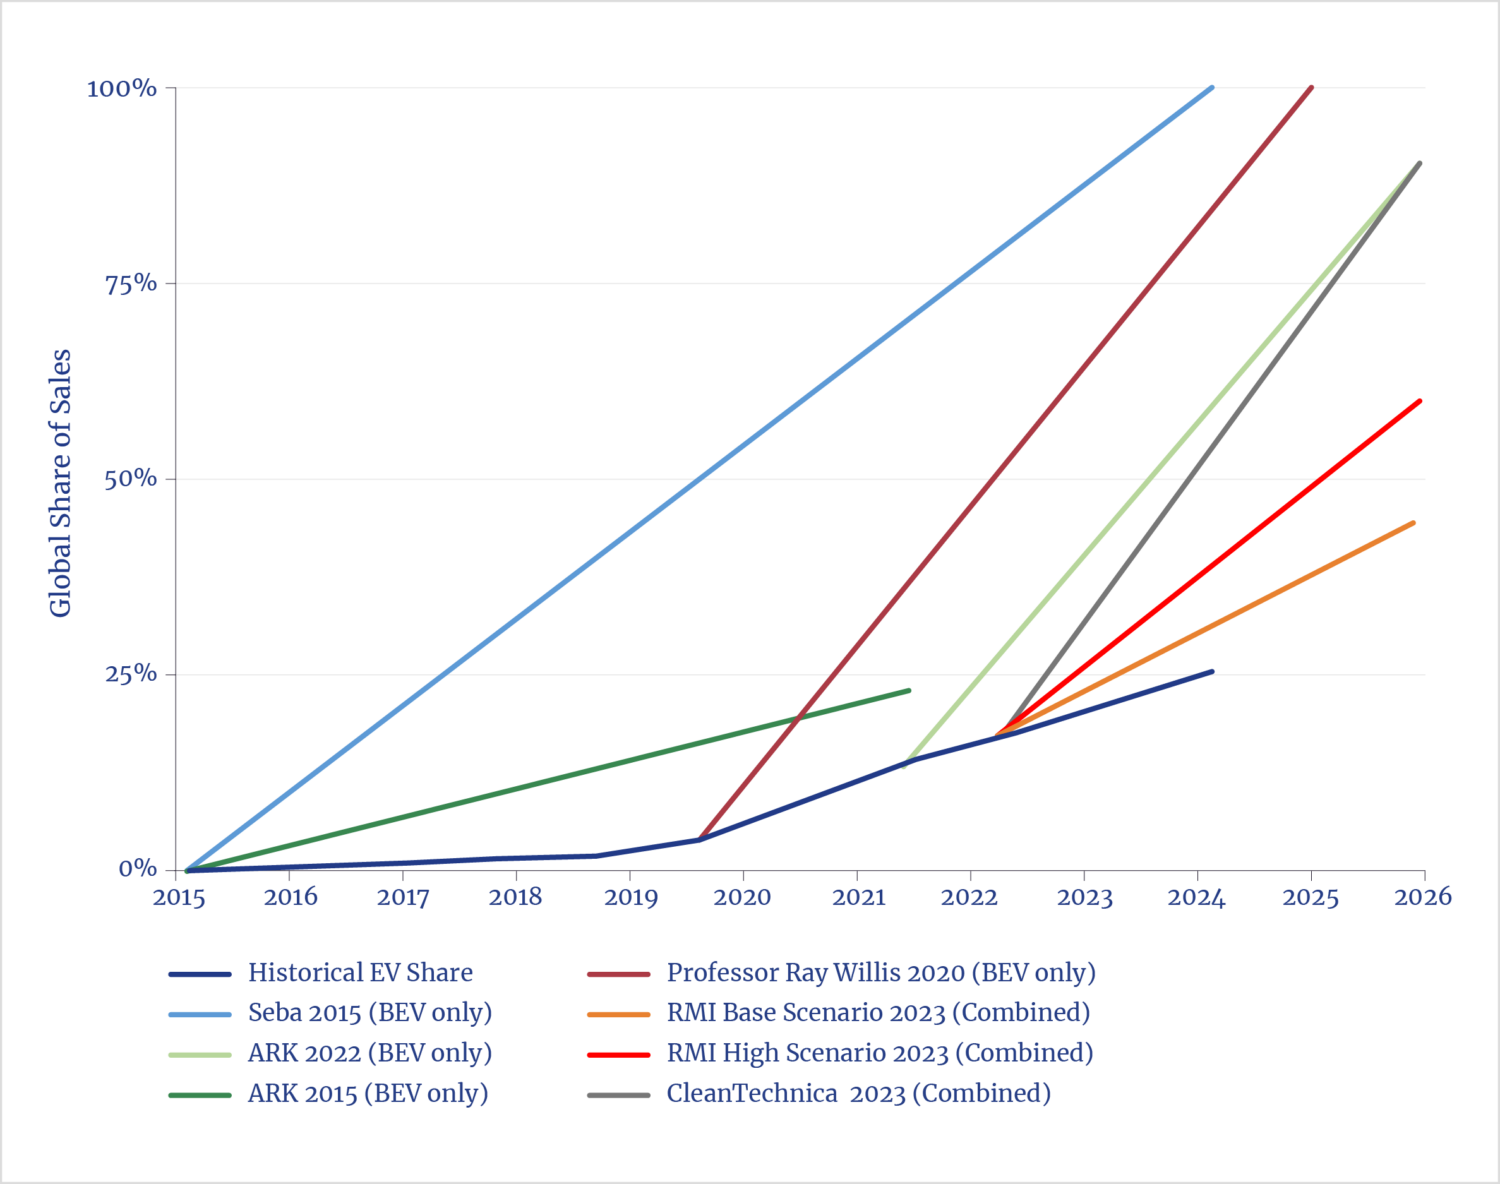
Source: Adapted from Colin McKerracher, “OPEC and Ark’s Electric Vehicle Sales Forecasts Were Way Off,” Hyperdrive (Bloomberg newsletter), August 6, 2025.
According to IEA data,39 the global share of EV sales—comprising both battery-electric and hybrid—was 22% in 2024; in the STEPS, the share is projected to be 42% in 2030. Notably, China’s share of total EV sales worldwide was a remarkable 65% in 2024, and it is forecast to remain as high as 53% in 2030. However, recent reports40 suggest that Chinese car sales data may be unreliable. Tough sales targets for dealerships may be inducing dealers to “register . . . them as ‘sold,’ even though no actual customer has bought them.”41
In broader terms, the Chinese government has spent $231 billion on various support measures between 2009 and 2023, according to an analysis by the Center for Strategic and International Studies.42 These measures include sales tax exemptions, infrastructure subsidies, support for research and development, and purchases by captive government entities. Arguably, much of the growth in China’s EV sales has been achieved primarily though these likely unsustainable subsidy policies.
In WEO 2025, the IEA itemizes the transport policies in many countries, including those that support EV sales.43 Given the widespread moderation in—and even pullback from—EV policies in recent years, the IEA scenarios are likely too optimistic about adoption, particularly in the near-term. The trend is clearly moving toward the relaxation of policies rather than their strengthening. Yet WEO 2025’s STEPS projects a reduction of over 6 mb/d in oil demand by 2050 due to EV adoption (see figure 9).
Figure 9. Fossil Fuel Demand in the STEPS and Additional Demand in the CPS, by Sector, 2010–50
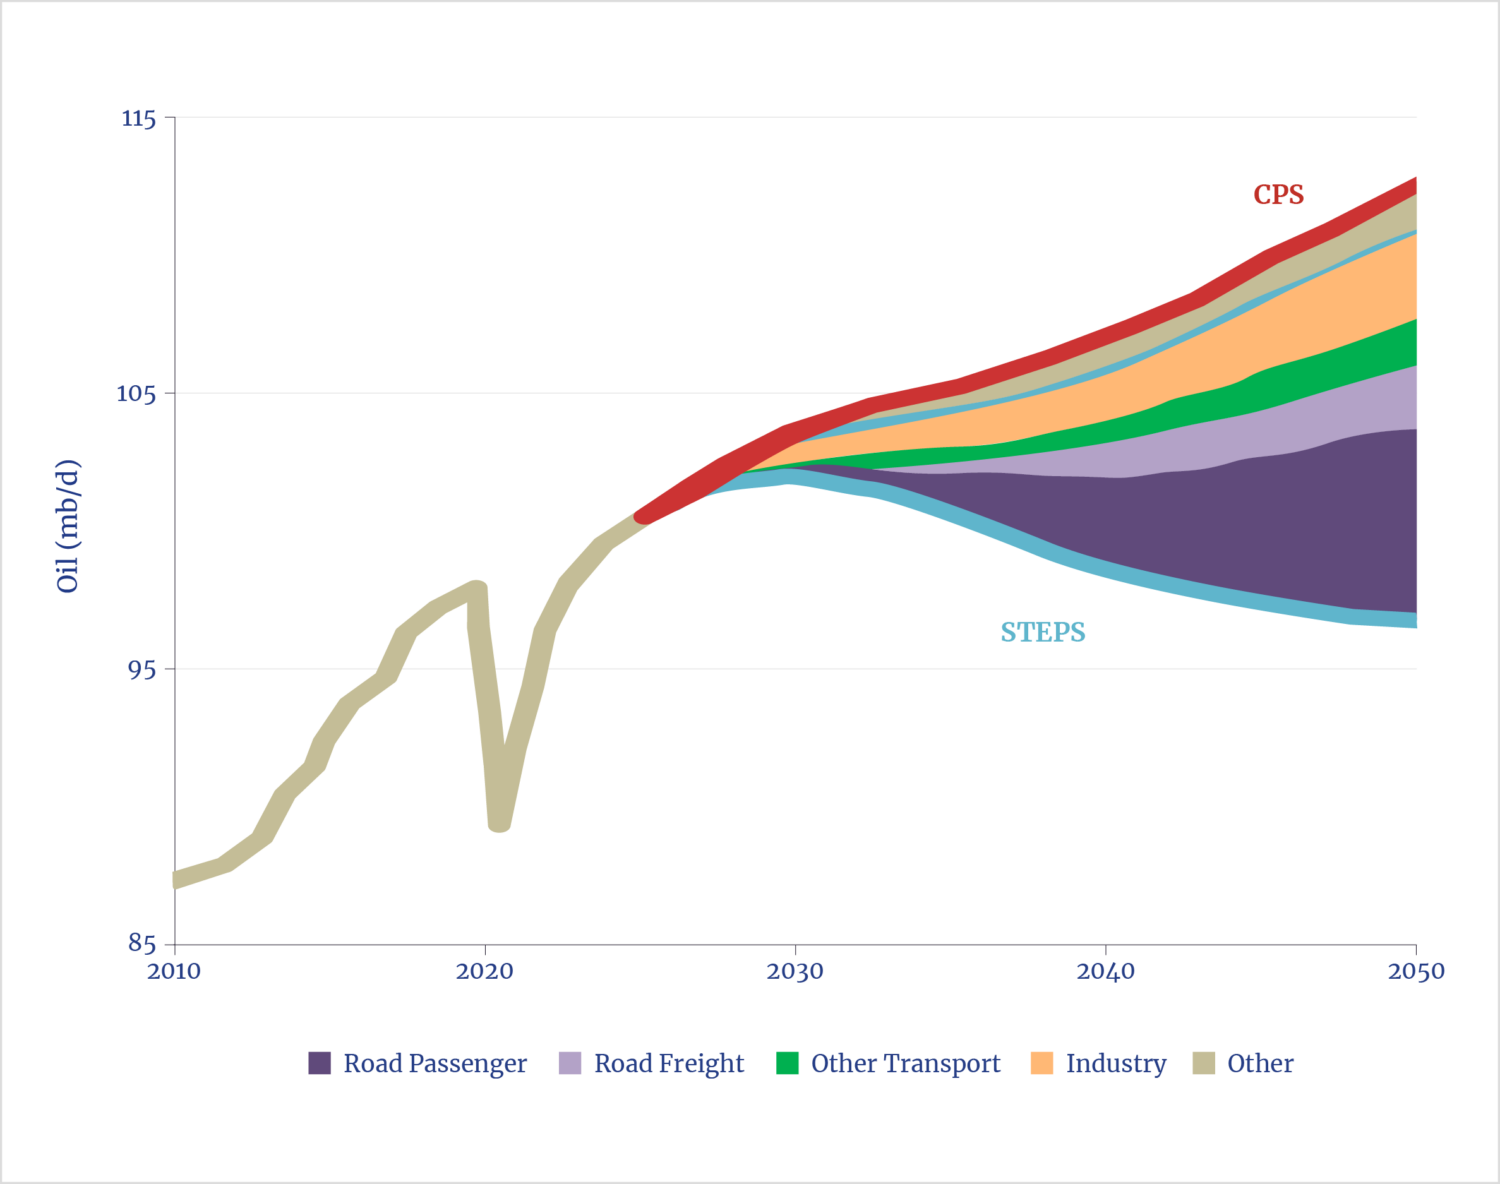
Given the widespread weakening of EV policy support, even the CPS—let alone the STEPS—may be overly aggressive in forecasting oil demand reduction. In the United States, the $7,500-per-vehicle EV subsidy, introduced in 2008 and extended in 2022, ended in October 2025. Following the short sales boost ahead of the subsidy’s end, the share of EVs in U.S. car sales is expected to fall to 5%44 from the 10% in 2024, as reported by the IEA.45 Yet the IEA’s July 31, 2025 update—its most recent—projects a U.S. EV share of 21% in 2030. Instead, it is more likely that EV adoptions will continue to fall short of the IEA’s projections, largely because of a badly targeted and inefficient subsidy. As noted in the NCEA analysis of WEO 2024,46 the National Bureau of Economic Research reports that 75% of EV subsidies in the U.S. have gone to wealthy consumers.
Reflecting market conditions, the Ford Motor Company announced in December 2025 the results of a major review of its EV business47 and thereby canceled a planned electric F-Series pickup truck, shifted production toward gas and hybrid vehicles, and repurposed an EV battery plant. F-150 Lightning—Ford’s signature electric pickup—will be converted into an extended-range hybrid vehicle. As a result of these announcements, Ford took a $19 billion write-down on its EV business.
In an additional sign of the times in the world’s second-largest vehicle market, the Trump administration has rolled back President Biden’s vehicle fuel economy targets, which had called for the U.S. to establish a fleet-wide average requirement for new vehicles of 50.4 miles per gallon by 2031. U.S. cars will now need to achieve only 34.5 miles per gallon.
In Europe, the EV ambitions of the European Commission (EC) are being eroded by national governments that are shifting their stances. In late November 2025,48 the German government challenged the EC’s existing policy that bans the sale of cars emitting carbon dioxide by 2035. The regulations, as currently framed, would include a ban on plug-in hybrid vehicles. Germany’s economically vital automotive industry is under pressure as it simultaneously tries to adapt to rules set by the EC, faces competition from low-cost Chinese EV imports, and copes with the loss of market share for conventional vehicles both in China and the United States.
In December 2025, the EC revised its proposals to ban sales of conventional vehicles by 2035, effectively softening the policy amid mounting pressure from European automakers, which argued that it was unrealistic and economically destructive.49 As a result, the level of EV expansion originally envisioned for 2035 in Europe will be dramatically slower. The EC has instead set a condition for carmakers to reduce carbon dioxide emissions by using either low-carbon or renewable fuels or locally produced green steel. Finding enough locally produced green steel will be a challenge, however, in view of high European electricity prices. This was evident in the case of one of Europe’s leading green steel manufacturers, the Swedish company Stegra, which is facing financial difficulties.50
On a smaller, local level that is perhaps indicative of broader trends, the Czech Republic’s October 2025 elections resulted in the Motorists Party winning nearly 7% of the vote51 and gaining seats in that parliament for the first time. Their main platform was a repudiation of national and EU-wide measures to restrict sales of internal combustion engine vehicles.
In another challenge for EV adoption, the U.K. government announced measures on November 26, 2025 to tax EVs, which in 2024 accounted for a 28% share of total car sales—the largest share among major European countries, though smaller markets such as Scandinavia saw higher shares. Currently, fuel taxes for conventional vehicles generate about 2% of U.K. government revenue,52 a source of revenue that EV sales will ultimately erode. The U.K. government is therefore considering a per-mile charge for EV drivers, given the need to maintain vehicle tax revenues for road improvements and maintenance. While this, too, will almost certainly hamper sales growth, the extent will depend on the final tax rate.
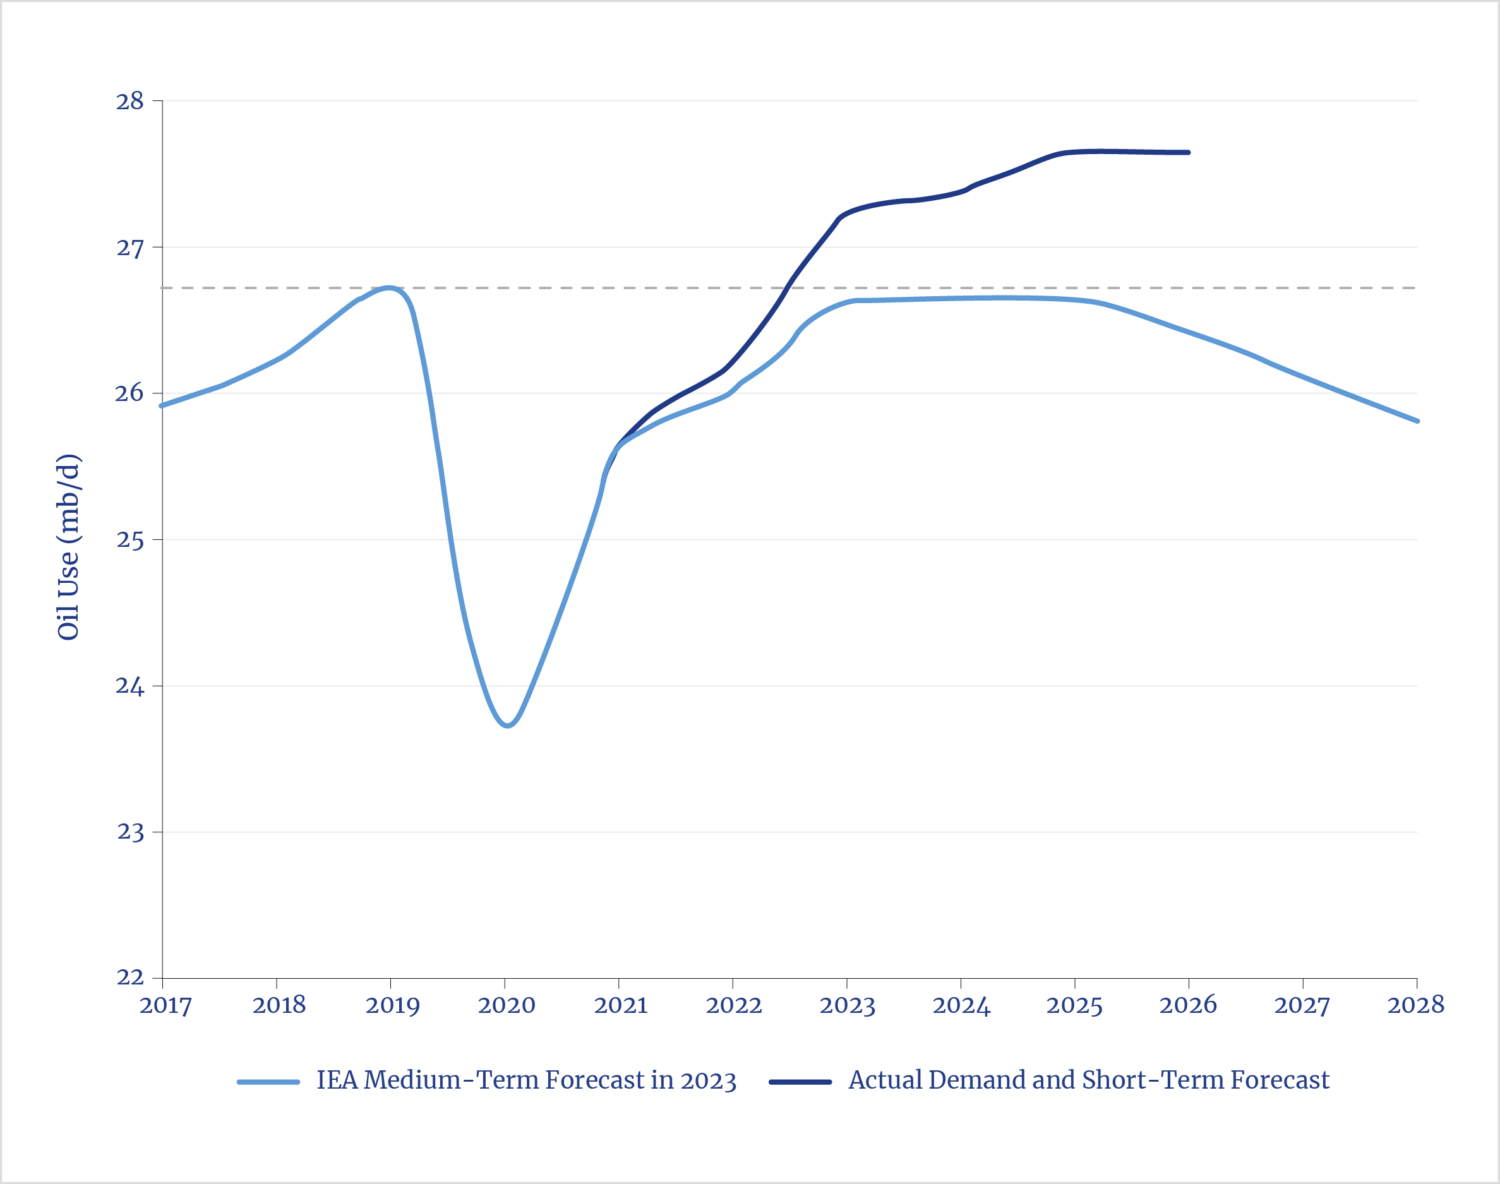
The reality of the changing policy climate for EVs means that forecasts for a near-term peak and decline are, at best, problematic (see figure 10). Far from peaking by 2023, as WEO had previously forecast,53 real-world gasoline demand has continued to grow. In 2026, demand could be 1.2 mb/d higher than the IEA forecast in 2023.54
Figure 10. The Death of Gasoline Was Greatly Exaggerated
Aviation
Critique: Forecasts for even small reductions in aviation oil use continue to be overly aggressive.
The aviation-sector use of jet fuel for passenger and freight air transport accounts for approximately 7%–8% of global oil consumption in recent estimates.55 As stated in NCEA’s WEO 2024 analysis,56 aviation is expected to expand significantly in the coming decades—especially in view of the well-publicized statistic that 80% of the global population has never flown,57 a reality that WEO 2025 acknowledges. In both the CPS and STEPS, WEO 2025 forecast major growth in aviation fuel consumption; the CPS projects a 36% increase by 2035 and a 79% rise—nearly doubling the amount—by 2050. Even assuming the more aggressive energy transition goals noted in the STEPS, the difficulties in substitution are evident, with the consumption share in 2035 remaining unchanged—matching that in the CPS—and only 4% lower by 2050. The penetration of sustainable aircraft fuel (SAF) will be limited.
Prior to the reintroduction of the CPS, the IEA had stated that “by 2035 sustainable fuels would cover 10% of all global road transport demand, 15% of aviation demand and 35% of shipping fuel demand.”58 This projection is dependent on relevant policies being fully implemented, a scenario that now seems inconceivable by 2035.
WEO 2025 outlines various policy targets in the transport sector, but the only direct reference to SAF is in the European Union, which estimates that SAF will constitute a 2% share of the aviation fuel mix in 2025 and rise to 70% by 2050.59 In view of the pushback against other energy transition policy initiatives, SAF mandates will likely follow a similar trajectory. Indeed, according to the International Air Transport Association, SAF contributed just 0.6% to global jet fuel use in 2025.60
The reality that SAF will not reach the levels anticipated by earlier policies was explained in more detail in a March 2025 study by Boston Consulting Group. The study concluded that new SAF production capacity has been experiencing a slowdown: “Project announcements for new SAF facilities declined 50% to 70% from 2022 to 2023, due primarily to economic uncertainty and higher energy and operating costs that squeezed company margins.”61 Additionally, recent U.S. legislation—the One Big Beautiful Bill—radically cut government support for SAF projects.62
Appropriately, WEO 2025 states:
The use of biofuels and other sustainable aviation fuels has expanded in recent years, supported by policies such as ReFuelEU in the European Union, but oil still accounted for more than 99% of total aviation fuel consumption in 2024. The CPS sees some limited further expansion of sustainable aviation fuels, just under 60% of the current pipeline of projects are developed, and the share [of] oil in the aviation fuel market stays above 95% to 2035.63
Shipping
Critique: WEO continues to present overly aggressive forecasts for any significant decline in the use of oil for global oceangoing shipping.
International shipping, which relies on marine bunker fuel for the international transport of goods and materials, accounted for approximately 3%–4% of total global oil demand in recent years.64 Shipping will remain overwhelmingly dependent on marine diesel and low-sulfur fuel oil (the latter in compliance with the International Maritime Organization [IMO] regulations)65 through 2050. In the STEPS, traditional fuels are expected to drop to an 80% share of the maritime fuels market by 2035, down from 93% in 2025, before further declining to 70% in the 2050 forecast. WEO assumes that this large reduction will come from far greater use of liquefied natural gas (LNG) and other alternative fuels—but this is a big assumption.
The IEA has not revised its STEPS estimates for overall marinefuel use in WEO 2025 from that stated in WEO 2024. However, with the reintroduction of the CPS, the STEPS estimate for total fuel use in 2050 is now projected to be reached by 2035. The 2050 CPS forecast anticipates that shipping will consume about 8 mb/d, about 21% higher than in the STEPS, which points to even greater challenges in finding practical replacements for oil in marine markets.
Following the publication of WEO 2025, there was a notable breakdown in IMO’s efforts to establish a global carbon price for shipping. In April 2025, IMO adopted a measure that envisaged a 65% reduction in shipping carbon intensity by 2040 through a higher uptake of non–fossil fuels or low-carbon marine fossil fuels. But senior Trump administration officials issued a statement in August 2025 that explicitly rejected IMO’s net-zero framework and opposed measures viewed as imposing unfair costs on U.S. industry and consumers. A fractious meeting was held in London in mid-October, during which IMO member countries agreed to postpone the implementation of the global carbon price by one year.66 Given the current U.S. administration’s stance, as well as opposition from other countries (notably, Saudi Arabia), the passage of such a measure seems unlikely.
The bottom line is that fossil fuels will likely maintain their current dominant position in the marine sector for longer than the IEA’s STEPS suggests. Although ongoing improvements in fuel efficiency—due to new vessel designs and materials, changes to shipping routes, enforced slow steaming, and other reforms—are expected, such measures will not come close to achieving the levels of oil-use reductions imagined in the STEPS.67
According to the IEA website, the most recent comprehensive report on shipping fuel use was published in September 2023,68 although an October 2025 report that evaluated sustainable fuels69 also considered potential applications for shipping. Another example of unrealism in the WEO 2025 NZE by 2050 Scenario is the IEA’s forecast that 65 methanol-fueled ships will by then ply global waters, with another 300 ships on order.70 The report provided neither details on the size of these ships nor on the share of fleet categories they would represent. Even under this unrealistic forecast, these ships would constitute only a tiny fraction of the global fleet. A new, comprehensive report on this sector is overdue.
Conclusion
The substance and messaging in WEO 2025 are significantly different from that of recent years, reflecting an important return to more realistic assumptions in the difficult task of energy forecasting. However, too much emphasis remains on uncertain and unrealistic assumptions in many scenarios that, if followed through in policies or investments, could leave global markets undersupplied with oil. Recent developments indicate that energy transition policies are losing strength due to market realities and political pressures. Fossil fuels continue to dominate the energy mix, despite significant investments in alternative energy sources. The IEA’s reintroduction of the Current Policies Scenario offers a more realistic view of a possible future, one in which continued expansion in fossil fuel production will be necessary to avoid supply pressures and price increases.
NCEA is one among many organizations and analysts that have urged the IEA to restore realism in its forecasting models. WEO 2025 shows the IEA’s responsiveness to these critiques. A further evolution of WEO is anticipated as the IEA continues its important work in evaluating the state and future of global energy issues.
Appendix
NCEA’s analysis critically evaluates four of the 10 questions presented in the IEA’s World Energy Outlook 2025 (WEO 2025). For clarity and reference, the full set of questions is included to offer readers a broader perspective on the issues addressed in WEO 2025.71
1. The CPS and STEPS are exploratory in that they work forward from slightly different starting assumptions. What do these scenarios tell us about the direction in which the energy world is heading?
2. What are the implications of all the IEA scenarios for energy-related emissions and the rise in global average temperatures, and what does this imply for the discussions at COP 30 in Belém, Brazil?
3. Examining recent energy history can help to understand some distinctive aspects of the future. How are the drivers of global energy demand in the coming decades different from those in the past?
4. Electricity prices are a sensitive topic for consumers and policymakers alike. What does the prospective Age of Electricity mean for energy affordability?
5. Artificial intelligence will have implications for all parts of our economies and societies. How much difference will AI and our thirst for data make to the future of energy?
6. After some difficult years during the pandemic and the global energy crisis, there is a growing effort to regain momentum on energy access. What more needs to be done to provide universal, affordable access to electricity and clean cooking?
7. Export controls on rare earth elements in 2025 have highlighted the importance of these new dimensions to energy security. How are critical minerals and other emerging issues changing the energy security landscape?
8. Investors and project developers, led by the United States, have continued to approve multiple new export projects for liquefied natural gas (LNG) in 2025. Where will all this LNG go?
9. Currently, there is ample underutilized manufacturing capacity for many clean energy technologies, especially solar photovoltaic and batteries, and much of this is in China. Will the global market capitalize on it?
10. Answers to many of the biggest questions about the future will depend on investment. What do energy investment projections tell us about potential gaps and risks?
Notes
- Mark P. Mills and Neil Atkinson, Energy Delusions: Peak Oil Forecasts: A Critique of Oil “Scenarios” in the IEA World Energy Outlook 2024 (National Center for Energy Analytics, 2025), 2.
- Energy Institute, 2025 Statistical Review of World Energy, 74th ed. (Energy Institute, 2025).
- Ari Natter, “U.S. Threatens to Abandon IEA Over Green-Leaning Energy Forecasts,” Bloomberg, July 15, 2025.
- Grant Smith, “IEA Reinstates Bullish Oil Demand Growth Scenario in Key Report,” Bloomberg, November 12, 2025.
- U.S. Energy Information Administration, International Energy Outlook 2023, dataset, released October 11, 2023.
- Darren Woods, “Preliminary Prepared Remarks,” ExxonMobil: In a League of Our Own—Corporate Plan Update, December 9, 2025.
- Laura Cozzi and Tim Gould, “Scenarios in the World Energy Outlook 2025,” International Energy Agency, November 5, 2025.
- IEA (International Energy Agency), World Energy Outlook 2024 (IEA, 2024), 17.
- Energy Institute, 2025 Statistical Review.
- IEA, World Energy Outlook 2025 (IEA, 2025), 38.
- IEA, World Energy Outlook 2025, 23.
- IEA, “Kenya, Norway, U.S. and IEA to Hold 2nd Major Summit on Clean Cooking in Africa,” IEA News, December 11, 2025.
- U.S. Department of State, “Digital Press Briefing: U.S. Secretary of Energy Chris Wright,” The Brussels Hub, September 11, 2025.
- IEA, World Energy Outlook 2025, 29.
- IEA, World Energy Outlook 2025, 436, table A.15.
- IEA, “Global Coal Demand Has Reached a Plateau and May Well Decline Slightly by 2030,” IEA News, December 17, 2025.
- IEA, World Energy Outlook 2025, 37–38.
- Specifically, the European Union, the U.K., China, India, the U.S., and Japan.
- See, for example, Bill Gates, “Three Tough Truths About Climate,” Gates Notes, October 28, 2025.
- IEA, Global Critical Minerals Outlook 2025 (IEA, 2025).
- IEA, World Energy Outlook 2025, 207.
- Peter Bryant and Satish Rao, Energy Delusions: Critical Minerals Forecasts: A Critique and Commentary of the IEA Global Critical Minerals Outlook 2025 (National Center for Energy Analytics, 2025).
- IEA, World Energy Outlook 2025, 18.
- G. Allen Brooks, The Energy Transition’s Global Shipping Challenge (National Center for Energy Analytics, 2025).
- IEA, The Implications of Oil and Gas Field Decline Rates (IEA, 2025).
- IEA, Medium-Term Oil and Gas Markets 2010 (IEA, 2010).
- Neil Atkinson, The International Energy Agency Acknowledges the Need for More Oil and Gas Investment (National Center for Energy Analytics, 2025).
- IEA, Net Zero by 2050: A Roadmap for the Global Energy Sector (IEA, 2021).
- IEA, Net Zero Roadmap: A Global Pathway to Keep the 1.5°C Goal in Reach, 2023 Update (IEA, 2023).
- “Crude Reserves and Production,” Petroleum & Other Liquids: Data, U.S. Energy Information Administration, accessed January 17, 2026.
- IEA, Implications of Oil and Gas, 46.
- IEA, World Energy Outlook 2025, 119.
- IEA, Implications of Oil and Gas, 21, figure 16.
- The OPEC+ alliance comprises OPEC (Organization of the Petroleum Exporting Countries) members along with other significant oil producers outside OPEC.
- IEA, World Energy Outlook 2025, 433, table A.8.
- Malcolm Moore and Tom Wilson, “Inside the Failed Green Revolutions at BP and Shell,” Financial Times, December 11, 2025.
- Rebecca F. Elliott, “America’s Clean Hydrogen Dreams Are Fading Again,” New York Times, August 11, 2025.
- Colin McKerracher, “OPEC and Ark’s Electric Vehicle Sales Forecasts Were Way Off,” Hyperdrive (Bloomberg newsletter), August 6, 2025.
- “Global EV Data Explorer,” data tool, IEA, last updated July 31, 2025.
- A search within The Atlantic, for example, yields numerous articles on this topic.
- Michael Schuman, “China’s EV Market Is Imploding,” The Atlantic, November 11, 2025.
- Scott Kennedy, “The Chinese EV Dilemma: Subsidized Yet Striking,” Center for Strategic and International Studies blog, June 20, 2024, revised June 28, 2024.
- IEA, World Energy Outlook 2025, 471–73.
- Nora Eckert, “End of EV Tax Subsidy Sparks Worries of Collapse in U.S. Electric Car Sales,” Reuters, October 1, 2025.
- “Global EV Data Explorer.”
- Mills and Atkinson, Energy Delusions: Peak Oil Forecasts, 18.
- Keith Naughton and Gabrielle Coppola, “Ford to Repurpose EV Battery Plant for Energy Storage Batteries,” Bloomberg, December 15, 2025.
- Anne-Sylvaine Chassany et al., “Germany’s Merz to Demand EU Relax Petrol Engine Ban,” Financial Times, November 20, 2025.
- Ewa Krukowska and John Ainger, “Europe Saves Combustion Engine in Reversal of Controversial Ban,” Bloomberg, December 16, 2025.
- Richard Milne, “Swedish Start-Up Races to Avoid Northvolt-Style Collapse,” Financial Times, October 31, 2025.
- Associated Press, “Populist Billionaire Andrej Babiš Wins Czech Parliamentary Election,” NPR News, updated October 4, 2025.
- Editorial Board, “Britain’s Big Experiment with Taxing EVs,” Financial Times, December 3, 2025.
- IEA, Oil 2023: Analysis and Forecast to 2028 (IEA, 2023).
- Javier Blas, “The Death of Gasoline Has Been Greatly Exaggerated,” Bloomberg, December 17, 2025.
- “Facts & Figures,” Air Transport Action Group, accessed January 17, 2025.
- Mills and Atkinson, Energy Delusions: Peak Oil Forecasts, 20.
- “Aviation’s Climate Impact—Why Reducing Emissions Matters,” Knowledge Hub, GoClimate, updated October 22, 2025.
- IEA, Delivering Sustainable Fuels: Pathways to 2035 (IEA, 2025), 9.
- IEA, World Energy Outlook 2025, 472, table B.11.
- International Air Transport Association, “Net Zero 2050: Sustainable Aviation Fuels (SAF),” fact sheet, December 2025.
- Diana Dimitrova et al., “Sustainable Aviation Fuels Need a Faster Takeoff,” Boston Consulting Group, March 27, 2025.
- Jamie Watts, “Sustainable Aviation Fuel Loses All Momentum with Trump’s Cuts,” Thred, August 13, 2025.
- IEA, World Energy Outlook 2025, 130.
- International Maritime Organization, Fourth Greenhouse Gas Study 2020 (International Maritime Organization, 2020).
- International Maritime Organization, “Global Limit on Sulphur in Ships’ Fuel Oil Reduced from 01 January 2020,” Media Centre, December 20, 2019.
- Akshat Rathi and Danielle Bochove, “U.S. Opposition Freezes Global Carbon Levy on Ships,” Bloomberg Green (Bloomberg newsletter), October 17, 2025.
- “Energy Efficiency in Shipping,” Energy Sustainability Directory, last revised March 12, 2025.
- IEA, Aviation and Shipping (IEA, 2023).
- IEA, Delivering Sustainable Fuels.
- IEA, World Energy Outlook 2025, 342.
- IEA, World Energy Outlook 2025, 29.