A Cost-Benefit Analysis of Using Direct Air Capture to Remove Atmospheric Carbon
Listen to the Report
Executive Summary
This paper assesses whether direct air capture (DAC) can effectively remove carbon from the atmosphere in a physically, economically, and environmentally viable way and concludes that it cannot. DAC is inherently energy-intensive due to the laws of thermodynamics. Because using fossil fuels to power DAC facilities would reduce or even eliminate the resulting CO2 emissions, such power would require substantial quantities of emissions-free electricity—either from nuclear plants or from wind and solar generation. The amount of new generating capacity required would be prohibitively expensive, costing trillions of dollars. The DAC facilities themselves would cost hundreds of billions of dollars. The resulting costs per tonne of CO2 reduced by DAC far exceed even the most recent estimates of the social cost of carbon. In fact, current federal subsidies, along with the additional costs of financing them, would considerably exceed these estimates of the social cost of carbon. Finally, even if these physical and economic issues could be overcome, the resulting impact on global CO2 concentrations would be negligible, and the effect on temperature would be too small to measure.
By way of example, reliance on DAC to capture 1 billion tonnes (1 gigatonne [Gt]) of CO2 per year, which is in line with goals cited by the U.S. Department of Energy, yields the following results:
- The theoretical minimums of energy necessary to power DAC to meet the 1 Gt goal would require almost 10% of total U.S. electricity generation.
- When the real-world energy consumption for large-scale DAC implementation is considered, meeting the goal would require roughly 30% of total U.S. electricity generation.
- The reduction in atmospheric CO2 concentration would be just over 1/10 parts per million (ppm), or about 0.03% of the current atmospheric concentration of 425 ppm.
- The impact on world temperature would be 0.003⁰C. The margin of error in estimating global temperature is approximately 0.13 °C, more than 40 times larger.
Relying on renewable energy sources—primarily wind and solar power—for DAC would be problematic because these resources are inherently intermittent. Hence, they would require huge quantities of battery storage and would have to be overbuilt to ensure that, when wind and solar facilities generate electricity, enough energy is available to charge the batteries. The estimated cost for the combined wind, solar, or battery facilities needed to remove 1 Gt annually would be about $4 trillion, exclusive of the billions of dollars for new high-voltage transmission lines to deliver the electricity to DAC facilities. The area required for the necessary wind and solar facilities would be larger than the state of Florida.
Using nuclear energy alone to power DAC, while more reliable than wind and solar energy, would require the construction of 180 new nuclear plants. The most recently completed nuclear plant was Georgia Power’s Plant Vogtle, which consisted of two 1,000 MW reactors. Construction took more than a decade and cost $33 billion—almost three times the original estimate. The estimated total cost of nuclear energy for powering DAC facilities to remove 1 Gt of CO2 annually is $3.7 trillion.
To address climate change, CO2 captured using DAC facilities would need to be permanently sequestered underground. However, doing so creates environmental and health risks because the CO2 could escape. Such events took place several times in Cameroon and resulted in the deaths of 1,700 people. There is no basis for believing that sequestering billions of tonnes of CO2 underground could not result in similar releases of CO2.
Taken together, these physical, economic, and environmental realities indicate that removing CO2 from the atmosphere via DAC should not be pursued.
Introduction
There are numerous federal and state subsidies to reduce CO2 emissions and atmospheric concentrations. Currently, the largest federal subsidy—$180 per metric ton (tonne)1—is for direct air capture (DAC) of CO2. Although several dozen DAC systems are operating today, primarily in Europe, most are small demonstration projects. The Stratos Plant, located in the Permian Basin of Texas and owned by Occidental Petroleum, will be capable of extracting 500,000 tonnes of CO2 and will be the largest DAC plant in the world once it begins operations, which are now scheduled for this year.
DAC plants function like giant vacuum cleaners, extracting atmospheric CO2 and capturing it for use elsewhere, such as for enhanced oil recovery or for permanent underground storage. Proponents of DAC argue that billions of tonnes of CO2 must be actively removed from the atmosphere, in addition to implementing net-zero policies to reduce greenhouse gas emissions, to limit global temperature increases.
The Inflation Reduction Act (IRA) of 2022 increased the federal subsidy for DAC from $50/tonne to a maximum of $180/tonne, as set forth in Section 45Q of the U.S. Tax Code.2 Given claims that the U.S. must remove between 100 million tonnes and 2 billion tonnes of CO2 annually, the subsidy payments could easily total billions of dollars annually. Moreover, the maximum subsidy value is far higher than CO2 market prices, such as the auctions for states that participate in the Regional Greenhouse Gas Initiative (RGGI). For example, the most recent RGGI auction, which was held in December 2025, resulted in a market-clearing price of $26.73/tonne.3 Although the One Big Beautiful Bill Act of 20254 limited certain green energy subsidies that had been expanded under the IRA, it did not alter the enhanced subsidies for DAC. Once approved, DAC projects are eligible to receive subsidy payments for 12 years, as long as they continue to remove at least 1,000 tonnes/year. After 2026, the current subsidies will be adjusted for inflation. To be eligible, a DAC project must begin construction before January 1, 2033 and capture at least 1,000 tonnes of CO2 per year.
Numerous questions remain to be answered about the fundamental viability of DAC, with or without subsidies: What are the energy requirements for DAC? Is large-scale DAC physically feasible? What would be the impact of large-scale DAC on climate? What are the economics of DAC? What does it cost, and how does that cost compare with measures of the benefits of CO2 reductions, such as the social cost of carbon? What will DAC subsidies cost U.S. taxpayers, including the costs of additional debt financing? Who will pay for DAC installations, and what will be the impacts of DAC’s costs on U.S. businesses and consumers?
There are also unanswered technical questions. For example, if captured carbon is to be stored underground, are there truly leakproof formations that would prevent carbon from escaping and potentially causing injury and death, as in the incident that took place at Lake Nyos, Cameroon, where a CO2 leak four decades ago killed over 1,700 people?
Ultimately, if large-scale implementation of DAC in the U.S. is infeasible due to its energy requirements and costs, or if it will have no measurable impact on atmospheric CO2 concentrations, then there is no economic or scientific basis for pursuing DAC.5
A Primer on How DAC Works6
Initially, carbon capture and storage (CCS) was attempted to remove (scrub) CO2 from flue gas emissions of industrial facilities and fossil-fuel power plants.7 In the U.S., the most well-known such effort was Southern Company’s Plant Ratcliffe, a coal-fired power plant located in Kemper County, Mississippi. Southern Company spent billions of dollars to construct the plant and install a system called coal gasification that first converted coal into natural gas, which was then burned to generate electricity.8 The resulting emissions from burning natural gas would contain around 4% CO2.9 The company claimed that the retrofit would capture 65% of the emitted CO2.10 The technology never worked, and in October 2021, much of the plant was demolished.11 Although there are about a dozen CCS facilities worldwide, most of them involve separating CO2 from natural gas fields instead of separating it from electric generating plants.12
Rather than capturing CO2 from relatively concentrated flue gases, as its name implies, DAC is designed to capture CO2 directly from ambient air. Doing so is more technologically challenging because the atmospheric concentration of CO2—425 parts per million (ppm) or just over 0.04% of the atmosphere—is around 100 times lower than in flue gases.13 Nevertheless, that low concentration translates to approximately 3.1 trillion tonnes of atmospheric CO2.14 Currently, there are two recognized commercial approaches to DAC.15 The first uses a liquid solvent, called the contactor, to absorb CO2. The absorbed CO2 is then concentrated using a chemical process called calcination. The second uses solid filters, which are then heated to release the captured CO2. For both technologies, the resulting CO2 is then compressed for transport and reuse, such as for enhanced oil recovery, or stored permanently underground. As discussed further on, such permanent storage is problematic and dangerous if the CO2 were to escape.
Two companies, both founded in 2009, have developed DAC technologies. Carbon Engineering has developed a liquid solvent approach to DAC,16 while Climeworks has developed a method using solid filters instead of liquid solvents.17
Liquid DAC Process18
The liquid DAC approach uses a hydroxide, such as potassium hydroxide, as an absorbent (see figure 1). Fans push air through the hydroxide solution, where it reacts with CO2 in the air to create a liquid solution of potassium carbonate and water.19
Figure 1: Schematic for Liquid Solvent Process DAC
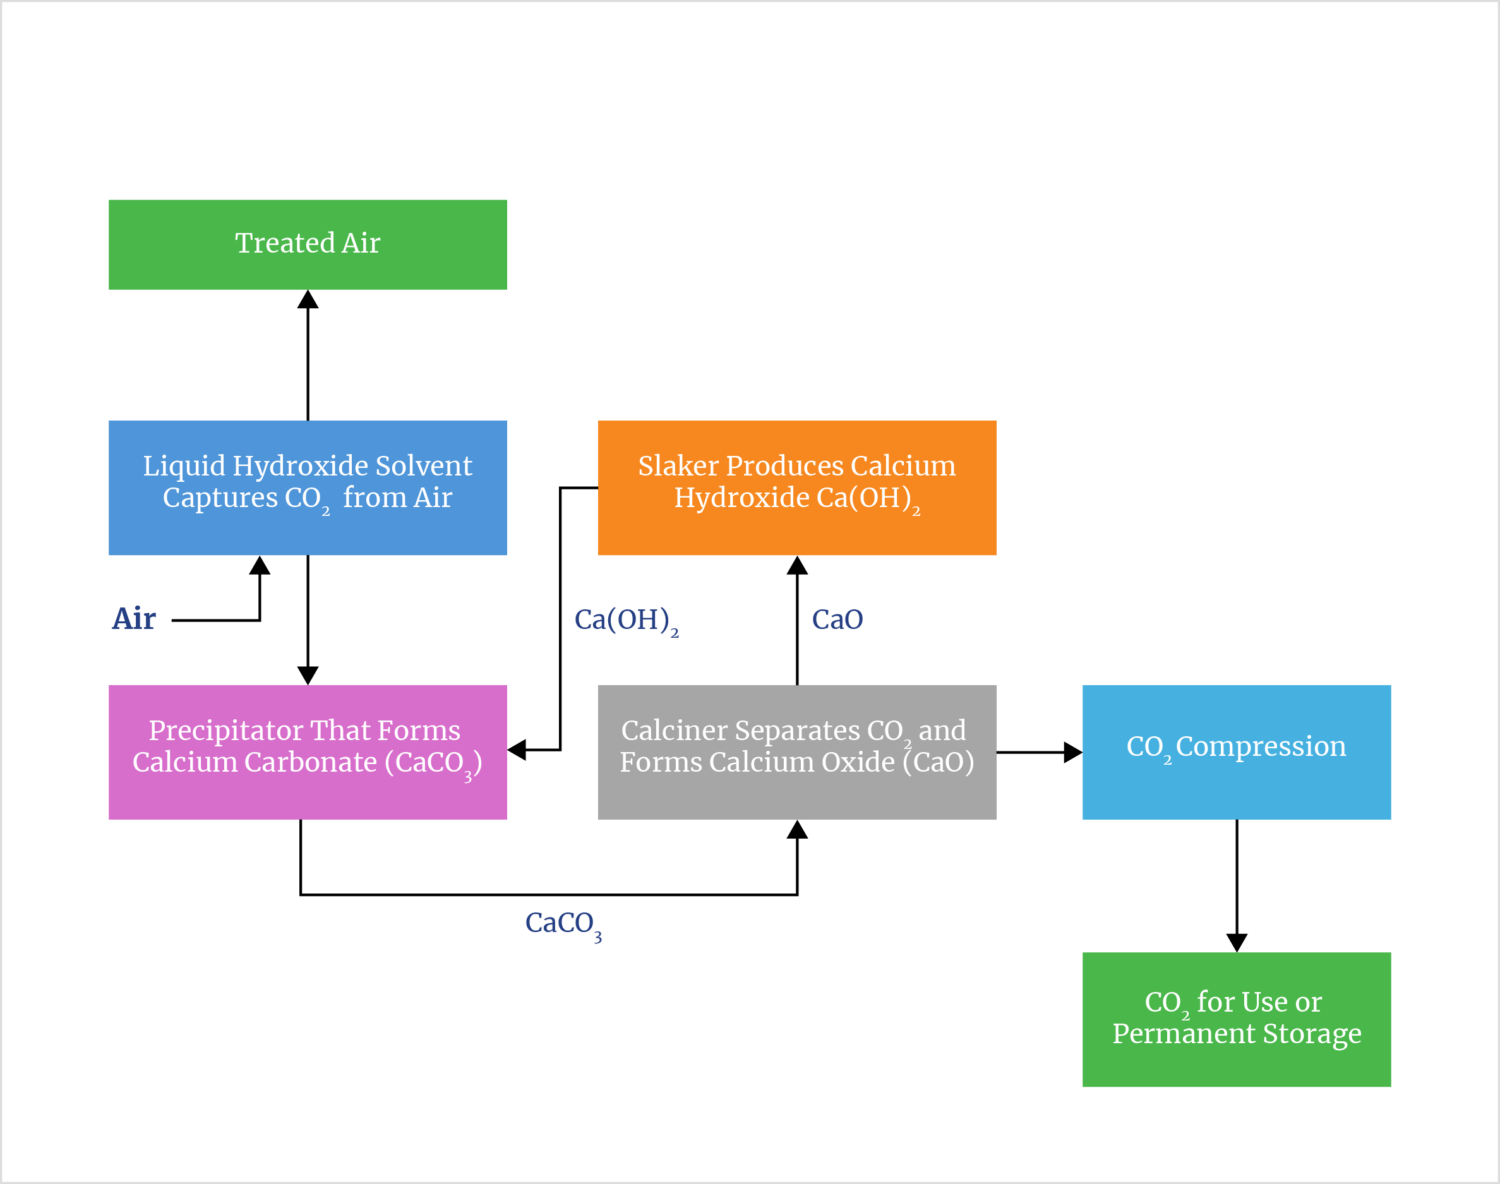
The next step is to remove CO2 from the carbonate solution and recapture the hydroxide originally used. To do that, the solution is mixed with calcium hydroxide—better known as slaked lime—to form calcium carbonate (CaCO3), which is a solid.
Next, the calcium carbonate is heated in a calciner to release CO2 and form calcium oxide, better known as quicklime. This is by far the most energy-intensive step in the entire process. The calcium oxide produced is then fed to a slaker, which regenerates the calcium hydroxide used in the precipitator.20 Lastly, the concentrated CO2 is compressed for transport.
Solid DAC Process
The solid absorbent approach uses a series of solid filters, called a sorbent, to capture CO2 (see figure 2). The filters contain amines, which are compounds formed from ammonia. These react with CO2 as large fans flow outside air through the filters.21 Once the filters become saturated, they are then heated directly to release a concentrated stream of CO2. Solid absorbents typically work at lower temperatures and pressures than the liquid solvent process.22
Figure 2: Schematic for Solid Absorbent Process DAC
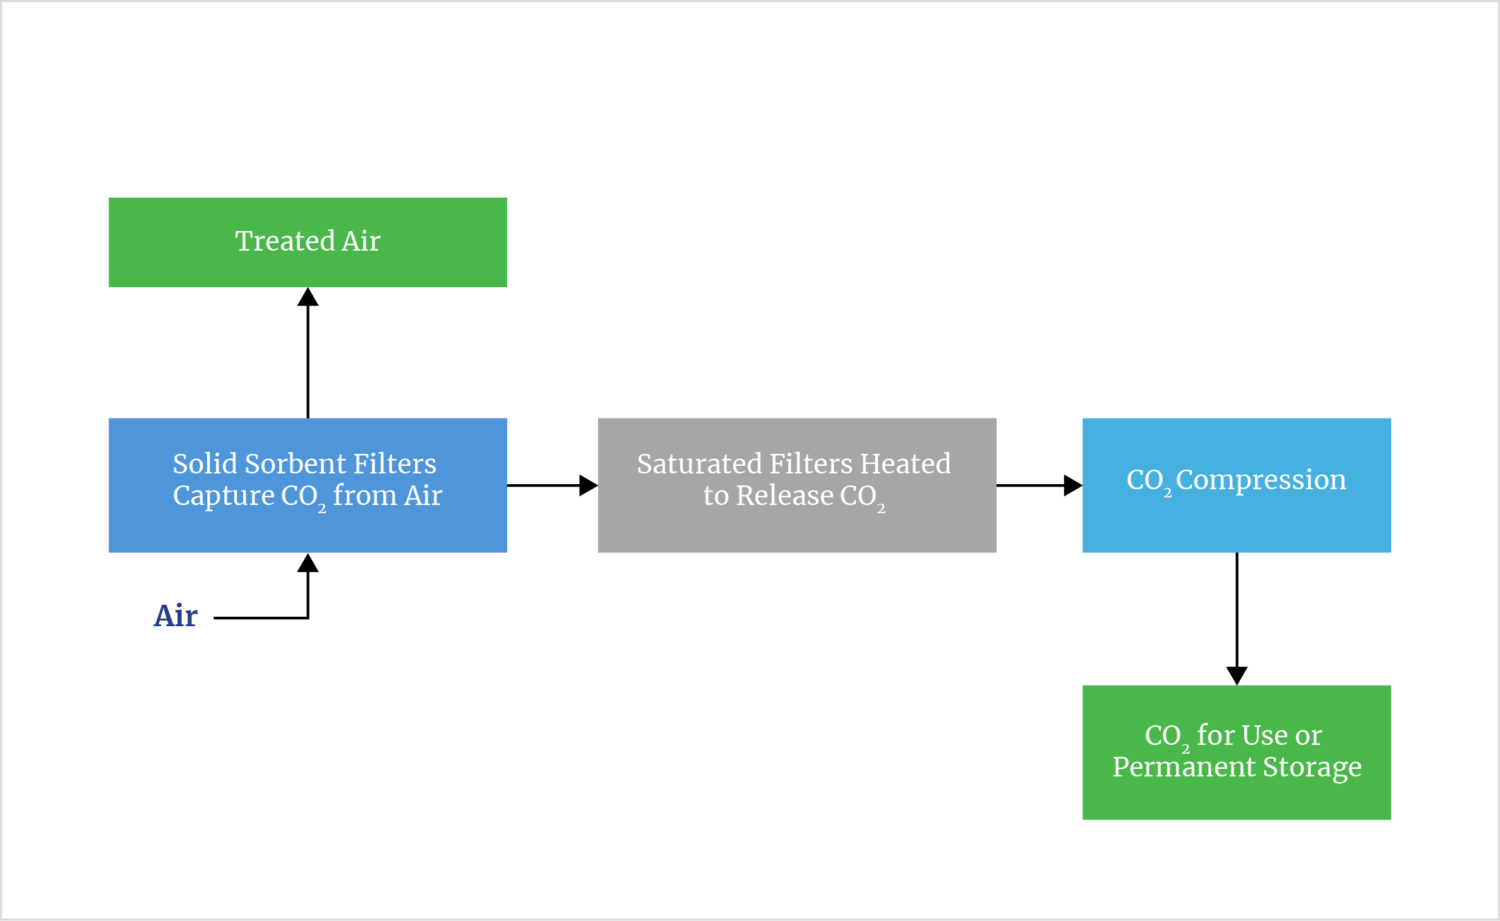
Although the solid absorbent process is simpler in principle than the liquid solvent approach, solid DAC technology can require more energy.23 The solid filters degrade over time,24 which raises overall costs. Finally, the need for numerous small units in the solid DAC process tends to increase capital and operating costs due to a lack of scale economies.25
Energy Requirements for DAC
A key component in evaluating the cost-effectiveness and practicality of adopting DAC on a large scale is the energy required to do so. Regardless of the technology used, the energy requirements are governed by the thermodynamics of the electrochemical processes that are required to draw in air through filters, separate out the CO2, and compress it for use or storage. Hence, no matter how efficient the industrial processes used to remove CO2 become, there is an absolute minimum energy required to remove CO2 directly from the air. That minimum value also depends on the percentage of CO2 removed—the greater the percentage removed, the greater the minimum energy requirement—as well as air temperature and air pressure. There is less CO2 in a given volume of air at higher temperatures and higher altitudes, and so the minimum energy requirement to capture the same quantity of CO2 increases.26 Thus, the location of DAC facilities is another important consideration.
The total energy required for both DAC processes includes the electricity to run the fans that bring in outside air and push it through the sorbent; the energy required to release the CO2 captured (either through calcination or regeneration of the solid sorbent); and the energy to compress the captured CO2 so it can be transported for use in enhanced oil recovery or for permanent underground storage. As will be discussed, DAC requires far too much energy to be viable on a large scale—regardless of the technology used.
Theoretical Minimum Energy Requirements for DAC
The theoretical minimum energy requirement to remove 100% of CO2 from a volume of air depends on how much CO2 the air contains. As discussed previously, the current average atmospheric concentration of CO2 is around 425 ppm; based on this concentration, it turns out that at sea level and a temperature of 25⁰C, the minimum energy needed is about 137 kWh/tonne.27
As atmospheric CO2 concentrations increase, this minimum value decreases. This makes intuitive sense because there is more CO2 available to be extracted, which is why carbon capture from flue gas streams requires less energy. For example, at a concentration of 500 ppm, the minimum energy requirement decreases slightly to 134.3 kWh.
The minimum values are based on thermodynamic principles and do not account for the energy required for fans to move outside air through the liquid- or solid-contactors, a process that enables removal. The energy required to move the air through the contactors depends on the depth of the contactors (similar to the length of a pipe) and their resistance to airflow, both of which cause a pressure drop. This is similar in principle to water flowing through a garden hose: The longer the hose, the greater the friction, and the less water will flow out the end. Friction in the hose causes a pressure drop.
As with a garden hose, the greater the pressure drop, the more energy is required to move a given volume of air through the contactors. The energy required also depends on how fast the air is moved through them, which determines how much CO2 is captured over time. Slower airflow uses less energy but obviously results in less CO2 capture over time. Moreover, there is a tradeoff between the airflows, the required size of the contactors, and the capital and operating costs of both the fans and the contactors.28 Using the formula developed by Geoffrey Holmes and David W. Keith, a low estimate of the energy required to move air through the contactors is around 100 kWh/tonne.29 Thus, adding the 100 kWh/tonne energy required to move air over the contactors to the 137 kWh/tonne theoretical minimum energy needed to extract the CO2 from air yields a minimum energy requirement of around 240 kWh/tonne.
Once CO2 is captured, it must be compressed for transport, either for use elsewhere or for storage underground. The minimum energy to accomplish this can also be calculated and is also based on thermodynamics, as discussed in appendix 1. It turns out that compressing CO2 to 100 atmospheres of pressure, a typical pressurization used for transporting CO2 in pipelines,30 requires a theoretical minimum energy of about 72 kWh/tonne.31
Based on these theoretical minimum values, which total over 300 kWh/tonne of CO2, the theoretical minimum amount of energy required to remove 1 million tonnes of atmospheric CO2 per year (a typical size envisioned for individual DAC facilities)32 and compress it for transportation and storage, would exceed 300 million kWh, or 300 gigawatt-hours (GWh).
A recent report by the U.S. Department of Energy (DOE) cites a study that claims the U.S. must remove between 100 million tonnes and 2 billion tonnes of CO2 each year by 2050.33 Hence, the theoretical minimum energy requirement for using DAC to remove 2 billion tonnes of CO2 emissions annually—about 45% of total U.S energy-related CO2 emissions in 2024—would be 600 terawatt-hours (TWh). This is equivalent to about 15% of total U.S. electricity consumption in 2024, which was just under 4,000 TWh.34Thus, the theoretical minimum energy needed for DAC on a scale envisioned by the DOE would be huge. But as discussed in the next section, the energy needed in practice would be far greater and far more costly.
Energy Requirements for DAC in Practice
Not surprisingly, the energy requirements for existing DAC facilities are far greater than the theoretical minimums just discussed, since no energy or mechanical system is 100% efficient. Electric motors used to power the fans lose some energy as friction-related heat. The fan motors and blades must overcome friction within the system. The chemical processes and filters do not remove 100% of the CO2. Energy is consumed when pumping chemicals to regenerate the liquid hydroxide solutions. Compressors are not 100% efficient, and so forth. Even with advances in DAC technology, such as Climeworks’ Gen 3 DAC process, the energy requirements remain far greater than the theoretical minimums.
Although some of the energy, particularly the heat required for calcination, can be supplied directly by burning fossil fuels such as natural gas, this analysis assumes that all energy requirements are met using electricity generated from zero-emissions sources. If fossil fuels are used to generate electricity or to provide the heat needed to release captured CO2, the net CO2 reductions will decrease. For example, using electricity generated from coal for DAC would likely result in a net increase in CO2 emissions because of how much CO2 coal releases when burned.35 Similarly, this report does not consider using green hydrogen as an energy source for DAC because manufacturing hydrogen of any type requires more energy than the hydrogen produced can provide.36
Published estimates since 2011 in numerous academic studies on the energy requirements of DAC have varied widely depending on the assumed DAC technology (see figure 3).37 The overall average of the estimates shown (the dashed line in figure 3) is 1,820 kWh per tonne of CO2 removed. By comparison, average monthly residential electricity use in the U.S. was around 850 kWh in 2024.38 Hence, removing just 1 tonne of CO2 using DAC requires more than two months of a U.S. household’s average electricity consumption. Moreover, the average of 1,820 kWh per tonne from the studies shown in figure 3 includes predictions of future energy use for DAC that are, at best, uncertain. For example, the 694 kWh/tonne estimate by Fuhrman et al. is an estimate of energy use for DAC in 2030 and assumes technological improvements reduce the energy required by over 50%.39 This is unrealistic.
Figure 3: Published Estimates of DAC Energy Requirements
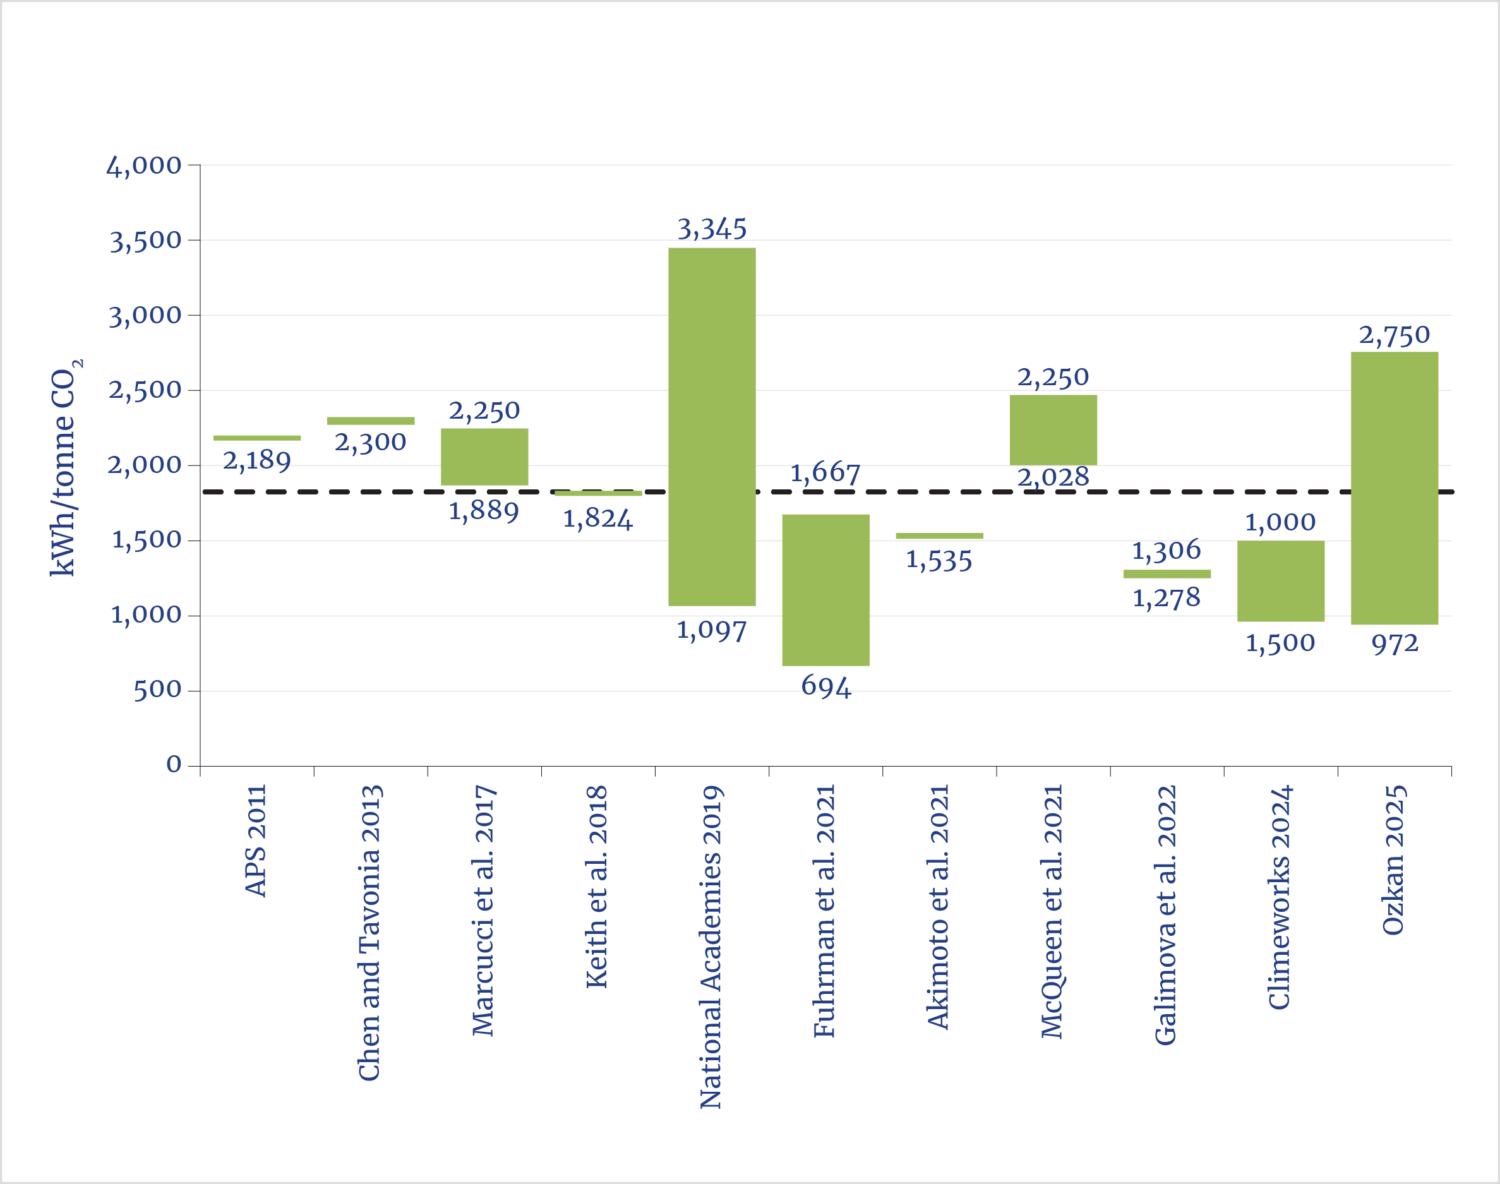
Source: Adapted from Lucas Desport et al., “Deploying Direct Air Capture at Scale: How Close to Reality?,” Energy Economics 129 (January 2024): 107244, https://doi.org/10.1016/j.eneco.2023.107244.
Energy Requirements for Large-Scale DAC Implementation
Using the data in figure 3, the electricity required for large-scale implementation of DAC can be calculated. Ignoring Fuhrman et al.’s 2021 unrealistic forecast value of 694 kWh, then, the electricity requirement for a single facility capturing 1 million tonnes of CO2 annually would range from 972 GWh40 to 3,345 GWh,41 depending on the technology employed.42 The low-end value is approximately equal to the total retail electricity sales in Rhode Island and Vermont for November 2025. The high-end value is approximately equal to total retail sales in Connecticut, Rhode Island, Maine, and Vermont during that same month.43
Based on the energy consumption estimates in figure 3, DOE’s stated goal of removing between 100 million and 2 billion tonnes (2 Gt) of CO2 annually with DAC would require between 97 TWh and 335 TWh of electricity from zero-emissions sources. Even if using the 1,200 kWh/tonne value from Herzog et al.,44 rather than the 1,820 kWh/tonne average of the studies in figure 3, removing 2 billion tonnes (i.e., DOE’s high-end recommendation) of CO2 annually would require around 2,400 TWh of electricity. That amount of electricity is equivalent to over 55% of the 4,300 TWh of electricity generated in the U.S. from all sources in 2024.45 If, instead, the energy requirement averaged 1,820 kWh/tonne, then the 4,800 TWh of electricity required would be equivalent to 85% of all electricity generated in the U.S. in 2024. Assuming that this much energy could be devoted to DAC is unrealistic.
As it makes little environmental or economic sense to burn CO2-emitting fossil fuels to generate electricity for DAC, the additional generating capacity required presumably would come from sources that emit no CO2, such as nuclear plants or wind and solar generation.46
The characteristics of different generating resources must be considered to estimate the new generating capacity required for large-scale DAC, as DAC facilities require a steady power supply to operate efficiently. Modern nuclear plants in the U.S. operate at capacity factors above 90%;47 that is, they typically run over 90% of the time, shutting down only every 18 to 24 months to refuel. Hence, a 1,000 MW plant will generate about 7,900 MWh/year.48 Thus, at an average of 1,200 kWh/tonne, capturing 100 million tonnes of CO2 with DAC would require 120 TWh of electricity and 15,000 MW of new nuclear capacity. Capturing 1 billion tonnes of CO2 annually with DAC would require building 150,000 MW of new nuclear capacity—150 new nuclear plants—on top of the existing U.S. nuclear plant fleet capacity of about 98,000 MW.49 Adding reserve capacity to account for unplanned generator outages, which is typically around 15%–20% in most regions of the U.S., would require building a total of 18 new 1,000-MW nuclear plants to capture 100 million tonnes of CO2 with DAC and 180 such plants to capture 1 billion tonnes.
Constructing dozens, let alone hundreds, of nuclear plants would take several decades. For example, Georgia Power’s Plant Vogtle, which consists of two 1,000-MW reactors and is the most recent nuclear plant built in the U.S., took over a decade to complete and cost over $33 billion to construct. Even if permitting reforms speed up the approval and construction process, thousands of workers will be needed to build the new nuclear plants and many more will need to be trained to operate them.
Suppose, instead, that the electricity required for DAC were supplied by wind and solar facilities. Doing so would require far more MW of capacity because of those resources’ low availability, as onshore wind generates electricity for only around 35% of all hours and solar for only about 25%.50 Furthermore, wind and solar are inherently intermittent; they generate electricity only when the wind blows or the sun shines.51
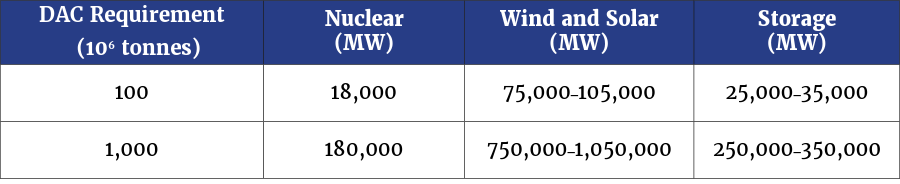
The only way to overcome that intermittency, at least without using quick-responding natural gas generators, is to build enough battery storage capacity to power DAC facilities when there isn’t enough wind or solar power. But that also means building still more wind and solar generation capacity to provide enough surplus electricity to charge the batteries. In other words, substantial overbuilding of wind and solar generation would be necessary to provide sufficient electricity for DAC facilities and to charge the batteries needed to keep those facilities running at night, on cloudy days, and when the wind is not blowing. Based on the low capacity factors and inherent intermittency of wind and solar generation, the total wind and solar capacity required would be roughly five to seven times greater than that of nuclear. For example, to obtain the equivalent amount of electricity from 15,000 MW of new nuclear capacity would require building 75,000–105,000 MW of wind and solar. Moreover, overcoming wind and solar’s intermittency would necessitate adding around one-third—between 25,000 MW and 35,000 MW—of the amount of battery storage built (see table 1).52
Capturing 1 Gt of CO2 would require between 750,000 and over 1 million MW of wind and solar capacity, plus an additional 250,000–350,000 MW of battery storage. By comparison, U.S. utility-scale battery storage capacity at the end of 2025 was approximately 35,000 MW; therefore, the total battery storage capacity needed to supplement wind and solar power for DAC facilities would be 10 times the existing capacity.53 As will be discussed, these quantities of generation and battery storage are so large as to be physically impossible and economically ruinous.
Table 1: Comparison of Nuclear Versus Wind/Solar/Battery Storage Capacity for DAC
The U.S. Energy Information Administration’s (EIA) most recent estimate of the cost to build an advanced nuclear plant, excluding financing costs, is $7,861/kW (2023$) for twin 1,000-MW reactors (see table 2).54 Similarly, the overnight costs of wind, solar, and battery storage are $1,693/kW, $1,445/kW, and $1,621/kW, respectively.55
Table 2: Capacity and Operating Costs of New Generating Resources
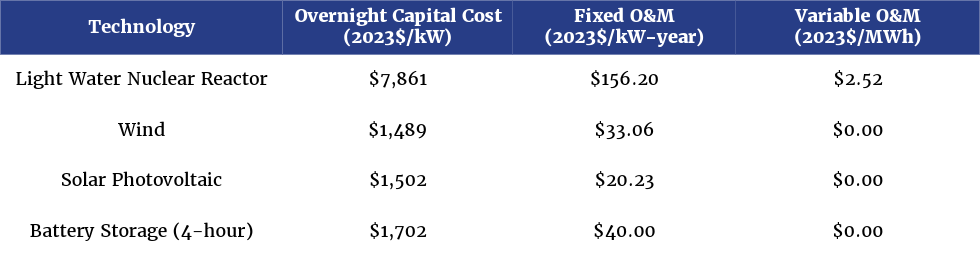
Source: Data from U.S. Energy Information Administration, Capital Cost and Performance Characteristics for Utility-Scale Electric Power Generating Technologies (U.S. Energy Information Administration, 2024), https://www.eia.gov/analysis/studies/powerplants/capitalcost/pdf/capital_cost_AEO2025.pdf.
Even if this capacity could be built in a timely fashion, the increased demand for the required materials would likely lead to higher manufacturing costs. Nevertheless, even assuming no increases in these EIA costs, the total capital costs for the additional generating capacity required to capture 1 Gt annually would exceed $1.4 trillion for the nuclear plants and $1.6 trillion for the wind, solar, and battery combination.
Just as the interest paid on a home mortgage can exceed the mortgage itself, the additional financing costs could easily double the capital costs. For example, investor-owned utilities typically have an average cost of capital of between 7% and 8%, which reflects both their cost of debt and the returns they must provide to shareholders.56 Consequently, over the lifetime of a typical generating plant, total financing costs will surpass initial capital costs.57 In other words, over its lifetime, a utility could recover nearly $2 billion in financing costs for a $1 billion generation plant. Hence, the overall capital and financing cost for new generating plants could easily be about three times the construction cost—around $5 trillion—to meet the goal of capturing 1 Gt CO2 annually. If those capital costs were recovered over 50 years, the cost per tonne of CO2 captured would be $100. Yet if the costs were recovered over a shorter time frame, the costs per tonne would increase. If the plants were government-financed, the government would have to issue more debt, such as more Treasury bonds. That increased debt would itself have to be financed, as would the Section 45Q tax credits, further raising the overall costs. Currently, the yields on 30-year Treasury bonds are just below 5%.58 Over an assumed 30-year financing period—and even assuming the wind, solar, and battery capacity did not require replacement during that time—the total cost of the electricity required to capture 1 Gt of CO2 annually would be approximately $3.7 trillion using nuclear plants and $3.9 trillion with a wind, solar, and battery combination, or over $1 million per person in the U.S.
There are also additional operations and maintenance (O&M) costs for the generating plants, which would be around $30 billion annually (see table 3). Thus, O&M costs would add an additional $30/tonne to the capital cost per tonne, resulting in an overall electricity cost of at least $130/tonne, before accounting for the cost of the DAC facilities themselves.
Table 3: Annual Energy Capital and O&M Costs for 1 Gt of DAC (Millions of $)
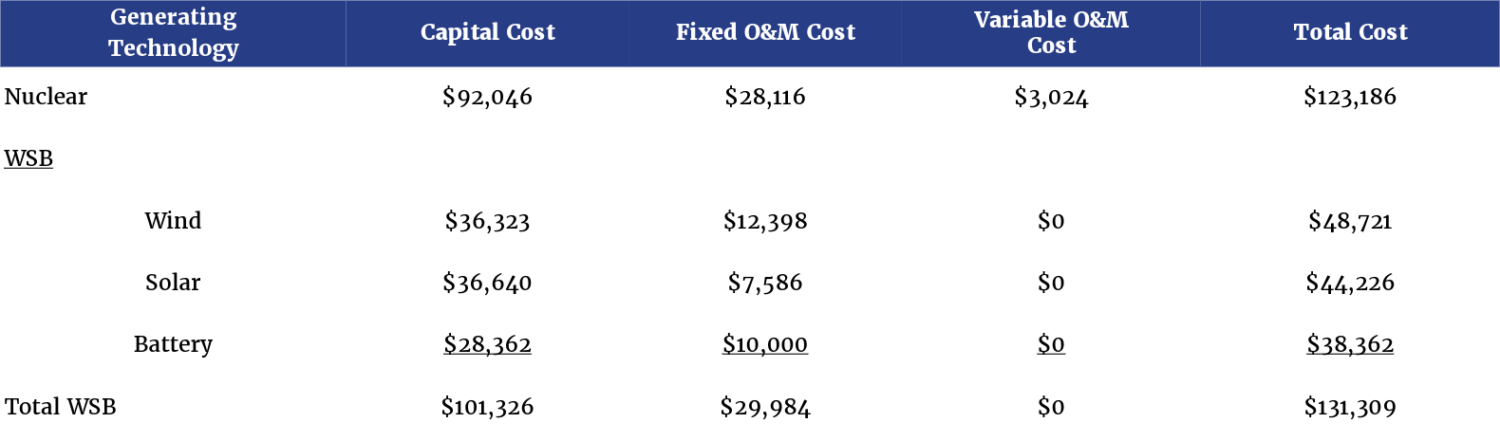
Source: Data from U.S. Energy Information Administration, Capital Cost and Performance Characteristics for Utility-Scale Electric Power Generating Technologies (U.S. Energy Information Administration, 2024), https://www.eia.gov/analysis/studies/powerplants/capitalcost/pdf/capital_cost_AEO2025.pdf; and author calculations.
There would also be costs for the accompanying infrastructure required to deliver the required electricity, including high-voltage transmission lines, transformers, and substations. Given the electricity required to capture 1 Gt per year, the additional infrastructure costs alone would likely amount to hundreds of billions, if not several trillion dollars.59 Again, this could easily add another $100/tonne to the cost of the electricity. Additionally, if the electricity were supplied solely by wind and solar facilities, the associated land requirements would be huge. Wind power, for example, requires between 20 and 145 acres of land per MW of installed capacity, depending on location, with an average of just over 80 acres per MW.60 Solar requires about 5 to 7 acres per MW of installed capacity. Installing 500,000 MW of each would thus require over 40 million acres of land—an area larger than Florida.
As shown, the overall costs for supplying the electricity needed to operate DAC facilities would total trillions of dollars and equate to be hundreds of billions of dollars every year. The costs to build and maintain the DAC facilities themselves must be added.
Estimating the Costs of Building and Maintaining DAC Facilities
There is a large range of estimates for the cost of scaled-up DAC facilities capable of capturing 1 million tonnes of CO2 per year. The most optimistic—and unrealistic—projections claim that overall DAC costs will decrease by 80% to just $100/tonne of CO2 by 2050.61 However, as shown in the previous section, the energy costs alone will exceed $200/tonne and are likely to increase over time owing to increased materials demand. A 2019 National Academies of Sciences, Engineering, and Medicine study estimated total capital costs—including financing charges, interest during construction, and cost escalation over time—for a generic, 1-million-tonne liquid DAC system at between $675 million and $1,255 million.62 Hence, building the 1,000 such facilities necessary to capture 1 Gt of CO2 per year would cost between $675 billion and 1.25 trillion. Previous studies have assumed a 20-year plant life for DAC facilities. Assuming an 8% cost of capital, the resulting annualized costs would range from $68.8 billion to $127.8 billion, or about $69/tonne to $128/tonne of CO2—just for the DAC facilities themselves. These assumed costs are far less than the estimated cost of the only large-scale DAC facility in existence: Occidental Petroleum’s Stratos plant in the Permian Basin. The plant uses Carbon Engineering’s liquid DAC technology,63 and the current estimated cost is around $1.3 billion.64 Based on a 20-year plant life and an 8% cost of capital, the resulting annualized cost—before accounting for energy and plant O&M costs—is $132 million, equivalent to $264/tonne.65
In addition to the estimated costs of the Stratos plant, recent research concludes that assumed DAC plant cost estimates have been overly optimistic.66 A 2020 study by McQueen et al. examined different configurations of liquid DAC systems using natural gas for calcination as well as fully electric systems powered with wind, solar, or nuclear power.67 For wind- and solar-powered systems, they estimated overall costs (i.e., DAC facilities plus energy) for a 1-million-tonne facility at between $360/tonne and $690/tonne. They estimated overall costs using nuclear power at between $400/tonne and $620/tonne. However, they assumed that the DAC and accompanying energy systems, including nuclear plants, all had a 20-year life. Their assumption leads to significant overestimates in the annualized costs of nuclear power.68 And while studies, such as those prepared by the National Academies, predict rapidly falling costs for DAC systems owing to scale economies, they fail to account for increased demand for materials—including steel, cement, copper, and chemicals—and the resulting price increases.69 Hence, overall costs would exceed $400/tonne of CO2 captured, even before accounting for likely increases in material and energy costs as demand rises.
Costs of DAC to Consumers and Businesses
If DAC is implemented on a large scale, the costs will be paid by consumers and taxpayers. Based on McQueen et al.’s estimated CO2 removal costs of $400–$620/tonne, building and operating 1,000 DAC facilities to remove 1 Gt annually would cost $400–$620 billion before accounting for inflation. That translates into annual costs of between $1,100 and $1,800 per person in the U.S. and over $4,000 for the average household.
It is unclear how these costs would be paid. If taxpayers covered all DAC-related costs, the adverse economic impacts would be severe. Paying hundreds of billions of dollars for DAC would divert money from private investment. Individuals and businesses would pay higher costs and have less money available for consumption and investment. This would lead to a reduction in economic growth and a likely loss of millions of jobs. If, instead, the U.S. government financed these costs by issuing more debt, the additional financing costs would have fewer initial direct effects on the economy but potentially greater long-term effects from higher interest rates required to service the additional debt. Regardless, DAC would reduce the overall economic well-being of individuals.
Comparing DAC Costs with Estimates of the Social Cost of Carbon
The estimated CO2 removal costs associated with DAC can be compared with estimates of the social cost of carbon (SCC) to assess whether DAC’s costs exceed the estimated benefits of the resulting CO2 reductions. The SCC is an estimate of the value of the claimed damages attributable to CO2 emissions. Such estimates vary widely. In 2023, for example, the U.S. Environmental Protection Agency (EPA) published an estimate of $210/tonne in 2025, increasing to $230/tonne by 2030.70 That value is four times greater than the $51/tonne value published in 2021 by the Interagency Working Group.71 A 2024 study by Moore et al. examined numerous previous studies and found a median value of $185/tonne but a far higher average value of $285/tonne, as some studies have estimated SCC values that are over $1,000/tonne.72
Although SCC estimates are controversial because they are based on predictions that can extend three centuries into the future,73 as demonstrated, the implied costs per tonne of CO2 reduced using DAC exceed even these newest—and highest—estimates of SCC.
The Potential Impact of DAC Removal on Global Climate
Despite its high cost, DAC has been touted as an essential technology for addressing climate change.74 However, there are different claims about the quantity of CO2 that must be captured by 2050 to address climate change. Hence, a key question regarding existing DAC subsidies is how different levels of CO2 removal would affect atmospheric concentrations and global temperatures.
In 2024, total U.S. energy-related CO2 emissions were just over 4.6 Gt.75 Another 300 million tonnes were estimated to be from non–energy-related sources.76 Overall, world energy-related CO2 emissions were approximately 38 Gt in 2024.77 Those emissions have increased an average of 265 million tonnes per year over the past decade. Hence, removing 100 million tonnes of CO2 in one year would be equivalent to just over one week of 2024 U.S. emissions, less than one day of 2024 global emissions, and less than five months of average annual energy-related emissions growth.
The effects of different DAC levels on global temperature can be projected using Intergovernmental Panel on Climate Change (IPCC) estimates of climate sensitivity.78 At the current atmospheric CO2 concentration of around 425 ppm, removing 1 Gt of CO2 with DAC would reduce atmospheric CO2 by about 0.13 ppm. It would lower the average global temperature by 0.003°C.79 Removing 10 Gt of CO2 would reduce its atmospheric concentration by 1.3 ppm and lower the average global temperature by 0.011°C. To put these temperature changes into context, estimates of average global temperatures have an uncertainty of approximately ±0.13°C.80 In other words, the uncertainty in estimating average world temperatures is 100 times larger than the estimated impact of removing 1 Gt of CO2 and 10 times larger than that of removing 10 Gt.
It is also possible to estimate the potential impacts on world temperature from sustained DAC removal for multiple years using a publicly available climate model called MAGICC,81 which was initially funded by the EPA. The estimated impacts are based on reductions in CO2 emissions across different future emissions scenarios. These scenarios, known as Representative Concentration Pathways (RCPs), were developed to model future climate change. For example, RCP 4.5 is a mid-range scenario. The 4.5 represents the predicted increase in energy from greenhouse gases retained by the Earth between 1750 and 2100, measured in watts per square meter. RCP 8.5, by contrast, is considered a worst-case scenario that assumes far more energy is retained because of greenhouse gas emissions, resulting in a larger increase in global average temperature.
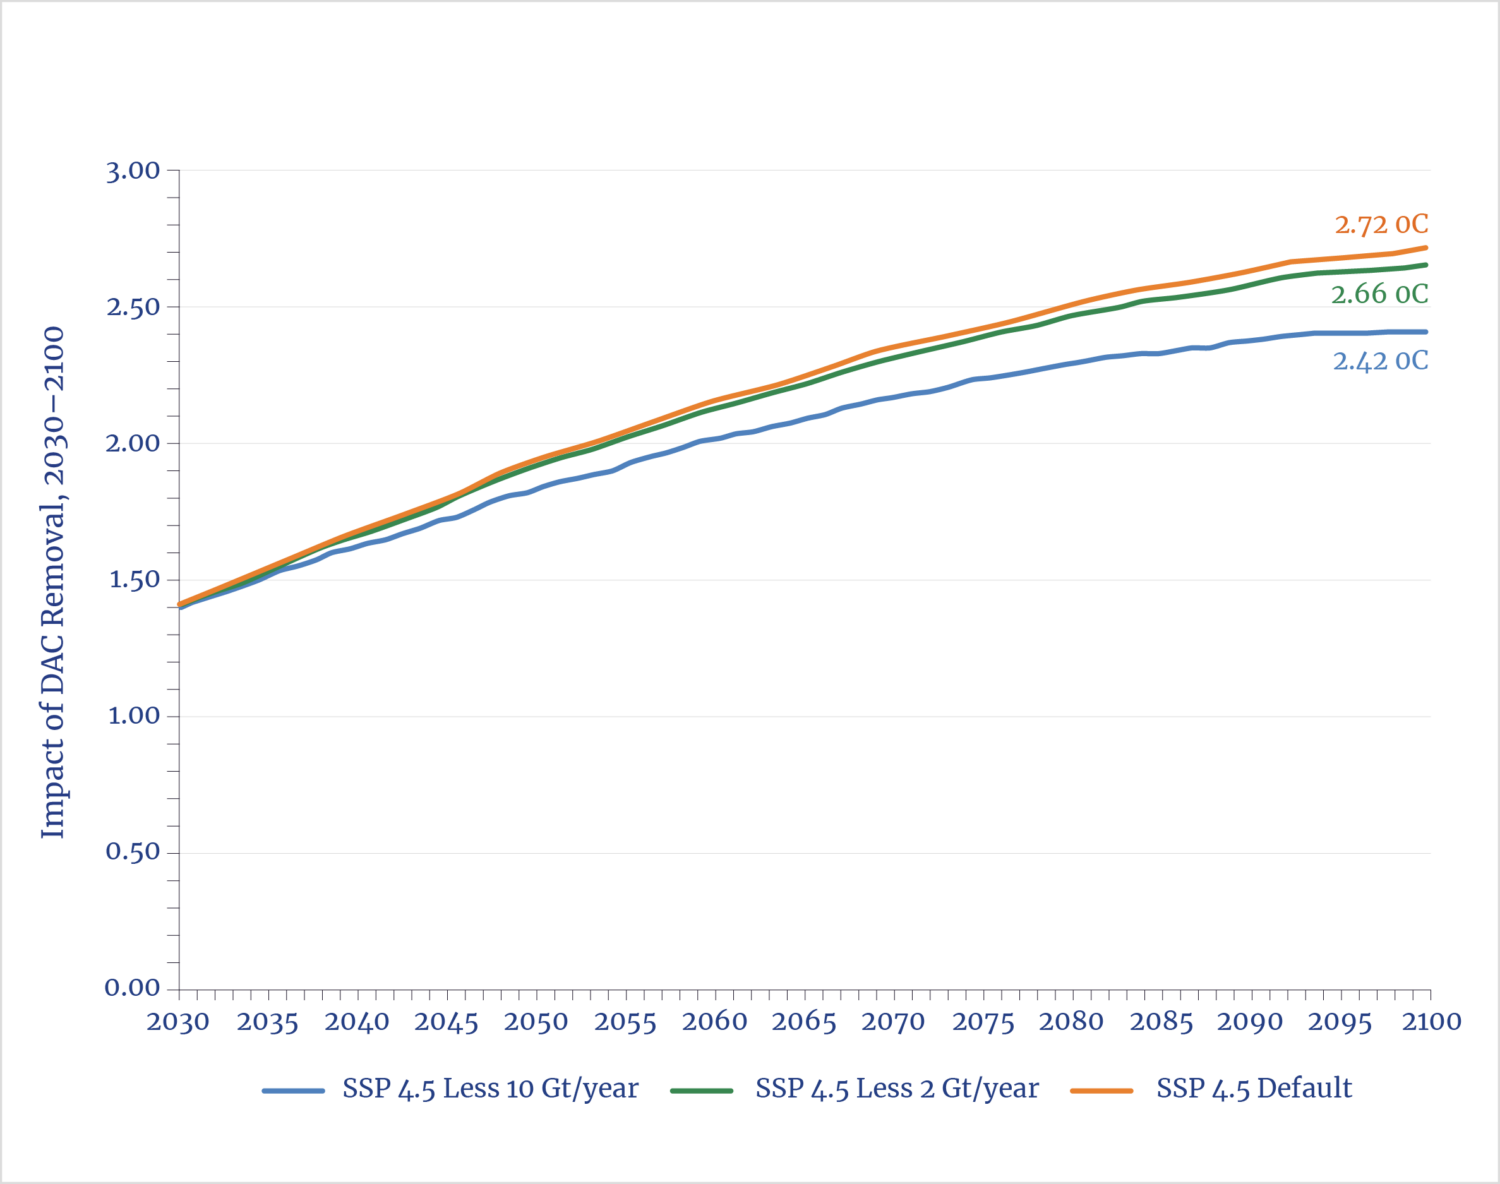
For example, suppose that 2 Gt of CO2 are removed annually, beginning in 2030 and continuing through 2100, for a total of 140 Gt removed. Under the RCP 4.5 scenario,82 the resulting reduction in average world temperature by the year 2100 would be −0.06⁰C (see figure 4), from an initial estimate of 2.72⁰C to 2.66⁰C. As discussed previously, the claimed uncertainty in measuring average world temperature is ±0.13°C. Hence, the estimated reduction in world temperature from removing 2 Gt of CO2 annually with DAC could not be separated from the inherent noise in those temperature estimates. Even if 10,000 DAC facilities, each extracting 1 million tonnes/year, could be built to remove 10 Gt of CO2 annually, the reduction in global temperature would be only 0.3⁰C—from 2.72⁰C to 2.42⁰C. A temperature reduction of 0.3⁰C would have little impact on the climate.
Moreover, using Herzog et al.’s estimate of 1,200 kWh/tonne,83 the energy required to remove 10 billion tonnes of CO2 with DAC would be 12,000 TWh per year, almost 45% of the 27,000 TWh of global electricity consumption in 2023.84 In 2023, total world generating capacity was 9,090 GW, over half of which was from fossil-fuel generation.85 The infrastructure needed to increase the world’s generating capacity to produce 12,000 TWh of additional electricity would be staggering in both scope and cost. For example, it would require building over 1,500 new nuclear plants, with four times the capacity of the world’s existing nuclear fleet.86 It would require 5 million MW of wind and solar generation, along with several million MW of battery or other storage. The cost would be many trillions of dollars. The materials requirements—not only for generating resources87 but also for the DAC facilities themselves88—would significantly increase demand for these materials, likely raising their prices and making DAC facilities more costly to construct and operate. Yet, as shown in figure 4, the climate impacts would be minimal.
Figure 4: Estimated Impact of DAC Removal, 2030–2100
Conclusion
As this report demonstrates, DAC is energy-intensive and high-cost. No technological advancements can overcome the laws of thermodynamics, meaning that DAC will always require significant energy. Claims that energy requirements for DAC can be drastically reduced ignore these physical limits. Similarly, the material requirements for large-scale DAC imply that forecasts predicting drastic decreases in DAC facilities’ costs are unrealistic.
To achieve maximum CO2 reductions, the energy required for DAC must not come from fossil fuels, as doing so would reduce or even eliminate net emissions reductions. Hence, large-scale implementation of DAC would require the U.S. to devote vast physical and economic resources to construct and operate new zero-emissions electric generating facilities. The alternatives would be to construct dozens or even hundreds of new nuclear plants or erecting many thousands of wind turbines and solar facilities across vast swaths of the country, along with hundreds of thousands of megawatts of battery storage facilities. The additional generating capacity required to capture 1 billion tonnes of CO2 annually—half the 2 billion tonnes/year value the DOE claimed could be required—is so immense that it would take decades to build and cost trillions of dollars. Moreover, if the additional generating capacity were primarily wind and solar, the land area required would be larger than the state of Florida.
Likewise, forecasts of substantial reductions in DAC costs are overly optimistic. They fail to account for the technological limits of the energy required. They also overlook the price pressures that would arise if DAC were implemented at scale, which would increase the demand for the materials needed to construct and operate DAC facilities, as well as the accompanying infrastructure. Yet even large-scale implementation of DAC would have minuscule impacts on CO2 levels.
Moreover, sequestering CO2 under pressure entails environmental risks if the CO2 subsequently escapes. In 1986, for example, Lake Nyos in Cameroon suffered a limnic eruption that released an estimated 100,000–300,000 tonnes of CO2. Because CO2 is heavier than air, the released gas traveled along the ground, suffocating over 1,700 people and 3,500 livestock.89 (A similar event occurred two years earlier at Lake Monoun, also in Cameroon.) Although sequestration would occur in supposedly leakproof underground formations, there remains a risk of disruption that could result in potentially catastrophic releases.90
Despite its high cost and minimal potential impact on CO2 concentrations, the tax credits under Section 45Q will cost billions of dollars per year if large-scale DAC facilities are constructed. For example, if DAC facilities capable of capturing 100 million tonnes were developed by 2033, the cost of the tax credit would be $18 billion/year—totaling $180 billion over the 10-year period during which facilities would be allowed to claim the credits.91
Assuming that federal taxes are not increased to recover the cost of the tax credit, the $180 billion would need to be financed. At a 5% interest rate over the 10-year period, financing that debt would incur an additional $257 billion that would bring the total to $337 billion, or $337/tonne. This is almost 50% higher than the most recent SCC estimates. Thus, the subsidies alone fail a cost-benefit test, much less a cost-benefit analysis that includes the additional costs of the facilities themselves and the energy and material costs to operate them. Given these financial and practical limitations, large-scale implementation of DAC as a primary CO2 mitigation strategy is unrealistic and unviable.
Appendix 1: Calculation of Minimum Theoretical Energy Requirements for DAC
- Theoretical Energy Requirements for Air Handling
At standard temperature and pressure (0⁰C and 1 atmosphere pressure, called STP), 1 cubic meter (m3) of air has a mass of approximately 1.29 kilograms, based on an average mass of air of 28.97 gms/mole.92 Using the ideal-gas law (pV = nRT),93 1 mole of air has a volume of 0.0224 m3 at STP. Therefore, 1 m3 of air contains 1/0.0224 = 44.6 moles of air. At a concentration of 425 ppm, there are 44.6 × 0.000425 = 0.019 moles of CO2 per m3. CO2 has a molecular weight of 44.01 gms/mole. Therefore, there are 44.01 × 0.019 » 0.84 gm CO2 /m3. Capturing 1 tonne of CO2 thus requires moving a minimum of (106 / 0.84) » 1.2 million m3 of air at STP, assuming 100% of the CO2 is captured. At higher altitudes and/or higher temperatures, the amount of CO2 per m3 decreases, which means that more air must be moved to capture the same amount of CO2. For example, at 25⁰C, the CO2 content of air at 1 atmosphere pressure is 0.76 gm/m3 and the required amount of air to capture 1 tonne of CO2 would be (106 / 0.76) » 1.3 million m3 of air.
To capture 1 million tonnes of CO2 per year means capturing about 114.2 tonnes per hour, assuming the DAC system operates continuously. Thus, this means moving 114.2× 1.3 x 106 » 148 million m3 of air every hour, or just over 41,200 m3/sec.
The instantaneous power required to move that air will depend on the rate of airflow—that is, how much air is moved per unit of time—and the pressure drop through the filtering material. Because energy use increases with the square of velocity through a fan, DAC systems are designed to flow air at low speeds, such as 1.5 m/sec.
The theoretical minimum pressure drop depends on the amount of air moved per unit of time and the speed at which the air is moved. The fan area needed to move this much air at this velocity is given by Q / v, where:
- Q = quantity of air (m3)
- v = air velocity (m/sec)
Thus, to move 41,000 m3 of air at 1.5 m/sec requires a fan area of about 27,500 m2—larger than five football fields.
The theoretical minimum pressure drop for a fan moving this amount of air can be calculated using Bernoulli’s principle:

where:
Hence, to move air through the fans at 1.5 m/sec, the theoretical minimum pressure drop is:

The actual pressure drop in DAC systems depends on the resistance to airflow through the liquid or solid materials and the length of those materials, and it is far higher.94 A pressure drop of 100 Pa is optimistic. (This is similar in concept to airflow through a pipe.)
The standard formula for the power (kW) required to move a specific volume of air is given by the formula:

where the pressure drop is measured in Pascals (Pa).95 Using the airflow per second calculated above, the theoretical minimum energy required would be:

In reality, pressure drop is far greater because of resistance to airflow in both the fan and the absorbent materials. The systems developed by Carbon Engineering and Climeworks have pressure drops between 100 and 300 Pa. Assuming a pressure drop is 100 Pa and fan efficiency is 80% (both optimistic), then the power required is:

At a capture rate of 114.2 tonnes of CO2 per hour, the energy requirement will be 5,150 kW / 114.2 = 45 kWh / tonne.
2. Thermodynamic Minimum Energy to Separate CO₂ from Air
The minimum energy required to separate CO2 from air is based on the Gibbs free energy formula:96

where:
R = 8.314 joules/mole (gas constant)
T = 298⁰K (standard temperature)
x = mole fraction of CO2 in air (» 425 ppm = 4.25 x 10⁻⁴)
Then, DG = (8.314) × (298) × ln(1/4.25 x 10-4) » 19.2 kJ / mole.
One mole of CO2 has a molecular weight of 44.01 grams. Therefore, 1 tonne of CO2 contains 106 gms / 44.01 » 22,727 moles. Therefore, the minimum energy per tonne at standard temperature and pressure is: (19.2 kJ/mole) × (22,727 moles) » 437,500 kJ = 0.437 GJ. 1 GJ » 120 kWh because 1 GJ » 277.8 kWh.
3. Theoretical Minimum Energy for CO2 Compression
The theoretical minimum energy to compress CO₂ from 1 bar to 50 bar depends on the compression process. For the ideal case, isothermal compression (constant temperature) can be assumed, which gives the lowest possible work requirement. The formula for isothermal compression is:97

where:
- W = total energy required
- P1= initial pressure (absolute)
- P2= final pressure (absolute)
- V1= initial volume
The ideal-gas law98 states that:

where pressure, P, is measured in Pascals (Pa). Thus,

The initial volume, V1, of 1 kg of CO₂ at 298⁰K and 1 atmosphere (101.325 Pa) is then calculated as follows:

One bar is 100,000 Pa, so 1 atmosphere of pressure is 1.01325 bar. CO2 is typically pressurized to 100 bar for transport. So, to pressurize 1 kg of CO2 the energy required is:

Therefore, the theoretical minimum energy required to compress 1 tonne of CO2 is »258,500 kJ = 0.2585 GJ » 72 kWh.
Adding the three components together yields a minimum energy requirement of 45 kWh + 120 kWh + 72 kWh = 237 kWh.
4. Temperature Impact of Removing 1 Gt of Atmospheric CO2
As discussed previously in the report,99 the mass of the atmosphere is about 5.15 x 10¹⁵ tonnes. At 425 ppm, CO2 has a fractional weight of 0.00646%, because CO2 is heavier than air. The molecular weight of air is 28.97 gms/mole and the molecular weight of CO2 is 44.01 gms/mole. The calculation is:

Hence, the weight of atmospheric CO2 is (0.00646) × (5.15 × 1015) » 3.33 × 10¹² tonnes.
Thus, 1 ppm = (1 / 425) × 3.33 × 1012 » 7.84 Gt of CO2.
Therefore, 100 million tonnes of CO2 corresponds to (0.1/7.84) » 0.013 ppm, 1 Gt corresponds to » 0.13 ppm, and 10 Gt corresponds to » 1.3 ppm.
The Intergovernmental Panel on Climate Change (IPCC) formula for radiative forcing of CO2 is:100

where:
- COld = 425 ppm
- CNew = (425 − Dppm)
For example, if 1 Gt of CO2 is removed, DF = 5.35 × ln(424.87/425) = 5.35 × (−0.000705) » −0.00377 watts/m2. If 10 Gt were removed, DF = 5.35 × ln(423.7/425) = −0.0164 watts/m2.
The assumed OPCC value for climate sensitivity is » 0.8⁰C per W/m2.101 Therefore, the temperature reduction associated with removing 1 Gt of CO2 is:

Similarly, the temperature reduction from removing 10 billion tonnes would be (0.8) × (−0.0164) = −0.013⁰C.
Appendix 2: Calculation of Section 45Q Subsidy Financing Costs
To finance government subsidies, the alternatives are raising taxes, issuing new debt, or a combination of both. Hence, the total cost of a subsidy will be the direct outlay plus the associated financing costs, F, i.e., STOTAL = SDIRECT + F.
Assume that a percentage, r, of the 45Q cost is financed, that all bonds have the same coupon rate, r, and the same term of T years. The initial sale price of such a bond depends on the assumed path of interest rates. If, for example, current interest rates are expected to increase over time because of rising deficits, then bonds will sell at a discount and financing costs will be higher. If interest rates are expected to decrease, then bonds will sell at a premium and the financing costs will be lower. For simplicity, I assume a constant interest rate over time which means all bonds sell at their face value.
Although U.S. Department of the Treasury bonds themselves do not compound interest (although savings bonds do), refinancing bonds, including interest payments, results in compounding of the total subsidy cost. Specifically, for an initial 45Q expenditure, S0, the interest expense, I, will equal:

where r = percentage of 45Q financed with debt; r = annual coupon rate on that debt; and T = bond term in years.
Because 78% of Treasury bonds are held by the U.S. public,102 the interest payments on this percentage of bonds issued will be subject to federal tax collection, which reduces the 45Q financing cost. For a given financing percentage, r, and income tax rate, t, the net financing cost, FTC, is therefore:

where t = the average tax rate paid by bondholders.
According to the Tax Foundation, the top 50% of taxpayers in 2022 accounted for 97% of all taxes paid and pay an average tax rate of 15.87%.103 I assume all Treasury debt is held by these taxpayers. Therefore, the net financing cost is:

For example, if 100% of the tax credit cost is financed (ρ = 1), then the financing cost for $180 billion in 45Q subsidies, assuming a 5% cost of debt financed for 10 years would be $257 billion.
Notes
- Tonne refers to a metric ton, which is 1,000 kilograms or approximately 2,200 pounds.
- Pub. L. 117-169, 136 Stat. 1818, Sec. 13104.
- “Auction 70,” The Regional Greenhouse Gas Initiative, December 3, 2025, https://www.rggi.org/Auction/70.
- Pub. L. 119-121, 139 Stat. 72.
- Additionally, there are other questions as to whether large-scale DAC would have other physical and even potentially negative impacts on the atmosphere. That issue is beyond the scope of this report.
- A detailed discussion of the physical and chemical processes used for DAC is beyond the scope of this report. The goal here is to provide an overview. The notes in this section direct interested readers to sources that provide additional information.
- Pollution control equipment on coal-fired power plants, called scrubbers, were originally designed to reduce emissions of sulfur dioxide and oxides of nitrogen.
- Kristi E. Swartz, “The Kemper Project Just Collapsed. What It Signifies for CCS,” E&E News, October 26, 2021, https://www.eenews.net/articles/the-kemper-project-just-collapsed-what-it-signifies-for-ccs/; and David Schlissel, “Southern Company Demolishes Part of the $7.5 Billion Kemper Power Plant in Mississippi,” Institute for Energy Economics and Financial Analysis, October 14, 2021, https://ieefa.org/resources/ieefa-us-southern-company-demolishes-part-75-billion-kemper-power-plant-mississippi.
- “What is Carbon Capture and Storage?,” Carbon Storage FAQs, National Energy Technology Laboratory, accessed January 10, 2026, https://www.netl.doe.gov/carbon-management/carbon-storage/faqs/carbon-storage-faqs.
- Schlissel, “Southern Company Demolishes.”
- Schlissel, “Southern Company Demolishes.”
- Clean Air Task Force, Carbon Capture and Storage: What Can We Learn from the Track Record? (Clean Air Task Force, 2024), https://cdn.catf.us/wp-content/uploads/2024/07/16151022/CCS-Project-Track-Record-Report.pdf. In March 2024, a CCS system began operating at the Kelvin coal-fired power plant in Kempton Park, South Africa. The cost of the CCS system is not publicly available.
- Mohammad Songolzadeh et al., “Carbon Dioxide Separation from Flue Gases: A Technological Review Emphasizing Reductions in Greenhouse Gas Emissions,” The Scientific World Journal 2014, no. 1 (February): 28131, https://doi.org/10.1155/2014/828131.
- Kevin E. Trenberth and Lesley Smith, “The Mass of the Atmosphere: A Constraint on Global Analyses,” Journal of Climate 18, no. 6 (2005): 864–875, https://doi.org/10.1175/JCLI-3299.1. Based on the atmosphere’s weight of 5.15 quadrillion tonnes, this translates to approximately 3.1 trillion tonnes of CO2. Because CO2 is slightly heavier than ambient air, it constitutes 0.06% of the atmosphere by weight. Hence, removing 1 billion tonnes of CO2 from the atmosphere would reduce the atmospheric concentration by about 0.14 ppm, or about 1/3000th of the current atmospheric concentration.
- There are several approaches that have been developed in laboratories, but these have not been commercialized. A discussion of these approaches in beyond the scope of this report.
- “Our Technology,” Carbon Engineering, accessed January 15, 2026, https://carbonengineering.com/our-technology/.
- “Highly-Scalable Direct Air Capture,” Climeworks, accessed January 15, 2026, https://climeworks.com/highly-scalable-direct-air-capture.
- The discussion in this section is based on Jessica Valentine and Alexander Zoelle, Direct Air Capture Case Studies: Solvent System (National Energy Technology Laboratory, 2022), https://netl.doe.gov/projects/files/DirectAirCaptureCaseStudiesSolventSystem_083122.pdf; David W. Keith et al., “A Process for Capturing CO2 from the Atmosphere,” Joule 2, no. 8 (August 2018): 1573–1594, p1635, https://doi.org/10.1016/j.joule.2018.06.010; and Robert Socolow et al., Direct Air Capture of CO2 with Chemicals: A Technology Assessment for the APS Panel on Public Affairs (American Physical Society, 2011), https://res.cloudinary.com/apsphysics/image/upload/v1698255780/Direct-Air-Capture-of-CO2-with-Chemicals_snams5.pdf.
- Other hydroxide solutions can be used, although potassium hydroxide has been the most commonly employed.
- See Socolow et al., Direct Air Capture of CO2, 30–31, for a more detailed description of the entire chemical process.
- For a detailed discussion, see, e.g., Robert Mennitto et al., “Solid Sorbents for Direct Air Capture: A Technological and Environmental Perspective,” Current Opinion in Chemical Engineering 50 (November 2025): 101195, https://doi.org/10.1016/j.coche.2025.101195.
- See, e.g., Frank S. Zeman and Klaus S. Lackner, “Capturing Carbon Dioxide Directly from the Atmosphere,” World Resource Review 16, no. 2 (2004): 157–172, http://wordpress.ei.columbia.edu/lenfest/files/2012/11/ZEMAN_LACKNER_2004.pdf; and Frank Zeman, “Energy and Material Balance of CO2 Capture from Ambient Air,” Environmental Science & Technology 41, no. 21 (2007): 7558–7563, https://pubs.acs.org/doi/10.1021/es070874m.
- Mihrimah Ozkan, “Atmospheric Alchemy: The Energy and Cost Dynamics of Direct Air Carbon Capture,” MRS Energy & Sustainability 12 (2025): 46–61, https://doi.org/10.1557/s43581-024-00091-5; Eric Croiset, The State of Direct Air Capture Technology and Industry, Waterloo Climate Institute Technical Brief (University of Waterloo, 2025), https://uwaterloo.ca/climate-institute/sites/default/files/uploads/documents/dac-brief_final_may-2025_v2.pdf; and Climeworks, “Real-World Testing Proves Climeworks’ Gen 3 Efficiency Leap with Svante’s Structured Adsorbents,” accessed February 3, 2026, https://climeworks.com/press-release/real-world-testing-proves-gen3-efficiency-leap-with-svantes-structure. Climeworks claims its Generation 3 technology will reduce energy requirements by half. However, there is no publicly available information as to the actual energy use. Based on published data for the company’s Gen 2 technology in the cited references, Gen 3 likely requires 700–1,500 kWh per tonne of CO2 to be removed.
- Bjørn-Gustaf J. Brooks et al., “The Performance of Solvent-Based Direct Air Capture Across Geospatial and Temporal Climate Regimes,” Frontiers in Climate 6 (April 2024): 1394728, https://doi.org/10.3389/fclim.2024.1394728.
- Ozkan, “Atmospheric Alchemy.”
- See Socolow et al., Direct Air Capture of CO2, 21–22.
- This value is derived in appendix 1.
- Geoffrey Holmes and David W. Keith, “An Air–Liquid Contactor for Large-Scale Capture of CO2 from Air,” Philosophical Transactions of the Royal Society A: Mathematical, Physical and Engineering Sciences 370 (September 2012): 4380–4403, https://doi.org/10.1098/rsta.2012.0137. They derived an empirical relationship to determine pressure drop, based on the depth of the contactors and the air velocity. The energy requirement is discussed in appendix 1. See also María Erans et al., “Direct Air Capture: Process Technology, Techno-Economic and Socio-Political Challenges,” Energy and Environmental Science 15 (2022): 1360–1405, https://doi.org/10.1039/D1EE03523A.
- The formula for energy use by fans can be found in appendix 1.
- National Petroleum Council, “Chapter 6—CO2 Transport,” in Meeting the Challenge: A Roadmap to At-Scale Deployment of Carbon Capture, Use, and Storage (U.S. Department of Energy, 2019; updated 2020), https://www.energy.gov/sites/default/files/2021-06/2019%20-%20Meeting%20the%20Dual%20Challenge%20Vol%20III%20Chapter%206.pdf.
- The calculation can be found in appendix 1.
- See Keith et al., “A Process for Capturing CO2.”
- Grant Faber, Direct Air Capture: Definition and Company Analysis (U.S. Department of Energy Office of Fossil Energy and Carbon Management, 2025), https://www.energy.gov/sites/default/files/2025-01/FECM_Direct%20Air%20Capture%20Definition%20and%20Company%20Analysis%20Report.pdf. See also Jonathan D. Ogland-Hand et al., How to Net-Zero America: Nationwide Cost and Capacity Estimates for Geologic CO2 Storage (Carbon Solutions, 2023), https://www.researchgate.net/publication/374826349_How_to_Net-Zero_America_Nationwide_Cost_and_Capacity_Estimates_for_Geologic_CO2_Storage.
- U.S. Energy Information Administration, “Table 5.1. Sales of Electricity to Ultimate Customers: Total by End-Use Sector, 2015—November 2025 (Thousand Megawatthours),” Electric Power Monthly, November 2025, released January 26, 2026, https://www.researchgate.net/publication/374826349_How_to_Net-Zero_America_Nationwide_Cost_and_Capacity_Estimates_for_Geologic_CO2_Storage.
- U.S. Energy Information Administration, “Table 9.1. Net Generation by Energy Source: Total (All Sectors), 2000–2025 (Megawatthours),” Electric Power Annual 2024, released October 16, 2025, https://www.eia.gov/electricity/annual/table.php?t=epa_09_01.html. Depending on its heat rate (i.e., how much energy is required to generate 1 kWh of electricity) and the type of coal burned, a coal-fired generating plant will produce between 0.7 and 1.1 kg of CO2 per kWh. In 2023, for example, the EIA reported that the average coal-plant emissions were 1.05 kg/kWh. Thus, if a DAC plant requires 1,000 kWh to remove 1 tonne of CO2, the resulting emissions could be as high as 1.1 tonnes. See “How Much Electricity Does the U.S. Generate from Renewable Sources?” Frequently Asked Questions, U.S. Energy Information Administration, last updated December 11, 2024, https://www.eia.gov/tools/faqs/faq.php?id=74&t=11.
- See Jonathan Lesser, Green Hydrogen: A Multibillion-Dollar Energy Boondoggle (The Manhattan Institute, 2024), https://manhattan.institute/article/green-hydrogen-a-multibillion-dollar-energy-boondoggle.
- Lucas Desport et al., “Deploying Direct Air Capture at Scale: How Close to Reality?,” Energy Economics 129 (January 2024): 107244, https://doi.org/10.1016/j.eneco.2023.107244. Table 1 summarizes existing studies for thermal and electric energy consumption. See also National Academies of Sciences, Engineering, and Medicine, Negative Emissions Technologies and Reliable Sequestration: A Research Agenda (The National Academies Press, 2019), https://doi.org/10.17226/25259, which shows a full range of between 536 kWh/tonne and 6,414 kWh/tonne, based on varying parameters. The lowest energy requirement for fans, based on a low-value pressure drop of 300 Pa, is 22 kWh/tonne. This value is below the theoretical minimum energy requirement for a facility that removes 1 million tonnes of CO2 annually. Figure 3, therefore, reflects the National Academies’ mid-range values.
- Calculated using data from U.S. Energy Information Administration, “Table 2.1. Number of Ultimate Customers Served by Sector, by Provider, 2014 through 2024,” Electric Power Annual 2024, released October 16, 2025, https://www.eia.gov/electricity/annual/table.php?t=epa_02_01.html; and U.S. Energy Information Administration, “Table 2.2. Sales and Direct Use of Electricity to Ultimate Customers by Sector, by Provider, 2014 through 2024 (Megawatthours),” Electric Power Annual 2024, released October 16, 2025, https://www.eia.gov/electricity/annual/table.php?t=epa_02_02.html.
- Jay Fuhrman et al., “The Role of Direct Air Capture and Negative Emissions Technologies in the Shared Socioeconomic Pathways Towards +1.5˚C and +2˚C Futures,” Environmental Research Letters 16 (November 2021): 114012, https://doi.org/10.1088/1748-9326/ac2db0. The authors assume that the energy requirement for solid absorbent DAC decreases from 1,528 kWh/tonne in 2020 to 694 kWh/tonne by 2030. The basis for that assumed improvement in efficiency is not specified. As Desport et al. note, some estimates are unclear as to whether they include the energy for compression of the captured CO2. For their economic analysis, they assume 1,200 kWh/tonne of electricity use, which is approximately equal to the average estimated electricity consumption of the Climeworks Gen 3 solid DAC process.
- Based on the low-end value from Ozkan, “Atmospheric Alchemy.”
- Based on the high-end value from National Academies, Negative Emissions Technologies.
- In fact, a value of 1,200 kWh/tonne is considered optimistic. See, e.g., Howard Herzog et al., “Getting Real About Capturing Carbon from Air,” One Earth 7, no. 9 (2024): 1077–1080, https://doi.org/10.1016/j.oneear.2024.08.011.
- U.S. Energy Information Administration, “Table 5.4.A. Sales of Electricity to Ultimate Customers by End-Use Sector, by State, November 2025 and 2024 (Thousand Megawatthours),” Electric Power Monthly, November 2025, released January 26, 2026, https://www.eia.gov/electricity/monthly/epm_table_grapher.php?t=table_5_04_a.
- Herzog et al., “Getting Real About Capturing Carbon.”
- U.S. Energy Information Administration, “Table 1.1. Net Generation by Energy Source: Total (All Sectors), 2015—November 2025 (Thousand Megawatthours),” Electric Power Monthly, November 2025, released January 26, 2026, https://www.eia.gov/electricity/monthly/epm_table_grapher.php?t=table_1_01.
- No resource is truly zero carbon because CO2 is released to mine and process the raw materials needed, as well as during the manufacturing and construction processes.
- U.S. Energy Information Administration, “Table 4.08.B. Capacity Factors for Utility Scale Generators Primarily Using Non-Fossil Fuels,” Electric Power Annual 2024, released October 16, 2025, https://www.eia.gov/electricity/annual/html/epa_04_08_b.html.
- Calculated as (1,000 MW) × (8760 hours/year) × 0.90 = 7.884 × 10⁶ MWh.
- U.S. Energy Information Administration, “Table 6.2.A. Net Summer Capacity of Utility Scale Units by Technology and by State, November 2025 and 2024 (Megawatts),” Electric Power Monthly, November 2025, released January 26, 2026, https://www.eia.gov/electricity/monthly/epm_table_grapher.php?t=table_6_02_a.
- U.S. Energy Information Administration, “Table 4.08.B.”
- Still more battery storage is required to overcome wind droughts, which can last for days.
- Isaac Orr et al., The Staggering Costs of New England’s Green Energy Policies (Always On Energy Research, 2024), https://www.aoenergy.org/wp-content/uploads/2025/05/12.3.2024-The-Staggering-Costs-of-New-Englands-Green-Energy-Policies.pdf; and Jonathan Lesser and Mitchell Rolling, Batteries and the Grid: Hype, Hope, and Economic Reality (National Center for Energy Analytics, forthcoming).
- U.S. Energy Information Administration, “Preliminary Monthly Electric Generator Inventory (Based on Form EIA-860M as a Supplement to Form EIA-860),” Electricity Analysis & Projections, released January 26, 2026, https://www.eia.gov/electricity/data/eia860M/.
- U.S. Energy Information Administration, Capital Cost and Performance Characteristics for Utility-Scale Electric Power Generating Technologies (U.S. Energy Information Administration, 2024), 63, https://www.eia.gov/analysis/studies/powerplants/capitalcost/pdf/capital_cost_AEO2025.pdf.
- U.S. Energy Information Administration, Capital Cost and Performance Characteristics, 63.
- See, e.g., Montana Department of Revenue, 2025 Capitalization Rate Study: Electric Utilities (Montana Department of Revenue, 2025), https://revenuefiles.mt.gov/files/DOR-Publications/Capitalization-Rate-Studies/2025/2025-Capitalization-Rate-Electric-Utilities.pdf.
- For example, for an asset that is depreciated over 50 years, at a weighted average cost of capital (WACC) of 7.0%, the returns earned each year on the undepreciated original cost of the asset will exceed the asset’s original cost. Specifically, if an asset has an original cost C and is depreciated over T years, then the total finance charges paid will equal ½ × C × WACC × (1+T). If T =50 and WACC = 7.0%, then the finance charges paid will equal C × (0.07) × (25.5) = (1.785) × C. Hence, the finance charge will be 1.785 times larger than the original cost.
- Federal Reserve Bank of St. Louis, “Market Yield on U.S. Treasury Securities at 30-Year Constant Maturity, Quoted on an Investment Basis (DGS30),” Federal Reserve Economic Data, accessed February 3, 2026, https://fred.stlouisfed.org/series/DGS30.
- For example, American Society of Civil Engineers, “Energy,” in 2025 Report Card for America’s Infrastructure (American Society of Civil Engineers, 2025), https://infrastructurereportcard.org/wp-content/uploads/2025/03/Energy.pdf. Estimated spending on new transmission lines would total $121 billion just for the years 2023 through 2026.
- Paul Denholm et al., Land-Use Requirements of Modern Wind Power Plants in the United States, Technical Report NREL/TP-6A2-45834 (National Renewable Energy Laboratory, 2009), http://www.nrel.gov/docs/fy09osti/45834.pdf.
- Keith et al., “A Process for Capturing CO2.” See also Robert F. Service, “Cost Plunges for Capturing Carbon Dioxide from the Air,” Science, June 7, 2018, https://www.science.org/content/article/cost-plunges-capturing-carbon-dioxide-air.
- National Academies, Negative Emissions Technologies. The study assumes a DAC plant life of 30 years. However, most other assessments assume a plant life of only 20 years. See Victor Eke et al., “A Comprehensive Review of Life Cycle Assessments of Direct Air Capture and Carbon Dioxide Storage,” Sustainable Production and Consumption 55 (2025): 217–241, https://doi.org/10.1016/j.spc.2025.02.017. Table 3 of this article provides lists references with assumed DAC facility lifetimes.
- Julia Attwood, “Occidental’s Big Buy May Change Course of $150 Billion Market,” BloombergNEF, August 28, 2023, https://about.bnef.com/insights/industry-and-buildings/occidentals-big-buy-may-change-course-of-150-billion-market/. In 2023, Occidental Petroleum acquired Carbon Engineering.
- Shelby Webb, “Occidental Updates Plan for World’s Largest CO2 Trap,” E&E News, August 9, 2024, https://www.eenews.net/articles/occidental-updates-plan-for-worlds-largest-co2-trap/.
- Sasha Ranesvska, “With A $415M Funding, Origis Energy Will Complete Its Solar Energy Site to Power STRATOS,” Carbon Herald, January 10, 2025, https://carbonherald.com/with-a-415m-funding-origis-energy-will-complete-its-solar-energy-site-to-power-stratos/. Origis Energy built a $290 million, 145-MW alternating current solar photovoltaic facility to power the Stratos plant. There is no publicly available information on accompanying battery storage or if the Stratos plant will be interconnected to the electric grid.
- Katrin Sievert et al., “Considering Technology Characteristics to Project Future Costs of Direct Air Capture,” Joule 8 (April 2024): 979–999, https://doi.org/10.1016/j.joule.2024.02.005. They estimate a range of capital costs between $225/tonne and $835/tonne. See also Desport et al., “Deploying Direct Air Capture”; and Herzog et al., “Getting Real About Capturing Carbon.”
- [1] Noah McQueen et al., “Natural Gas vs. Electricity for Solvent-Based Direct Air Capture,” Frontiers in Climate 2 (2020): 618644, https://doi.org/10.3389/fclim.2020.618644.
- At McQueen et al.’s assumed 8.5% weighted average cost of capital, the capital recovery factor for a 20-year plant is 0.1057 versus 0.0856 for a 60-year plant.
- This is similar to claims that wind and solar generating costs would fall for the foreseeable future. Instead, costs have increased because of rising materials and financing expenses.
- U.S. Environmental Protection Agency (EPA), Report on the Social Cost of Greenhouse Gases: Estimates for Carbon Dioxide, Methane, and Nitrous Oxide (EPA, 2023), https://www.epa.gov/system/files/documents/2023-12/epa_scghg_2023_report_final.pdf.
- [1] Interagency Working Group on Social Cost of Greenhouse Gases, Technical Support Document: Social Cost of Carbon, Methane, and Nitrous Oxide Interim Estimates Under Executive Order 13990 (United States Government, 2021), https://bidenwhitehouse.archives.gov/wp-content/uploads/2021/02/TechnicalSupportDocument_SocialCostofCarbonMethaneNitrousOxide.pdf.
- Frances C. Moore et al., “Synthesis of Evidence Yields High Social Cost of Carbon Due to Structural Model Variation and Uncertainties,” Proceedings of the National Academy of Sciences 121, no. 52 (2024): e2410733121, https://doi.org/10.1073/pnas.2410733121.
- The SCC estimates are themselves problematic, with the most recent models forecasting out 300 years. For a discussion, see Jonathan Lesser, “The Social Cost of Carbon Should Not Be Used for Making Policy Decisions,” Journal of Advance Research in Food, Agriculture, and Environmental Science 11, no. 1 (September 2025): 26–42, https://nnpub.org/index.php/FAES/article/view/3011.
- Labanya Prakash Jena and Prasad Thakur, “Direct Air Capture: How to Accelerate This Technology to Limit Global Warming” World Economic Forum, October 5, 2023, https://www.weforum.org/stories/2023/10/accelerating-direct-air-capture-technology-global-warming/; and James Mulligan et al., “CarbonShot: Federal Policy Options for Carbon Removal in the United States,” Working Paper, World Resources Institute, January 31, 2020, https://www.wri.org/research/carbonshot-federal-policy-options-carbon-removal-united-states.
- Energy Institute, 2025 Statistical Review of World Energy, 74th ed. (Energy Institute, 2025), 16, https://www.energyinst.org/statistical-review.
- “Global Carbon Budget 2025,” Global Carbon Project, University of Exeter, and GreenFutures, 2026, https://globalcarbonbudget.org/gcb-2025/.
- “Global Carbon Budget 2025.”
- The IPCC estimates of climate sensitivity have been challenged as too high. However, a discussion of those challenges is beyond the scope of this report. For interested readers, see, e.g., Vincent T. Cooper et al., “Last Glacial Maximum Pattern Effects Reduce Climate Sensitivity Estimates,” Science Advances 10, no. 16 (2024): eadk9461, https://doi.org/10.1126/sciadv.adk9461; and Antero Ollila, “Challenging the Greenhouse Effect Specification and the Climate Sensitivity of the IPCC,” Physical Science International Journal 22, no. 2 (2019): PSIJ.49095, https://doi.org/10.9734/psij/2019/v22i230127.
- [1] The calculations can be found in appendix 1. Although some scientists challenge the entire concept of an overall average world temperature as meaningless, a discussion of that issue is beyond the scope of this report.
- [1] Chris Hewitt, “State of the Global Climate: Annual and Decadal Updates by WMO,” presented at the Seventeenth Meeting of the Research Dialogue, United Nations Framework Convention on Climate Change, Bonn, Germany, June 17, 2025, https://unfccc.int/sites/default/files/resource/RD17_State_of_the_Global_Climate_Annual_and_decadal_updates_by_WMO_ChrisHewitt.pdf.
- “MAGICC (Model for the Assessment of Greenhouse Gas Induced Climate Change),” Integrated Assessment Modeling Consortium, 2022, accessed January 20, 2026, https://magicc.org/.
- “Climate Model: Temperature Change (RCP 4.5)—2006–2100,” Science on a Sphere, National Oceanic and Atmospheric Administration, released November 17, 2013, https://sos.noaa.gov/catalog/datasets/climate-model-temperature-change-rcp-45-2006-2100/.
- Herzog et al., “Getting Real About Capturing Carbon.”
- “International Data,” U.S. Energy Information Administration, accessed February 3, 2026, https://www.eia.gov/international/data/world.
- “International Data.”
- “International Data.”
- “Renewable Energy Materials Properties Database (REMPD),” U.S. Department of Energy, accessed January 21, 2026, https://apps.openei.org/REMPD/.
- Jack Suter et al., Carbon Capture, Transport, and Storage: Supply Chain Deep Dive Assessment (U.S. Department of Energy, 2022), https://www.energy.gov/sites/default/files/2024-12/Carbon%2520Capture%2520Supply%2520Chain%2520Report%2520-%2520Final%25202.25.25%5B1%5D.pdf.
- “Lake Nyos Disaster: August 21, 1986,” Fishwrap (Newspapers.com blog), August 1, 2018.
- Richa Shukla et al., “A Review of Studies on CO2 Sequestration and Caprock Integrity,” Fuel 89, no. 10 (October 2010): 2651–2664, https://doi.org/10.1016/j.fuel.2010.05.012; and Roger Aines et al., “Quantifying the Potential Exposure Hazard Due to Energetic Releases of CO2 from a Failed Sequestration Well,” Energy Procedia 1, no. 1 (2009): 2421–2429, http://dx.doi.org/10.1016/j.egypro.2009.02.003.
- The methodology to calculate government financing costs is presented in appendix 2.
- “Air—Molecular Weight and Composition,” The Engineering ToolBox, accessed February 3, 2026, https://www.engineeringtoolbox.com/molecular-mass-air-d_679.html.
- For a discussion, see, e.g., Delmar Larson et al., Physical Chemistry (LibreText, 2026), https://chem.libretexts.org/Bookshelves/Physical_and_Theoretical_Chemistry_Textbook_Maps/Physical_Chemistry_(LibreTexts).
- Keith et al., “A Process for Capturing CO2.” The authors calculate the pressure drop for a specific carbon engineering system at between 106 and 141 Pa and the total energy required for the fans of 61 kWh/tonne of CO2.
- To measure the power when the pressure drop is given in pounds per square inch (psi), the formula can be modified as [Airflow (m3/sec) × Pressure Drop (psi)] / [Fan Efficiency (%) × 307.15].
- See Larson, et al., Physical Chemistry for a discussion.
- Larson et al., Physical Chemistry.
- Larson et al., Physical Chemistry.
- See note 14, supra.
- Gunnar Myhre et al., “New Estimates of Radiative Forcing Due to Well-Mixed Greenhouse Gases,” Geophysical Research Letters 25 (1998): 2715–2718, https://doi.org/10.1029/98GL01908.
- Intergovernmental Panel on Climate Change, Climate Change 2021—The Physical Science Basis. Contribution of Working Group I to the Sixth Assessment Report of the Intergovernmental Panel on Climate Change (Cambridge: Cambridge University Press, 2023), table 7.10, https://doi.org/10.1017/9781009157896.
- “The Federal Government Has Borrowed Trillions.Who Owns All That Debt?,” Peter G. Peterson Foundation, last updated January 21, 2026, https://www.pgpf.org/blog/2023/05/the-federal-government-has-borrowed-trillions-but-who-owns-all-that-debt. [
- Erica York, “Summary of the Latest Federal Income Tax Data, 2025 Update,” Tax Foundation, November 18, 2024, https://taxfoundation.org/data/all/federal/latest-federal-income-tax-data-2025/.