What’s Driving Higher Retail Electric Rates?
The Issue
It’s no secret that retail electricity rates have been rising in the U.S. The causes, however, are disputed. A recent study by Bloomberg, for example, claimed that increased electricity consumption by data centers is driving up residential electric bills, based on an analysis of price increases at wholesale pricing “nodes” near data centers.1 (Nodes are individual locations where electricity is physically delivered to a consumer or received from a generator.)
An article in RealClearEnergy claims that higher prices are driven by a long-standing “cost-of-service” regulatory framework that provides electric utilities with a “guaranteed” return on investment. It recommends adopting an alternative framework that emphasizes performance and market competition for investment dollars.2
Still other studies have claimed that increasing retail prices are being driven by subsidized wind and solar generation,3 a claim that is vigorously disputed by wind and solar advocates.4 Another recent article claims that retail electricity prices have generally tracked inflation and that wind and solar power development had no discernible impact on retail prices.5
Viewed separately, all of these claims seem reasonable. Data centers gobble lots of electricity. Most electric utilities are regulated under a cost-of-service regime that does encourage greater spending on infrastructure that earns returns for investors. Wind and solar costs can be both higher or lower than other generating resources, depending on which costs are included.6
In reality, the factors contributing to the electric rates paid by individuals and businesses are numerous and interrelated. First, there are the nuts and bolts issues that govern wholesale and retail markets. For example, wholesale electric prices, such as those in the formal markets operated by nonprofit Regional Transmission Organizations (RTOs) such as PJM Interconnection (which covers 13 mid-Atlantic states and the District of Columbia) are affected by the arcane and often changing rules that those RTOs enforce. That’s especially true for so-called capacity markets, which provide generating plant owners with revenues for being available when needed. The rates paid by residential, commercial, and industrial customers depend on how electric utilities’ fixed costs—i.e., the costs that must be paid regardless of how much electricity consumers use—are allocated among them. These methodologies are also arcane.7 Allowed returns on utilities’ capital investment—they are not guaranteed, as some claim8—are also set by regulators using different methodologies and assumptions. Moreover, state regulators use different methods to regulate electric rates; most are cost-based, but some require that utilities meet specific performance targets
Second, broader policy issues, such as state mandates for increasing renewable generating capacity or reducing greenhouse gas emissions, affect electric prices. Additionally, state and federal subsidies, not only for renewable generation but also for nuclear plants, influence these prices. Environmental regulations and restrictions on siting new infrastructure—whether high-voltage transmission lines or new natural gas pipelines that deliver supplies to natural gas-fired generating plants—affect generating costs.9
Teasing out the impacts of each of these factors separately is a Herculean task and would require an issue book, not an issue brief. Here we focus on one factor that the price increase debaters appear to have ignored and that is fundamental to electricity prices: the supply of generating resources.
The Missing Link
The following two charts set the stage. Figure 1 shows the percentage change in average residential rates by state between the first quarter of 2010 and the second quarter of 2025. As shown, the price changes ranged from 0% in Nevada to 127% in California. The average for the U.S. was about 63%. Interestingly, some of the states with higher percentage increases over the past 15 years are not the same as the states with the highest actual residential rates, as shown in figure 2.
Figure 1. Percentage Change in Average Residential Electric Prices, Q1 2010–Q2 2025
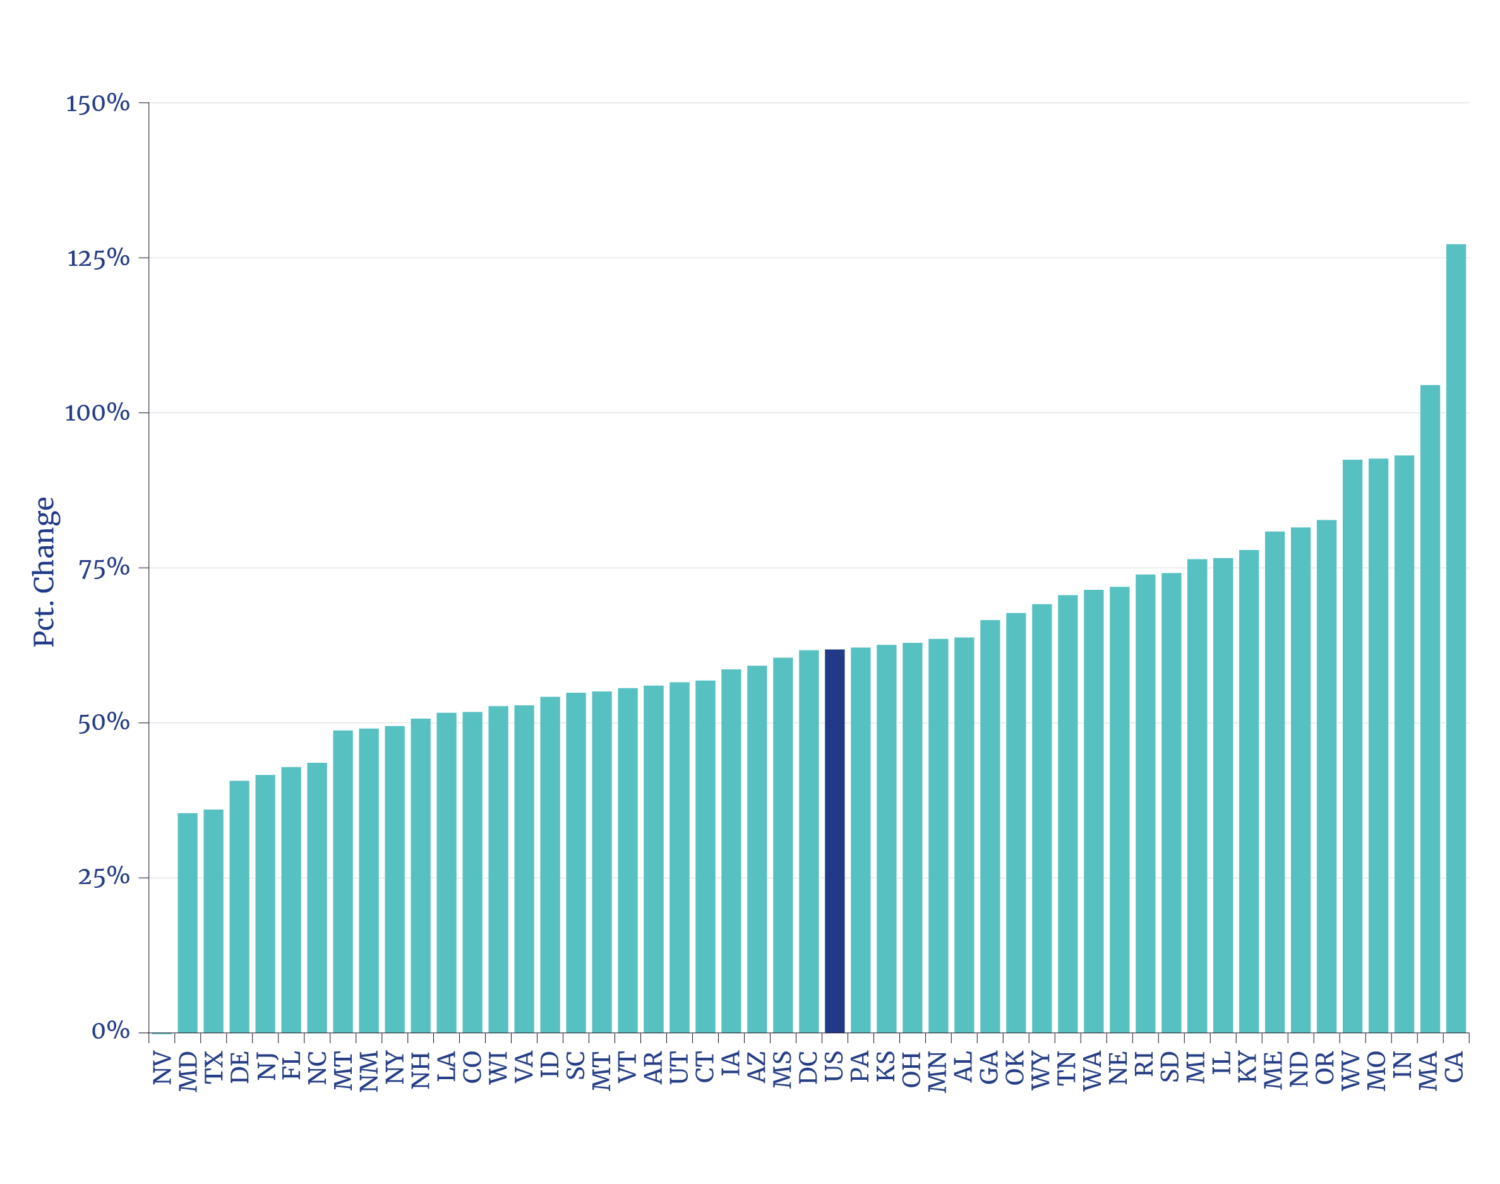
Figure 2. Average Residential Electric Prices, Q2 2025
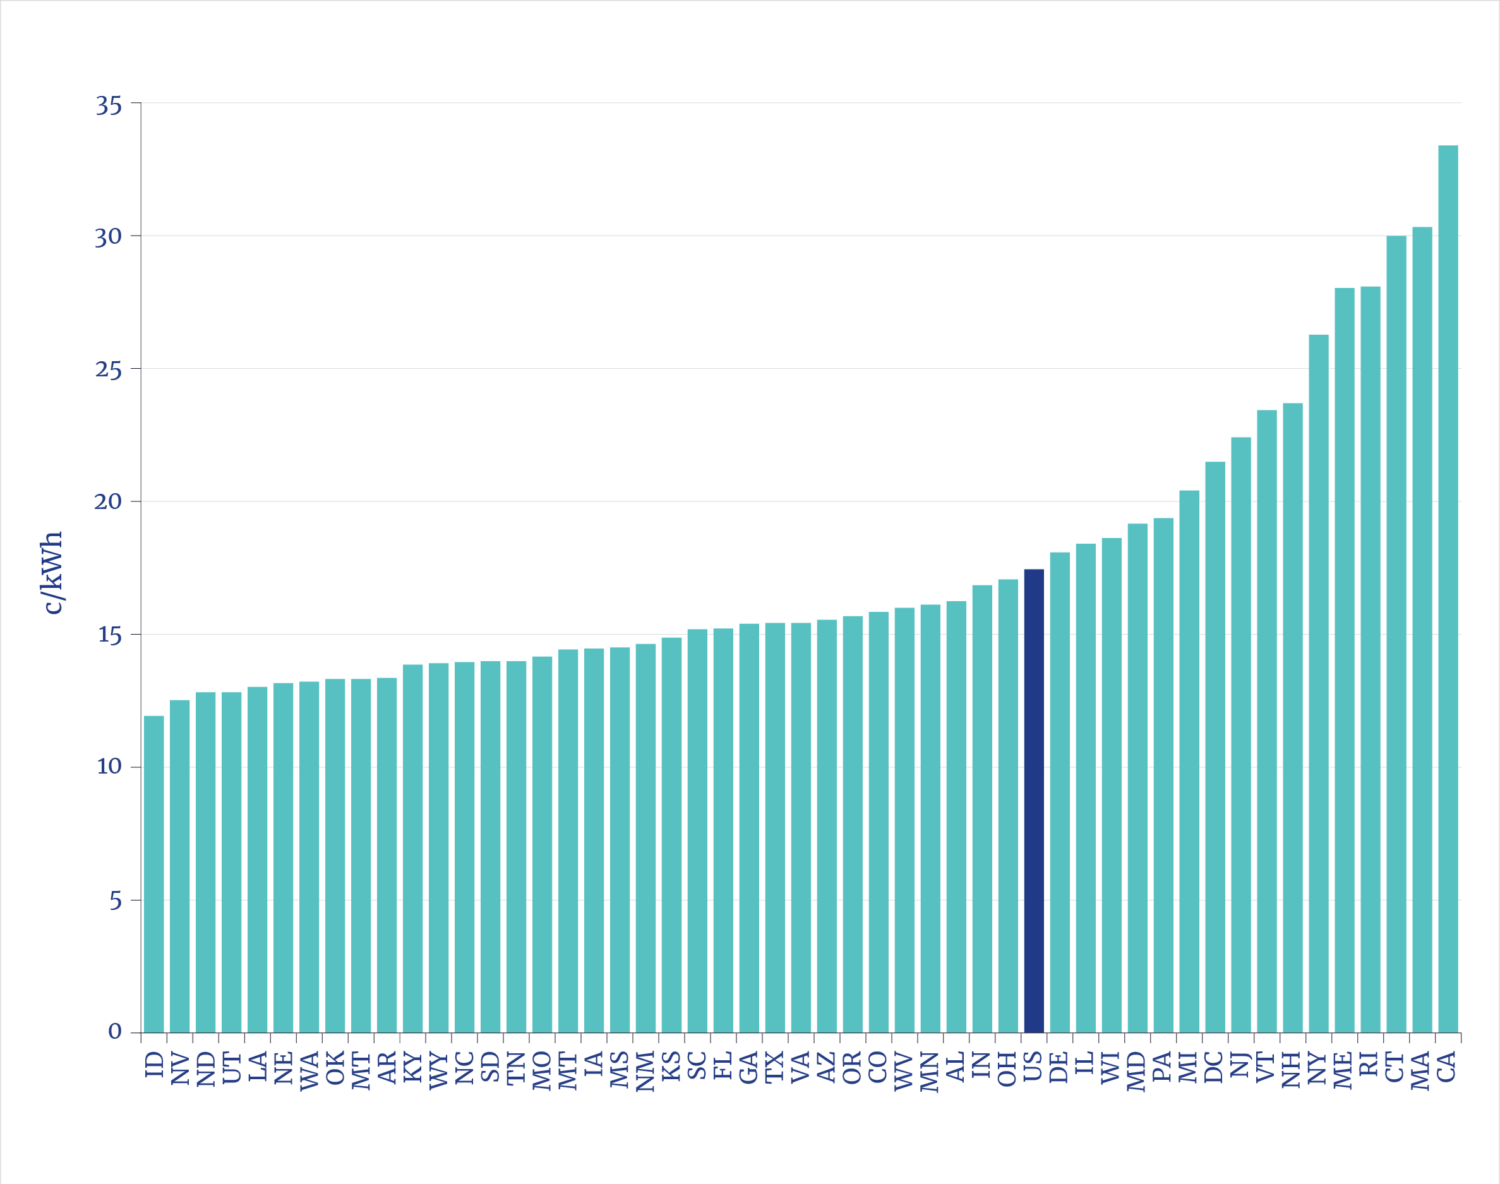
Residential prices in West Virginia, for example, increased more than 90% over the past 15 years but are still lower than the overall U.S. average. Residential customers in New York state, however, experienced an increase of just 50% over the previous 15 years. Yet they now pay some of the highest rates in the country. Notably, residential customers in Massachusetts and California have experienced the most significant percentage increases in their rates and pay the highest average rates. Thus, while electric rates have increased, the impacts have not been uniform.
The argument that data centers are causing a rapid increase in average rates is also not supported by the evidence. Virginia, for example, has a high concentration of data centers. Yet residents of that state have experienced below-average price increases and still pay below-average rates. Similarly, Virginia’s electric utilities remain vertically integrated and thus earn a rate of return on investment set by regulators on their generating plants. Massachusetts, however, deregulated its electric industry many years ago, forcing utilities to divest their generating assets and allowing customers to choose their electricity suppliers in a competitive market.10
Nor is increasing electricity demand from data centers and other customers necessarily driving state increases. In California, for example, sales through July 2025 were lower than those of the first seven months of 2024, whereas in Virginia, sales were almost 3.5% greater.11 (In fact, lower sales can lead to higher average prices because electric utilities’ relatively large percentage of fixed costs is recovered across fewer kilowatt-hours.)
The Impacts of a Changing Generating Capacity Mix
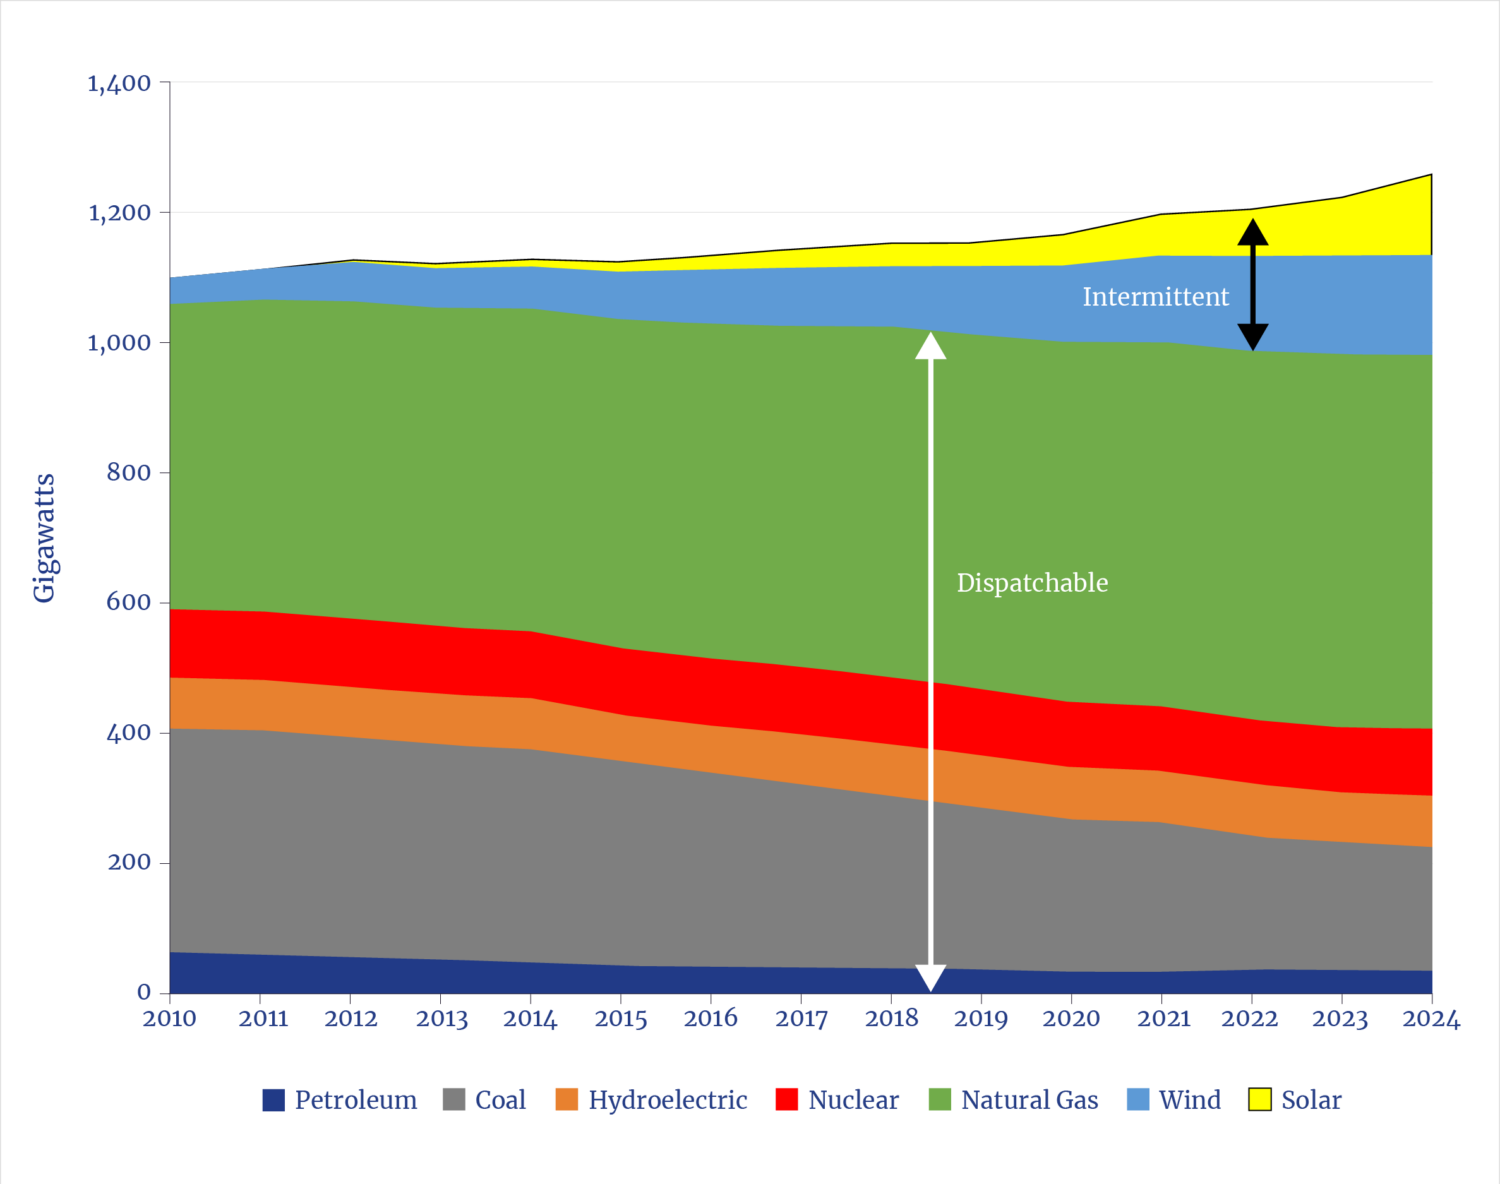
Between 2010 and 2024, U.S. generating capacity increased by about 200 gigawatts (GW), or just over 16%, from about 1,140 GW to 1,325 GW (see figure 3). Over the same period, total retail sales of electricity increased by just 5%, from 3,755 gigawatt-hours (GWh) to 3,962 GWh.12 Hence, at first glance, it would appear that generating capacity growth has outpaced growth in demand. However, the growth in total generating capacity belies the loss of existing dispatchable fossil fuel and nuclear generation, and its replacement by wind and solar. Total dispatchable capacity fell by about 80 GW, while intermittent (and subsidized) wind and solar increased almost sevenfold, from 40 GW in 2010 to 278 GW in 2024.
This pattern has continued this year. Between January and July 2025, over 1,900 megawatts (MW) of fossil-fuel generation were retired.13 For the remainder of this year, another 3,450 MW of coal-fired generators are scheduled to retire along with about 4,400 MW of gas-fired generators. An additional 6,750 MW of coal-fired and 4,000 MW of gas-fired generators are scheduled to retire in 2026.14 Hence, in 2025 and 2026, more than 20,000 MW of existing fossil-fuel generators are expected to be retired, replaced almost exclusively by intermittent wind and solar generators, along with some battery storage.
Figure 3. Dispatchable and Non-Dispatchable Generating Capacity, 2010–2024
The loss of dispatchable generating capacity is the result of several factors. First, some states have forced generators to close prematurely. For example, the state of New Jersey effectively forced the retirement of the 625-MW Oyster Creek Nuclear Station in 2018 by requiring the plant to install cooling towers, which its owner, Exelon Generation, estimated would cost $800 million.15 Ironically, when the plant was first built, New Jersey environmental regulators prohibited the plant from installing cooling towers because they were deemed too costly.16 Similarly, citing safety concerns in 2017, then– Governor of New York Andrew Cuomo pressured Entergy Corporation to shutter the Indian Point Nuclear Station in 2021, which had provided up to 25% of New York City’s electricity.
Other states have forced the closure of coal and natural gas generators. Many states have legislated 100% “zero-emissions” electricity generation as soon as 2035.17 In states that have not enacted rules forcing plant closures, poor economic conditions driven by increasingly strict environmental regulations have caused premature retirements. In 2024, for example, the U.S. Environmental Protection Agency (EPA) finalized rules that would have forced most coal plants to retire by 2032.18 Under the Trump administration, however, the EPA is in the process of rescinding those rules, as well as more stringent standards for vehicle emissions.19
The loss of dispatchable generating capacity and its replacement with intermittent wind and solar is one factor contributing to higher electric rates, despite arguments that categorizing generators this way is incorrect.20 In effect, the argument is that wholesale markets “choose” wind and solar generation, as well as battery storage, because their output is the lowest cost when the grid needs electricity. Wind and solar advocates also point out that some states with large quantities of wind and solar generation, such as Iowa, have relatively low retail electric rates. Hence, it cannot be the case that increasing wind and solar generation is causing higher retail electric rates.21
These arguments are simplistic and misleading. Most utility-scale wind and solar facilities have benefited from generous federal tax credits and state mandates that require an increasing proportion of the electricity local utilities need to meet customer demand to come from these resources. The subsidies, especially the federal production tax credit (PTC), distort wholesale electric markets. The PTC, which is currently $27.50 per megawatt-hour (MWh),22 allows wind and solar owners to bid at below-zero prices and still be profitable. When they supply more generation than what is consumed, wholesale market-clearing prices can be negative, which force baseload generators that cannot be cycled on and off to pay to continue delivering electricity to the grid.
This is a market distortion that has adverse impacts. First, it reduces the competitiveness of unsubsidized generators because, but for the subsidies, total electricity supplied would be lower and market prices would be higher. Second, artificially lowering wholesale market prices force otherwise competitive but unsubsidized generation out of the market, which I have previously termed Gresham’s Law of Green Energy.23
Some wholesale markets, such as those operated by PJM, the New York State Independent System Operator (ISO), and ISO New England also have established “capacity” markets. These are administratively created markets that establish a separate value for the availability of generating capacity when it is needed, in effect placing a value on “iron in the ground.” However, intermittent resources like wind and solar, by their nature, cannot always be available when needed. In its July 2024 auction, for example, PJM’s capacity market-clearing prices jumped almost tenfold, from $29/MW-day to $270/MW-day,24 reflecting increasing demand but less dispatchable generating capacity.25 In its July 2025 auction, prices rose still further to $329/MW-day.26 These increased wholesale prices contribute to higher retail prices.
The intermittency of wind and solar generation can be addressed to some extent by adding battery storage to the grid. But battery storage is costly. Moreover, wind and solar do not provide other key attributes needed to maintain reliable electricity, such as inertia and reactive power.27 Thus, wholesale market operators such as PJM must incur additional costs to supply these necessary components.
Perspective
There is no single factor that can explain all the increases in all electric utilities’ retail electric rates over the past few years. The rates retail customers pay for electricity depend on numerous factors, some of which are market-based, while others are specific to individual state regulators. There is no doubt, however, that the loss of dispatchable generating capacity is contributing to higher electric rates.
The effects are most clearly seen in the rapid increase in capacity market payments, which are designed to reward availability and dispatchability. But higher capacity market prices are not the only evidence. The growing instability of wholesale energy markets, caused by subsidized wind and solar, is driving out dispatchable generators. Additionally, short-sighted efforts by policymakers to mandate zero-emissions electricity, often justified to address climate change, will have no measurable impact on the world’s climate.
The “grid transformation” envisioned by wind and solar proponents will not take place if it results in unaffordable and unreliable electricity. Storage batteries to correct for wind’s and solar’s inherent intermittency are too costly. Moreover, the quantities of storage that would be required are unrealistic and likely physically impossible to develop.28 These realities are likely why owners of data centers increasingly seek to rely on nuclear, natural gas, and even coal generation for their growing electricity requirements. If wind-solar-battery systems were a less costly alternative, they would surely rely on those.
Endnotes
- Josh Saul et al., “AI Data Centers Are Sending Power Bills Soaring,” Bloomberg, Sept. 29, 2025.
- Jordan McGillis, “Capital Markets Can Solve Surging Power Prices,” RealClear Energy, Oct. 9, 2025.
- See, for example, Bjorn Lomborg, “Solar and Wind Power Are Expensive,” Financial Post, Mar. 25, 2025.
- Saied Dardour, Deborah Ayres, and Lourdes Zamora, “Renewable Power Generation Costs in 2024,” International Renewable Energy Agency (IRENA), July 2025.
- Ryan Wiser et al., “Factors Influencing Recent Trends in Retail Electricity Prices in the United States,” The Electricity Journal 38, no. 4 (December 2025) 10576.
- International Energy Agency, World Energy Outlook 2023.
- National Association of Regulatory Utility Commissioners (NARUC), “Electric Utility Cost Allocation Manual,” June 1992, has the gory details.
- Two seminal U.S. Supreme Court cases—Bluefield Water Works v. Public Service Commission of W. Virginia, 262 U.S. 679 (1923) and Federal Power Commission v. Hope Natural Gas, 320 U.S. 591 (1944)—established the legal guidelines that apply today. For a discussion, see Jonathan Lesser and Leonardo Giacchino, Fundamentals of Energy Regulation, 3d ed. (Regulatory Economics Publishing, 2024).
- Electric rates in California are also increasing because of efforts to reduce damages from wildfires by relocating underground large portions of local distribution systems, as well as some high-voltage transmission lines.
- Massachusetts Dept. of Public Utilities, Monthly Monitor #3, February 2002.
- EIA, Electricity Data Browser, Retail Sales of Electricity.
- Ibid.
- EIA, Electric Power Monthly, Oct. 24, 2025, Table 6.4.
- Ibid, Table 6.6.
- EIA, Today in Energy, “America’s Oldest Operating Nuclear Power Plant to Retire on Monday,” Sept. 14, 2018.
- World Nuclear News, “Cooling Tower Requirement for Oyster Creek,” Jan. 8, 2010
- CleanEnergy States Alliance, “Table of 100% Clean Energy States.” Washington D.C. has a mandate of 2032. However, there are no generating plants located there.
- U.S. Environmental Protection Agency (EPA), “Biden-Harris Administration Finalizes Suite of Standards to Reduce Pollution from Fossil Fuel-Fired Power Plants,” Apr.25, 2024. The first Clean Power Plan was adopted in June 2014. It was repealed in 2017. In West Virginia v. EPA (2022), the U.S. Supreme Court limited the EPA’s ability to regulate carbon emissions.
- EPA, “EPA Releases Proposal to Rescind Obama-Era Endangerment Finding, Regulations that Paved the Way for Electric Vehicle Mandates,” July 29, 2025.
- Herman K. Trabish, “Grid Planners and Experts on Why Markets Keep Choosing Renewables,” Utility Dive, Oct. 9, 2025.
- Ibid.
- EPA, “Summary of Inflation Reduction Act provisions related to renewable energy,” July 29, 2025.
- Jonathan Lesser, “Gresham’s Law of Green Energy,” Regulation 33 (Winter 2010–2011), 12–18. See also Lesser, “The High Cost of Low-Value Wind Power,” Regulation 36 (Spring 2013), 22–27. Gresham’s Law is named after the 16th-century financier, Thomas Gresham, who posited that “bad money” would drive out “good money.” For example, if two coins both have a face value of $1, but one is made of copper while the other is made of more valuable gold, then the copper coins will be used in circulation while the gold ones are hoarded.
- A “MW-day” is the price of one MW of capacity for one day. So, if the price is $100/MW-day, then a generator providing 100 MW of capacity for all 365 days of the year would be paid (100) x ($100/MW-day) x (365 days) = $3.65 million.
- Ashley Lawson, “PJM’s Electric Capacity Market: Background and Current Issues,” CRS Report No. R48553, June 2, 2025.
- PJM Interconnection, “PJM Auction Procures 134,311 MW of Generation Resources; Supply Responds to Price Signal,” July 22, 2025. Market-clearing prices are capped at an administratively determined amount. In two constrained regions near Washington, D.C., prices rose to around $450/MW-day.
- A discussion of the physics of how electric grids operate is far beyond the scope of this Issue Brief.
- Mark Mills, “The Hard Math of Minerals,” Issues in Science and Technology, January 27, 2022.
ABOUT THE AUTHOR
Jonathan is the President of Continental Economics with years of experience working and consulting for regulated utilities and government. He has addressed critical economic and regulatory issues affecting the energy industry in the U.S., Canada, and Latin America, including gas and electric utility structure and operations, cost-benefit analysis, mergers and acquisitions, cost allocation and rate design, asset management strategies, cost of capital, depreciation, risk management, incentive regulation, economic impact studies, and general regulatory policy. Jonathan has prepared expert testimony and reports for numerous utility commissions and international regulatory bodies and has testified before Congress and numerous state legislative committees, and also served as arbiter in disputes between regulators and regulated utilities. Jonathan has also designed economic models to value nuclear, fossil fuel, and renewable generating assets. He is the coauthor of three textbooks: Environmental Economics and Policy (Addison Wesley Longman, 1997), Principles of Utility Corporate Finance (Regulatory Economics Publishing, 2011), and the widely used, Fundamentals of Energy Regulation, 3d ed (Regulatory Economics Publishing, 2020), as well as numerous academic and trade press articles. Jonathan was previously an Adjunct Fellow with the Manhattan Institute for Policy Research. He earned a B.S degree in Mathematics and Economics from the University of New Mexico, and M.A. and Ph.D. degrees in Economics from the University of Washington.