Ethanol as Fuel: A Bridge to Nowhere
This shortcoming reflects not technology immaturity but rather fundamental limits of biochemistry and thermodynamics.
Listen

Executive Summary
In the United States, 40% of the corn crop is now dedicated to producing corn ethanol, which displaces only 10.5% of the gallons (7% of the energy) in the nation's gasoline tanks. The federal government has aggressively subsidized and mandated corn ethanol in motor fuel for over 20 years through the Energy Policy Act of 2005; the Energy Independence and Security Act of 2007; and the Renewable Fuel Standard (RFS) program, as implemented by the U.S. Environmental Protection Agency's 2010 final rule. According to the government's own data and models, these measures:
- Converted millions of acres of grassland, wetlands, and fallow Conservation Reserve Program land to intensive cultivation
- Raised food and farming commodity prices due to competition with biofuel agriculture
- Strained freshwater resources from additional consumption and pollution
- Escalated emissions of criteria air pollutants, along with associated damage to human health
- Increased greenhouse gas (GHG) emissions, compared with those of gasoline
- Expanded U.S. gasoline exports to 13 billion gallons per year
This report examines the chemical, physical, historical, and economic reasons for these perverse outcomes.
Originally intended as a temporary bridge to a future of environmentally friendly, low-emission, nonfood crop biofuels grown renewably on uncultivated land, corn ethanol has instead become a multibillion-dollar-per-year subsidy-harvesting operation, sustained by federal fuel-blending consumption mandates and perpetual regulatory exemptions to GHG reduction and pollution emission rules.
America's agricultural-industrial complex is the top consumer of the nation's scarce freshwater resources. It uses 992 gallons of water in producing a single gallon of corn ethanol, which is orders of magnitude higher than the 5.6 gallons per gallon required to produce gasoline. Blending 10% ethanol to make E10 gasoline increases water consumption by a factor of 18, and the E85 fuel blend requires 174 times more freshwater per mile driven than gasoline does.
Beyond water, enormous factory farms and biorefineries are also energy-intensive. Producing a gallon of corn ethanol requires more fossil fuel energy than producing a gallon of gasoline. The amount of net energy delivered to the economy is marginal. The best current estimate of the ratio of corn ethanol's usable energy as fuel and coproducts, compared with the sum of all the energy inputs required to make it-that is, the energy return on investment-is 1.5:1. This is far below the minimum threshold of 6:1 that is needed to sustain the country's energy-intensive economy.
The original goal of RFS was to stimulate innovation that would produce advanced biofuels, including ethanol made from nonfood feedstock such as corn stover-the inedible stalks, leaves, husks, and cobs remaining after harvest. Yet two decades of federal market manipulations and subsidies, together with billions of dollars in private venture capital, have failed to bring any nonfood-based liquid biofuels into sustained industrial-scale production. This shortcoming reflects not technology immaturity but rather fundamental limits of biochemistry and thermodynamics.
In terms of water resources, air quality, net energy contribution, and GHG emissions, corn ethanol has been a step backward. It is past time for the administration and Congress to acknowledge reality, stop subsidizing a program that undermines their own stated policy goals, and move toward alternative policies and spending that genuinely support national energy independence, a cleaner environment, and the American family farmer.
Overview
A chasm often exists between legislative intent and economic reality. In the more than 50 years since the oil price shocks of the 1970s and the beginning of an uninterrupted run of federal and state ethanol-friendly policies, subsidies, and mandates, ethanol has managed to displace only 10.5% of the gallons (7% of the energy) in the nation's gasoline tanks.1 This report explains U.S. bioethanol production, as depicted in figure 1, and the underlying forces that constrain it.
Figure 1 U.S. Bioethanol Production
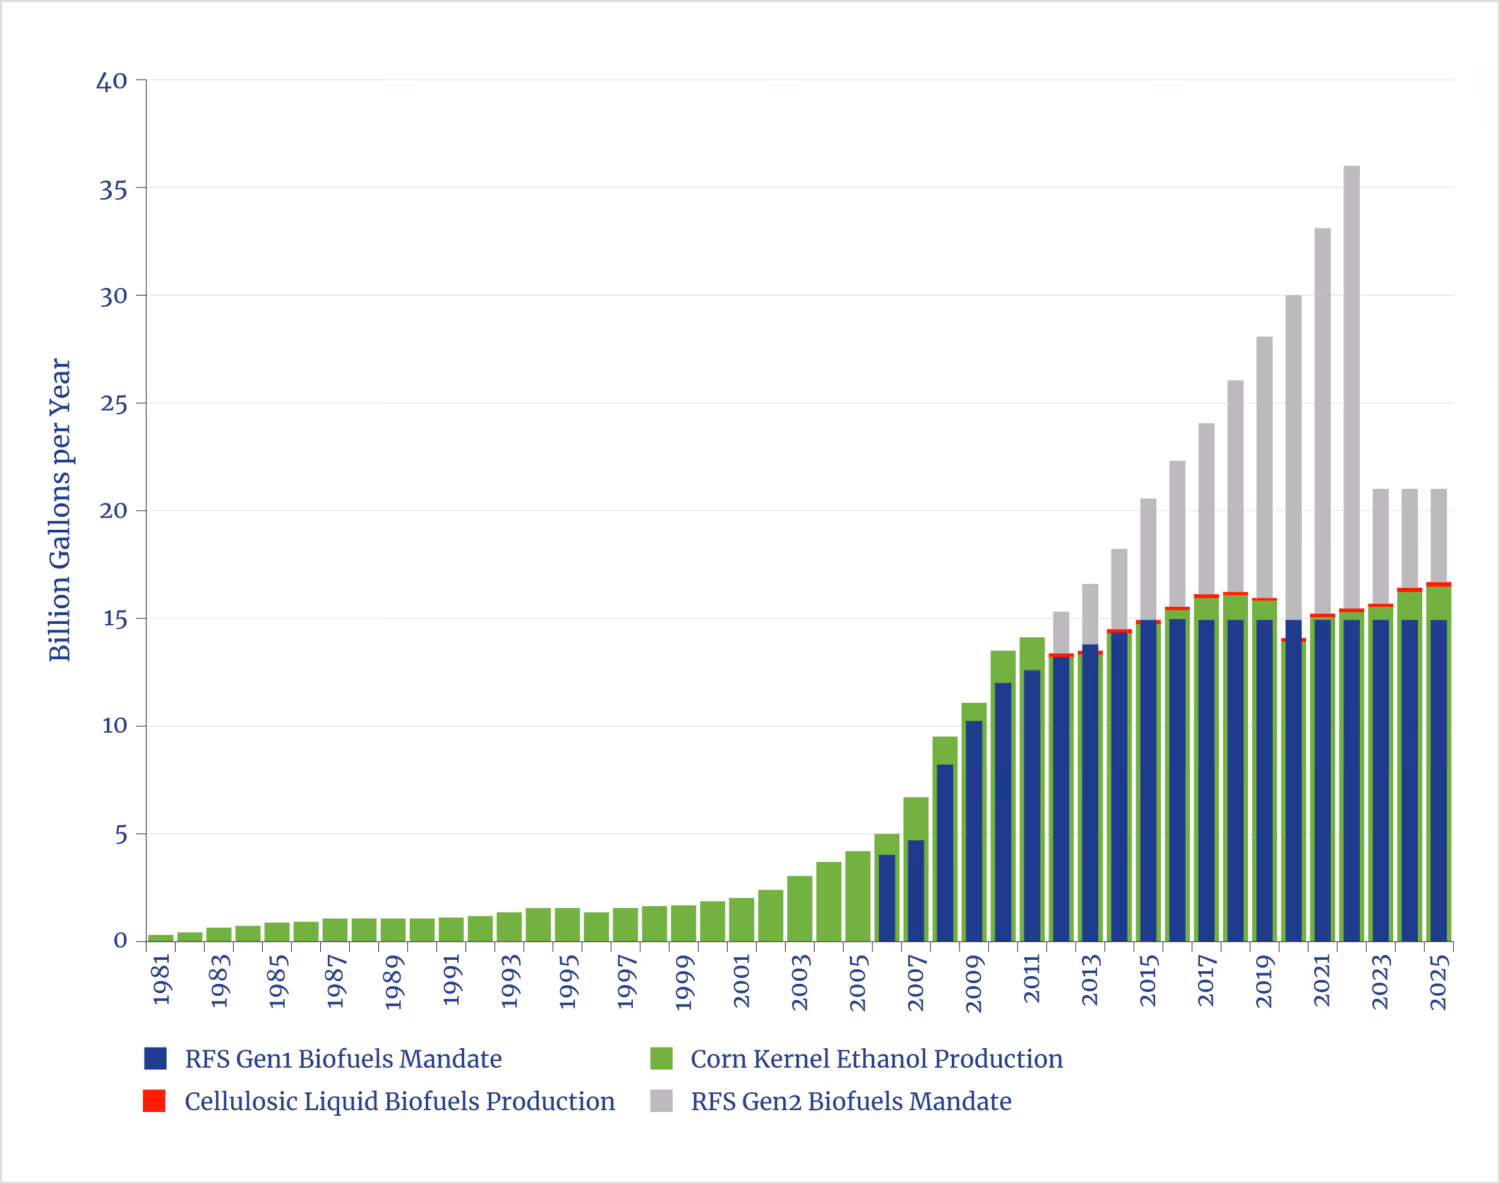
The blue bars superimposed on the graph show the annual quota for billions of gallons of first-generation (food-based) biofuels that must be blended with the nation's refined petroleum supply per the formulas of the Renewable Fuel Standard (RFS) program. RFS was established by congressional direction through the Energy Policy Act of 2005 and the Energy Independence and Security Act of 2007 and enacted by the U.S. Environmental Protection Agency (EPA) via a 2010 final rule.2 The stacked gray bars represent the RFS blending quota for additional billions of gallons per year of advanced second-generation (nonfood-based) renewable fuels3 such as ethanol and renewable gasoline made from wild prairie grasses, forest-floor debris, or inedible residues from food crop cultivation. This is genuinely revolutionary, low-emission, clean, green, and sustainable fuel intended to replace petroleum-the ultimate goal of RFS.
The green bars show total annual gallons of corn ethanol produced from the starch in the food kernel portion of the plant at the nation's nearly 200 biorefineries.4 The graph illustrates approximately linear growth from virtually zero to 4 billion gallons per year in the 25 years from 1981 through 2005, followed by a quick tripling of production during a decade of exponential growth and then a plateau that has endured since 2015. Virtually all first-generation biofuel in the United States is corn starch ethanol. By 2022, Congress anticipated in its statutory RFS quotas that advanced biofuel production-mostly from cellulosic ethanol-would reach 21 billion gallons per year, eclipsing conventional corn starch ethanol production. However, at this graph's scale, the red bars of actual cellulosic ethanol production that fill in the bottom of the gray quota bars are so small as to be essentially invisible-amounting in 2025 to only 0.5% of the volume of corn starch ethanol.5
The early 2000s inflection point in the figure-where conventional corn ethanol production starts its brief exponential rise-coincided with a triple-punch of congressional legislation and EPA rulemaking that favored ethanol's use for gasoline octane boosting, oxygenation, and biofuel blending. The close correspondence between the curves of RFS consumption mandates (shown in blue) and corn ethanol production (in green) illustrates that this federal mandate has had more economic power over ethanol production than anything that preceded it. However, the fact that RFS also appears to be unintentionally operating as a cap on corn ethanol production reveals that ethanol has not yet become competitive without government subsidy. The conspicuous deficit of cellulosic ethanol, despite decades of strong federal financial support and aggressive demand mandates, strongly suggests that something more than economic inertia and technological immaturity is holding it back.
Strong political pressure remains not only to continue the current blending demand mandates but also to increase federal weight on the market scales by revising national gasoline formulations to favor greater ethanol blending and expanding subsidies through provisions of the Inflation Reduction Act (IRA) of 2022. Before continuing on this path, it is prudent to revisit the lessons of history, review the actual intents and assumptions underpinning RFS, and refresh the benefit-cost analysis for ethanol as fuel. As this report demonstrates, corn ethanol remains critically dependent upon government market manipulation and fossil fuel energy inputs, offers insufficient net energy to power the energy-intensive U.S. economy, poses a threat to water security, exacerbates air pollution, and increases greenhouse gas (GHG) emissions rather than reducing them. Before making recommendations about future policy, this report first examines the origins of these present circumstances.
History
Ethanol as Fuel
Harvesting fuel from the land is an idea that dates to the invention of fire. Before the discovery of abundant coal and petroleum, human civilization operated on a renewable-if not always sustainable-economy in which food and fuels coevolved with innovations in agriculture. While the knowledge of fermentation appears to be as old as recorded human history, the distillation of concentrated alcohol from grains seems to have emerged only in more recent centuries.6
By the eighteenth century, many farmers had stills and produced their own lamp oil from pine-resin turpentine, hardwood methanol, and grain ethanol. At the turn of the twentieth century, grain ethanol was commercially produced in the tens of millions of gallons per year as lamp fuel in petroleum-poor Germany and France, both desiring a robust farm economy to support domestic energy production.7 In contrast, ethanol production in the United States was stymied from the American Civil War through World War I by competition from petroleum products: kerosene; casinghead gasoline harvested directly from the oil fields; and, eventually, refined gasoline. Growth to industrial scale was slowed by a federal excise tax on ethanol as high as $2.08 per gallon, imposed from 1862 to 1906, through which the government collected a sizable fraction of its total revenue.8
Government policies notwithstanding, innovators developing internal combustion engines on both sides of the Atlantic Ocean viewed ethanol as a prominent fuel from the start.9 Nikolaus Otto, in 1876, was the first to develop a versatile liquid-fueled internal combustion engine with the power density and efficiency needed for transportation. The design was emulated by Henry Ford (see figure 2) and the Wright brothers to power a fleet of American cars, tractors, and aircraft. Many innovators and economic philosophers, including Ford, shared a vision for eventually pairing these engines with bioethanol fuel to build a circular economy in which machines would cultivate and harvest farm fields to produce their own fuel as a byproduct.10 Yet, 150 years later, ethanol represents only 7.4% of the global fuel market for Otto's engines, with the lion's share fueled by gasoline.11
Figure 2. Henry Ford with 10-Millionth Ford Model T and 1896 Quadricycle: 1924

Ethanol Production in the United States
The United States has produced agriculture-based, fuel-grade ethanol for over a century from a wealth of feedstocks, including those that now dominate around the world: corn and sugarcane. It currently produces more than 16 billion gallons per year-greater than the rest of the world combined (see figure 3). Variations in government policy, popular support, and economic cycles have spawned four distinct U.S. ethanol production surges. The first and third waves coincided with World Wars I and II, peaking at approximately 60 million and 600 million gallons per year, respectively, mostly under U.S. government wartime contracts for ethanol as fuel, octane booster, and precursor chemical for smokeless gunpowder and synthetic rubber.
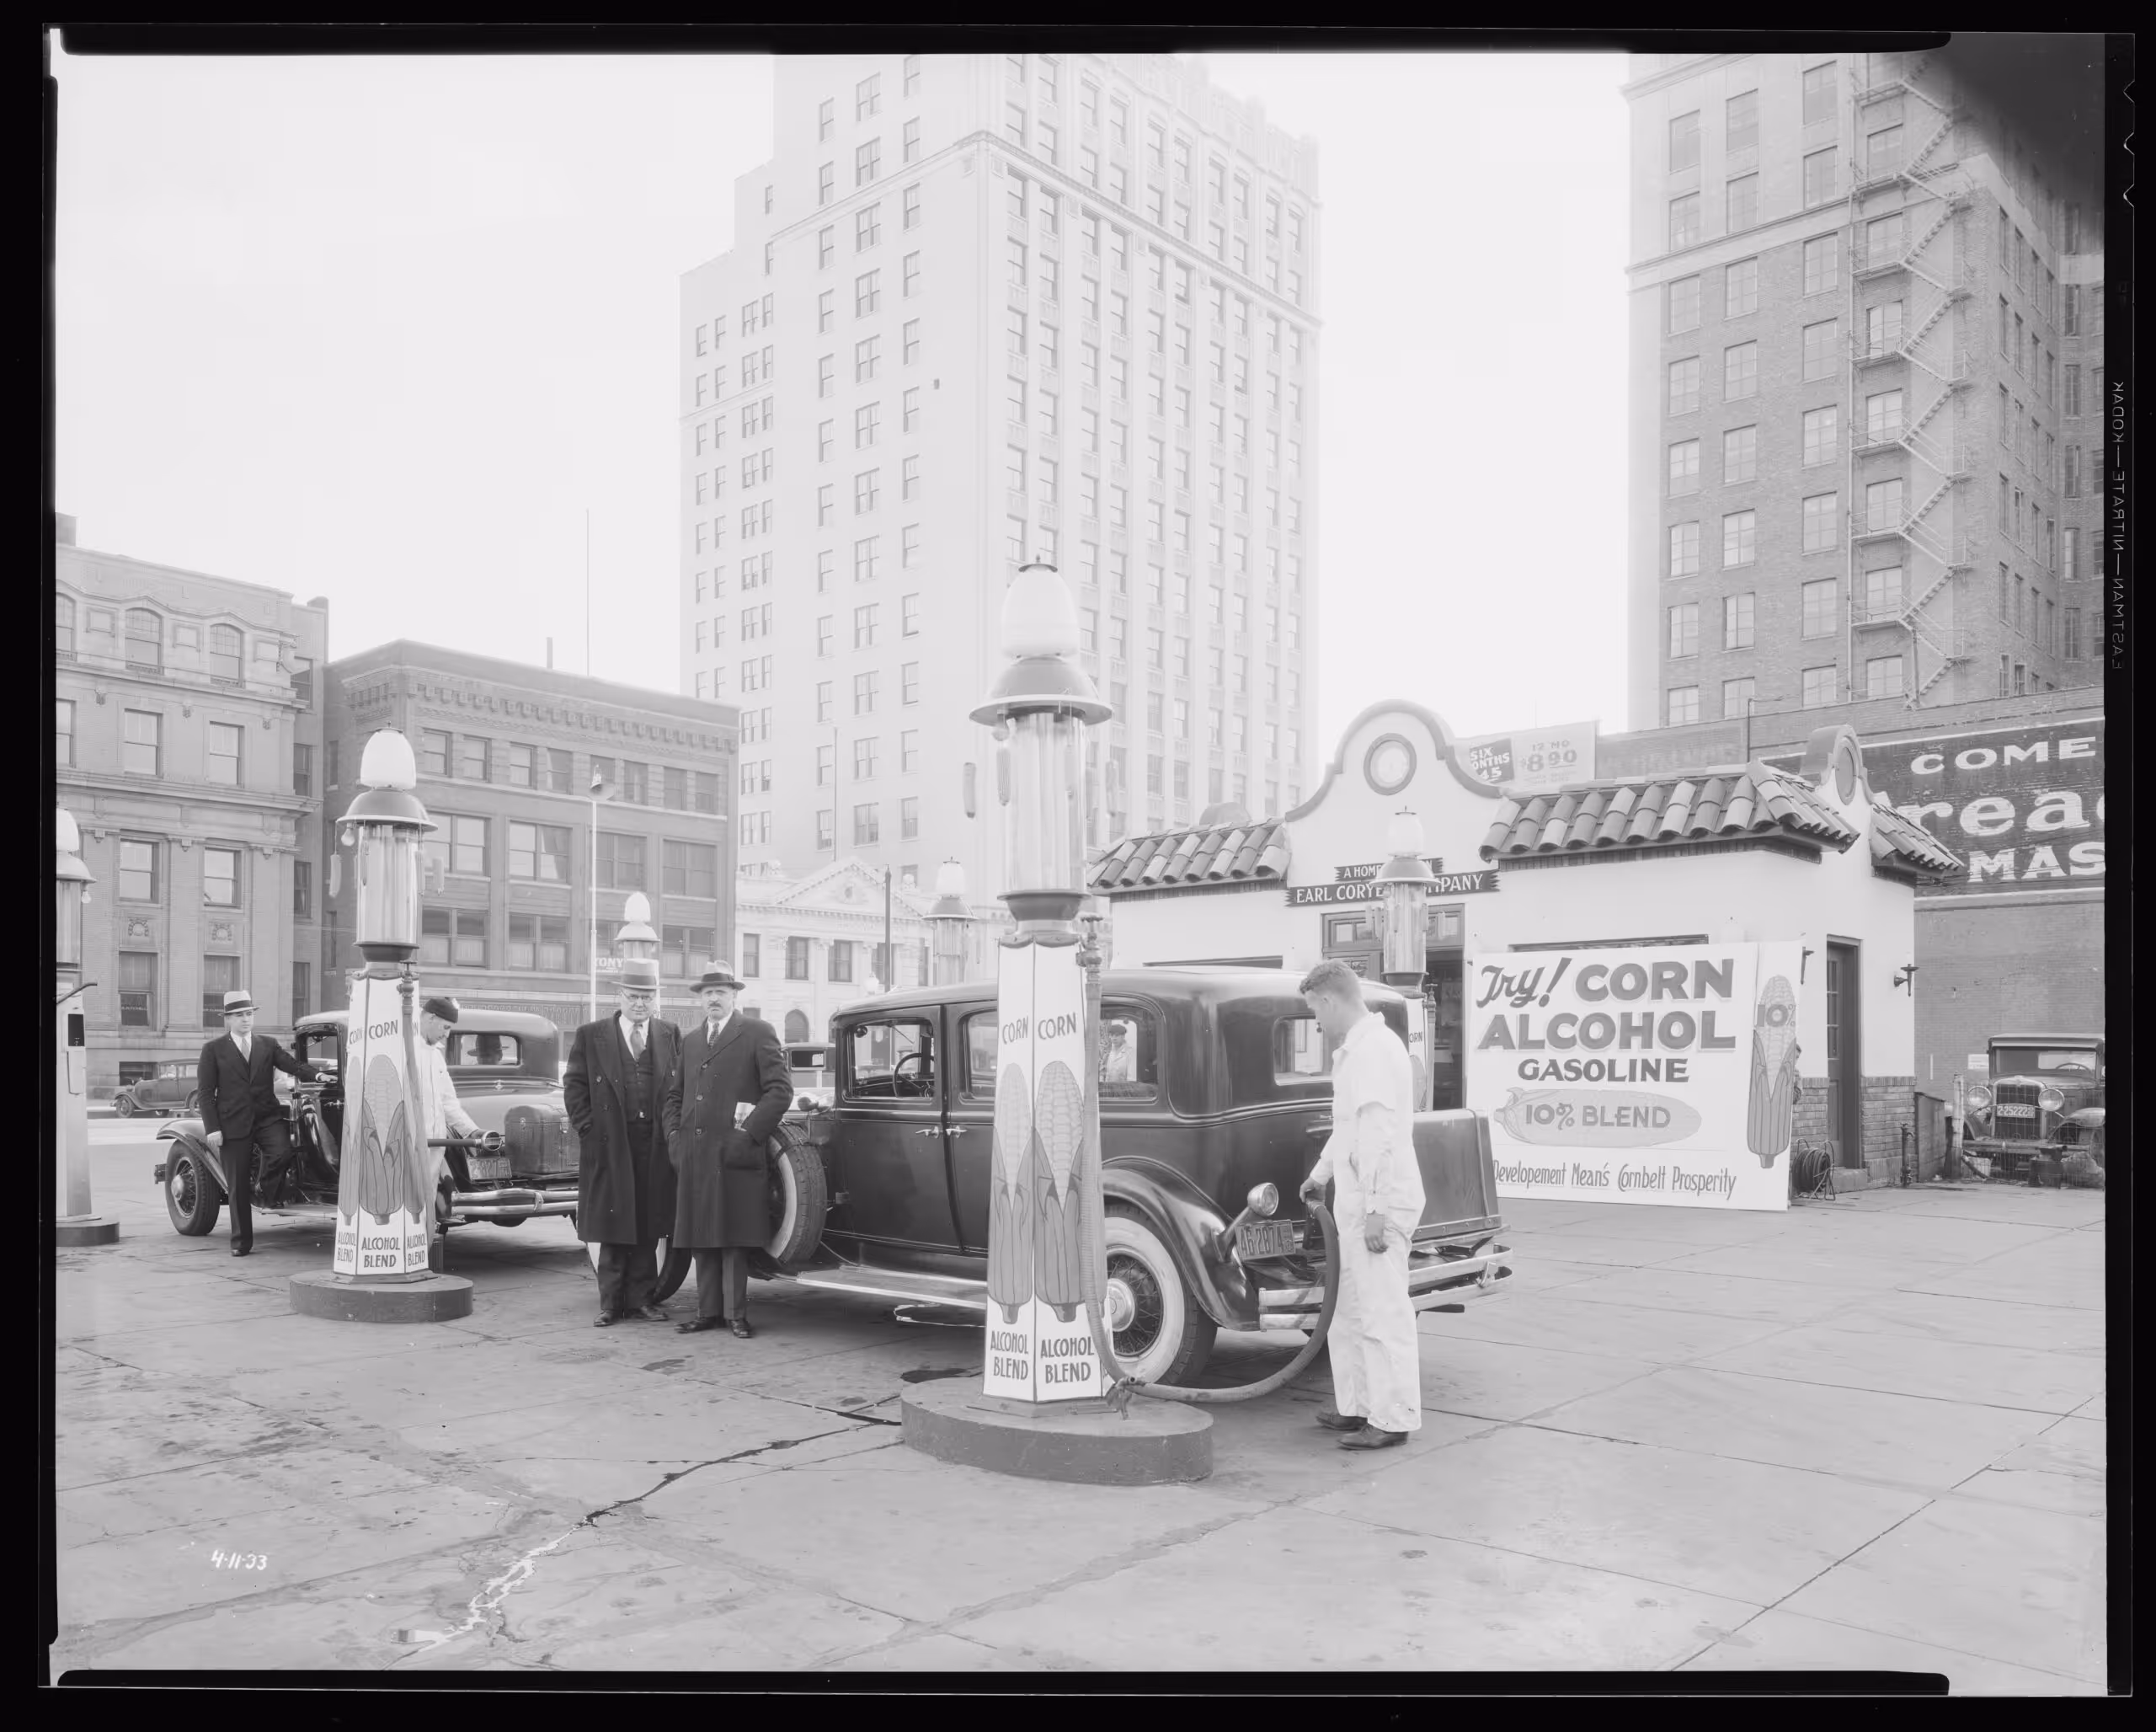
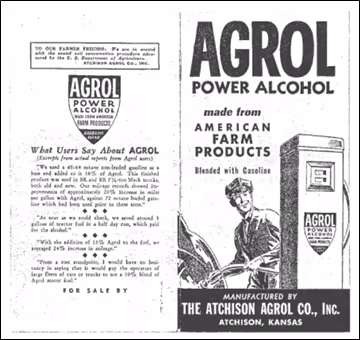
Between the wars, the Prohibition era (1920-33) was unkind to every form of ethanol, both beverage and industrial. In the late 1930s, amid the lingering Great Depression, an interwar surge materialized as ethanol was enthusiastically championed by a troika of strange bedfellows-farmers, chemists, and anti-capitalists-seeking to monetize Midwestern grain surpluses and realign the American political and economic system according to the radical philosophical tenets of the Chemurgy movement.12 Before it collapsed, this loose consortium managed to put more than 2,000 gas stations across eight states in the Corn Belt into the business of selling ethanol-blended gasoline marketed as Power Alcohol and Agrol between 1937 and 1939 (see figure 4).13 After both wars, use of ethanol as motor fuel declined rapidly due to the abundance of cheap petroleum and the end of government wartime demand. From 1947 to 1973, fuel ethanol again reverted to a purely niche commodity with little record of commercial production. The oil shocks of the 1970s ushered in the fourth surge, which began with the renaissance of gasohol and a core rationale of improving energy security.
Today, this surge continues at a stabilized production rate 25 times higher than previous peaks, but its principal rationale has changed. Geological and geopolitical paradigms that once made petroleum seem scarce have been upended by an intervening revolution in technology that has put vast new hydrocarbon formations economically within reach. The United States, in the vanguard of this revolution, has rapidly become the world's largest producer of mined hydrocarbons and a net exporter of more than 40 billion gallons of petroleum per year, mostly as refined gasoline and diesel fuel.14 The political task for biofuels has shifted from replacing scarce, imported fossil fuels to displacing abundant, domestically produced fossil fuels. Meanwhile, in an ironic twist, the nation has been experiencing "peak ethanol" for a decade, with its production tracing the classic S-curve (logistics curve) of plateaued growth.
Figure 3. Global Annual Ethanol Production, by Region: 2024
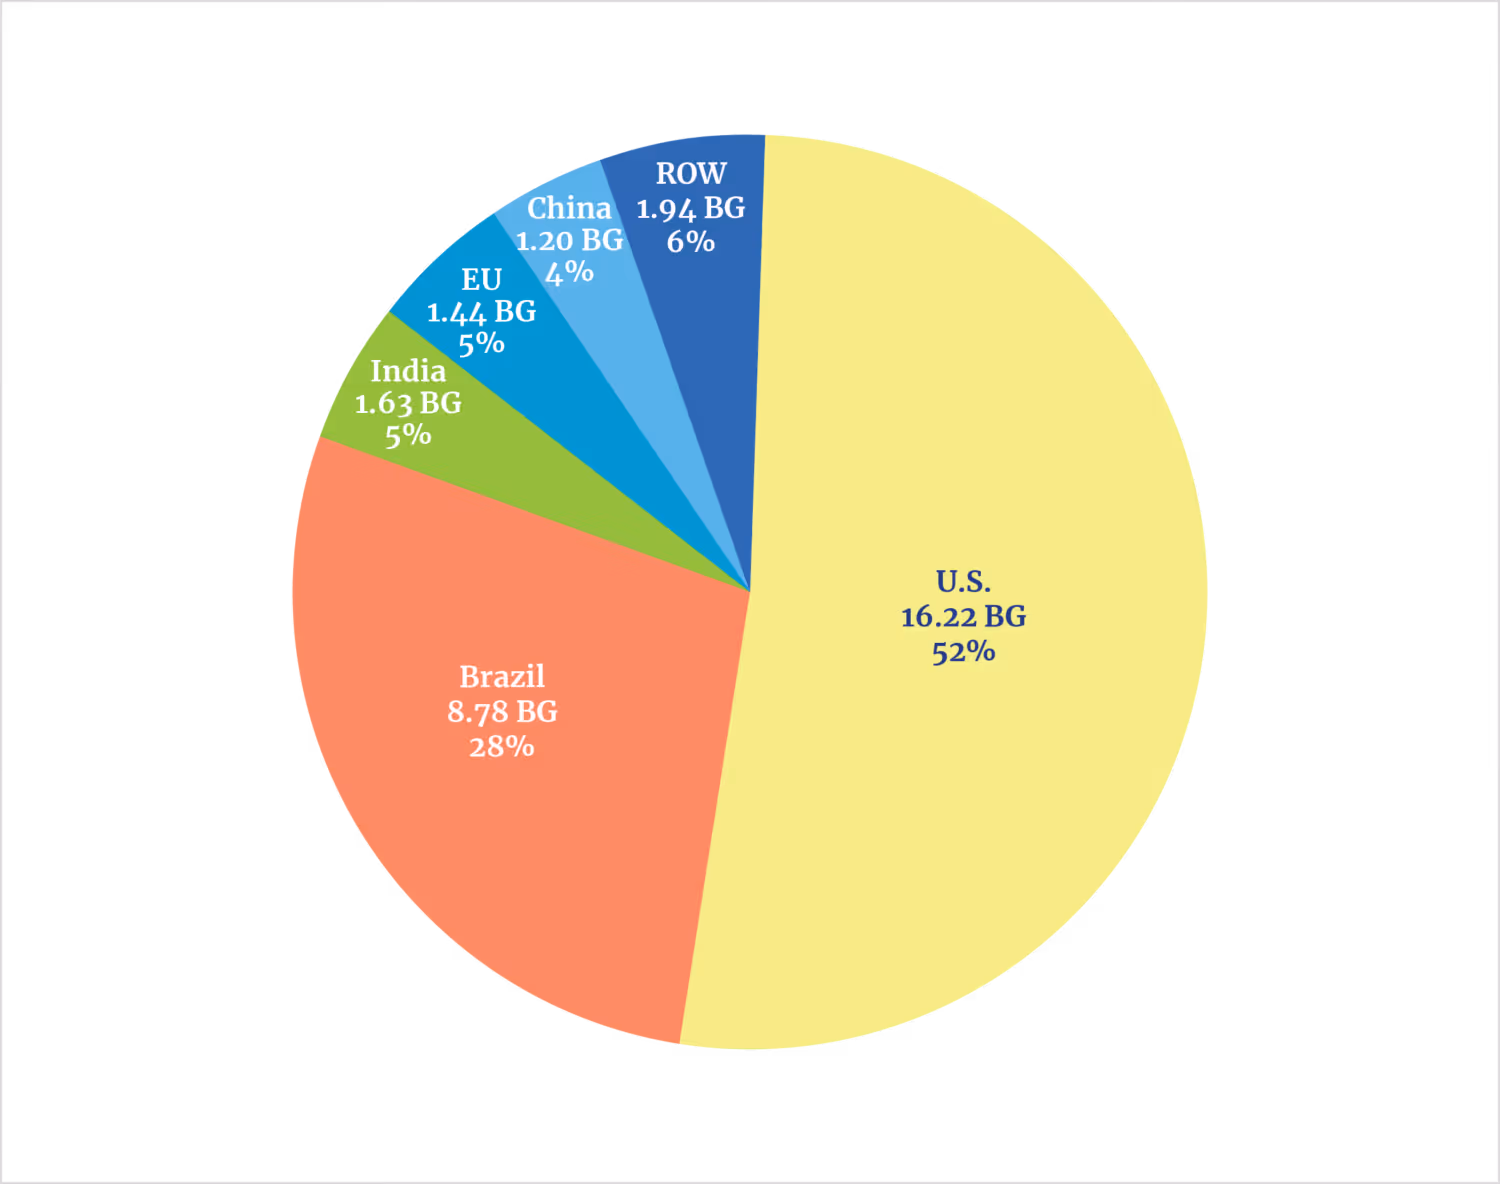
Source: Adapted from "Annual Ethanol Production: U.S. and World Ethanol Production," Renewable Fuels Association, accessed February 2, 2026, https://ethanolrfa.org/markets-and-statistics/annual-ethanol-production.
Figure 4. Atchison Agrol Company Flyer, Circa 1938
Top Growth Challenges
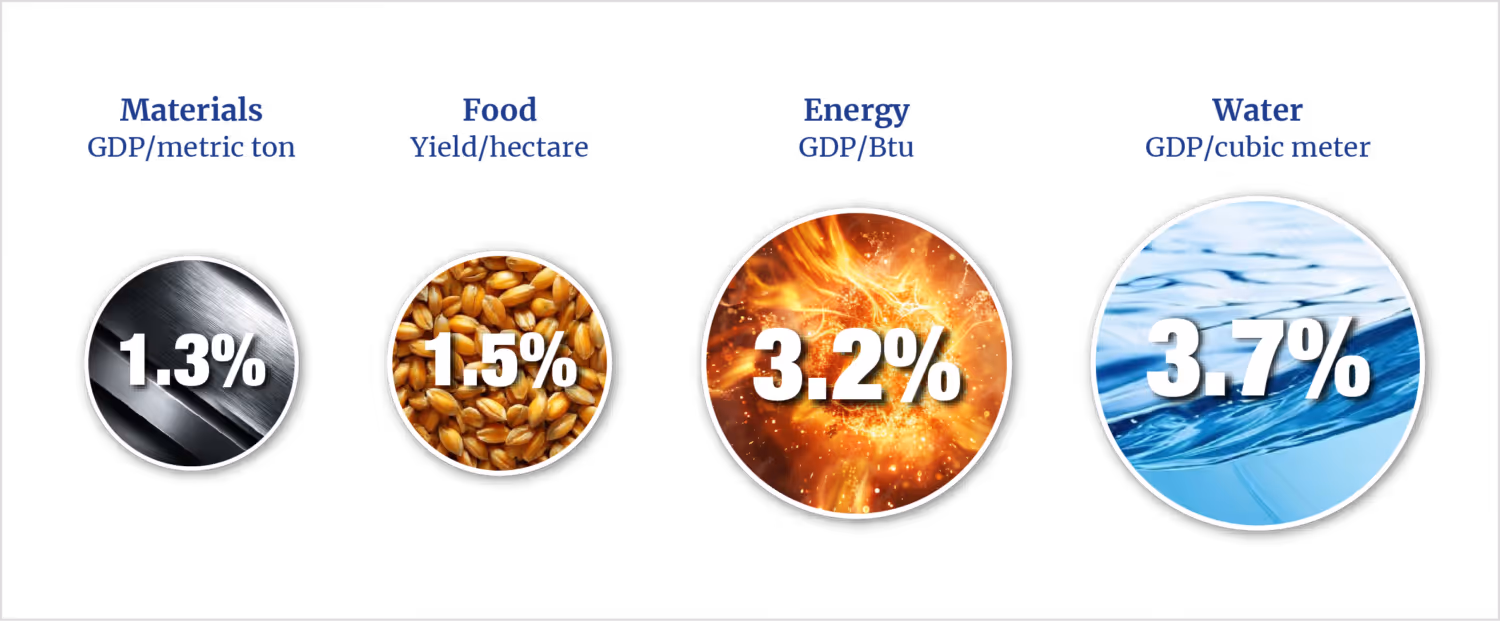
While bioethanol production stagnates, global population continues to climb. The increasing stress on resources is many times greater than the headcount growth, however, as existing billions gain first-time power grid access, increase the meat fraction of their diets, and industrialize. A ranking of the relative resource growth rates needed to keep pace puts water and energy at the top, as shown in figure 5.15 Therefore, decisions about water require consideration of energy impacts, and-likewise-decisions about energy require consideration of water impacts.
Figure 5. Required Annual Productivity Improvement Rates, by Sector: 2010-30
Water Consumption
Freshwater is a tiny but precious fraction of all water on Earth, and freshwater scarcity currently confronts all nations to some degree. Two out of every three gallons of groundwater in the United States are used for irrigation, with the largest aquifer depletions occurring in the Mississippi Delta, the Central Valley of California, and the Ogallala Aquifer in the southern Great Plains.16 Water scarcity affects major U.S. agricultural districts and has drawn presidential attention.17 While irrigation rates are declining slightly in the Corn Belt, absolute water use and groundwater depletion are growing concerns. With corn currently accounting for 55% of principal U.S. crops under cultivation and 40% of that corn being harvested for bioethanol,18 more than one-fifth of the nation's farming effort is already devoted to energy production-in direct competition with food production for all agricultural resources, including land, fuel, agrichemicals, equipment, labor, and water.
Water Footprint
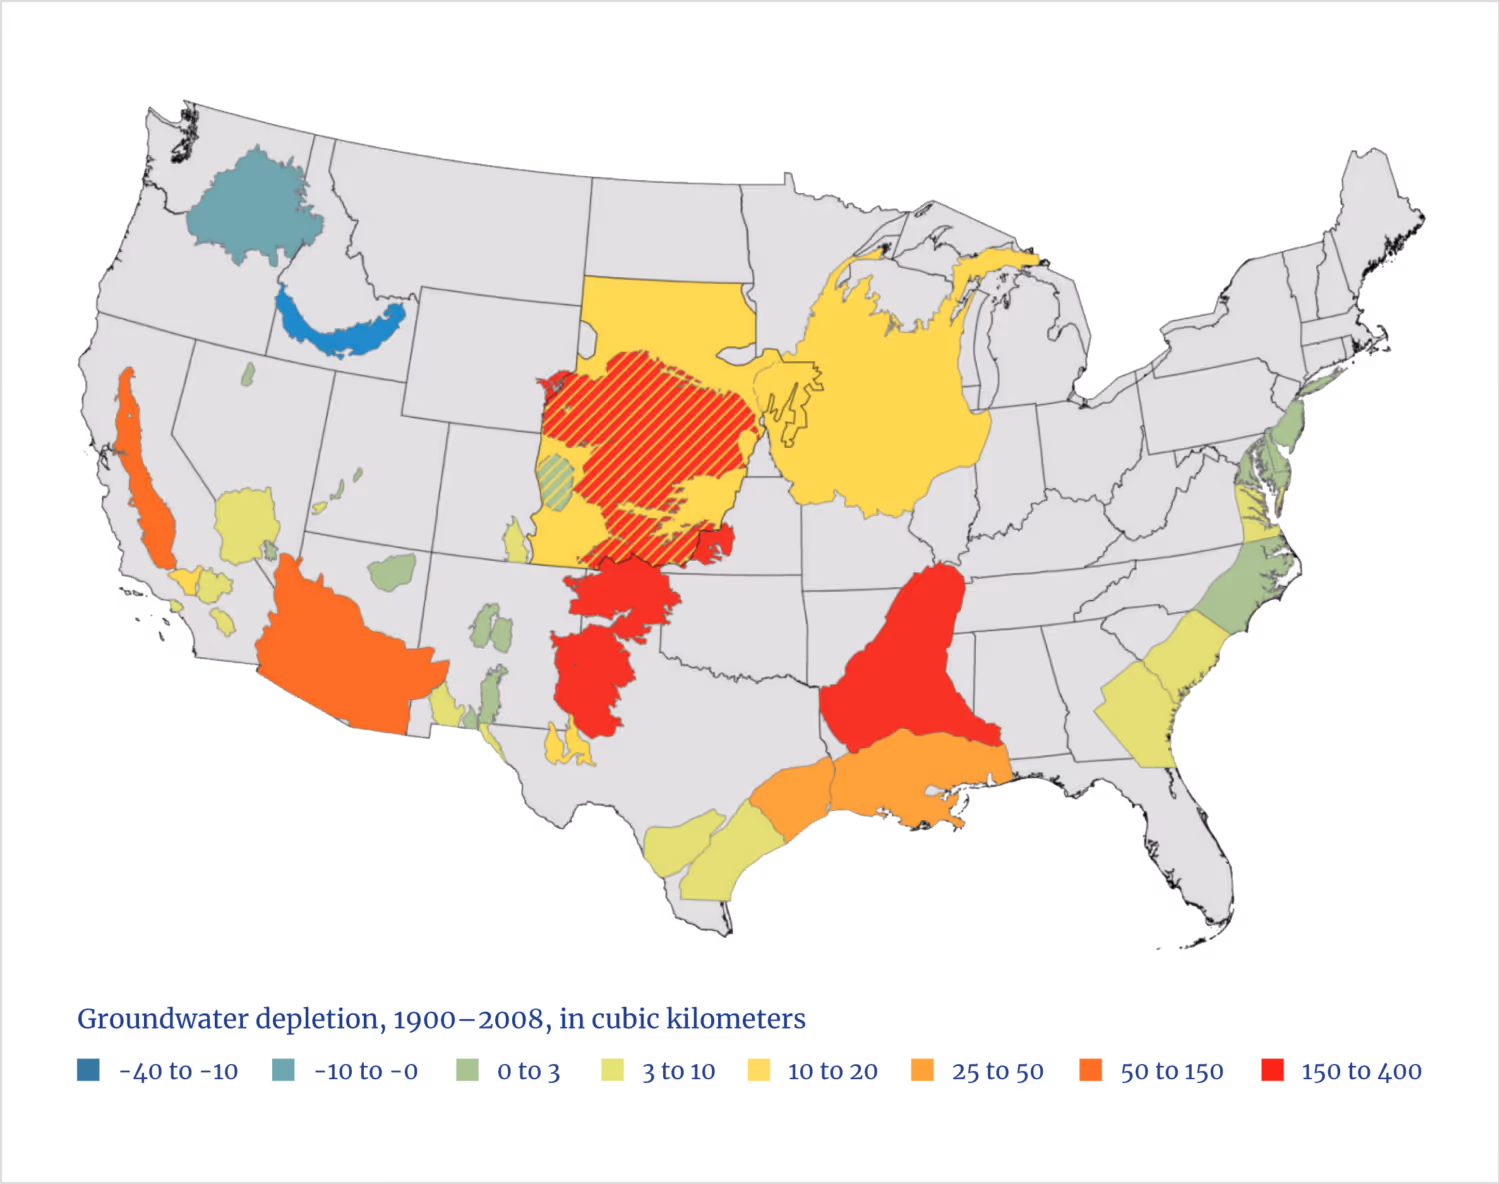
Water footprint assessment is now the most thorough and accepted methodology for considering the freshwater impact of human activities.19 It has displaced the previous concept of water withdrawal and more thoroughly considers consumptive water use from surface water, groundwater (see figure 6), and rain throughout the production and use life cycle of a particular product or service, as well as the pollution effects on freshwater bodies. Consumption is defined as freshwater that is not available for reuse within an environment's natural boundaries, such as a reservoir or catchment area. This consumption occurs through uptake by crops or closed-loop cooling systems, by redirection out of its original environment, and-most commonly-by processes that cause evaporation. It can also result from actions that contaminate it.
Figure 6. U.S. Groundwater Depletion
Corn Ethanol Versus Gasoline
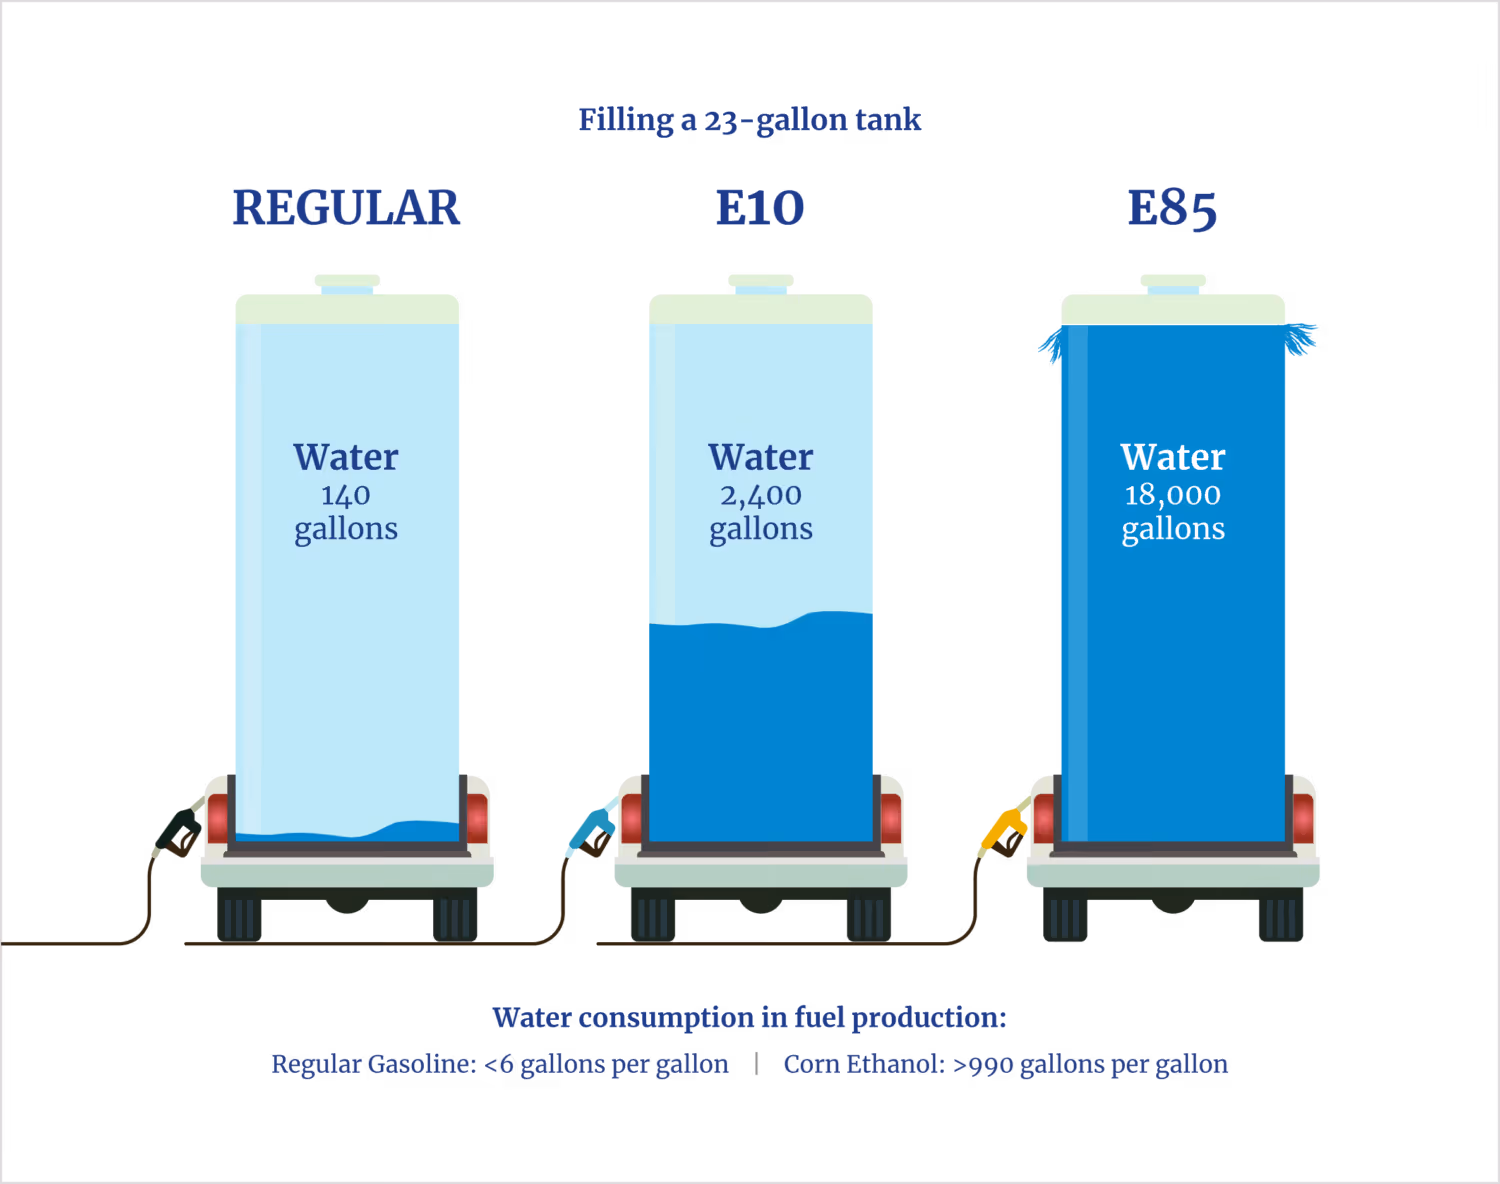
Producing liquid fuel from mined petroleum requires a considerable amount of water per unit of energy delivered. The most thorough and authoritative analysis of the current water footprint of U.S. pump gasoline finds a weighted national average of 5.6 gallons of water consumed per gallon of fuel.20 Producing liquid fuel from biomass, however, requires orders of magnitude more water. The most thorough and authoritative water footprint analysis for U.S. corn ethanol reports a weighted national average of 992 gallons of water per gallon of fuel.21 To illustrate the difference in water consumption, consider these alternative vehicle fueling scenarios.
E85 is 51%-83% ethanol by volume-the highest blend of ethanol with gasoline available to the general public.22 One of the most common E85-compatible U.S. vehicles on the road today is a 3.3 L, six-cylinder Ford F-150 flexible-fuel vehicle (FFV) variant. EPA-certified fuel efficiency for this vehicle is 21 miles per gallon (mpg) combined city/highway on regular gasoline and 16 mpg on E85.23 Assuming 10% ethanol in E10 gas and 80% in E85, and applying the EPA mileage for each, driving the flex-fuel truck represents an embedded water cost of 5 gallons per mile (gal/mi) for E10 and 50 gal/mi for E85. For non-ethanol E0 gasoline of any octane rating, with octane adjusted by refinery-produced aromatic hydrocarbons, the embedded water cost is 0.3 gal/mi. To put the water footprint in stark perspective: Adding 10% ethanol to regular gasoline to make E10 consumes 18 times more water per mile traveled down the highway, E15 consumes 27 times more, and E85 consumes 174 times more (see figure 7).
Figure 7. Embedded Water Versus Fuel
U.S. corn has the world's lowest water footprint by far and has been slowly improving,24 largely due to greater adoption of genetically tailored, drought-resistant cultivars that allow reduced reliance on irrigation.25 There is likely room for modest additional improvement through further adoption of precision agricultural practices. However, photosynthesis indispensably requires the evaporation and transpiration of large quantities of water to transport nutrients upward from the soil and protect leaves from sunburn. There is no realistic prospect for the dramatic reductions necessary to approach the water footprint of refined petroleum or to substantially reduce water competition with food-especially when growing corn outdoors at the scale of the 400 million acres necessary to displace current annual gasoline use.26 The EPA has long recognized that biofuels, even at RFS scale, represent water competition with food. In 2010, the EPA accurately predicted "adverse impacts on both water quality and quantity as the production of biofuels and their feedstocks increase."27
Gray Water
There is a significant component to water footprint that is not currently fully accounted for in corn ethanol: gray water. Gray water refers to the freshwater needed to dilute contaminants from human activity to environmentally safe concentrations for discharge. For cases in which healthful discharge limits are enforced, this is the actual additional water consumed in wastewater treatment. But in the many cases of insufficient enforcement, this is instead a calculated value of what would be required to treat the water and thus represents an unpaid environmental cost.
Nitrogen- and phosphorus-rich runoff from intensively cultivated Midwestern farms is well documented to flow down the Mississippi River and contribute to a perennial algae-bloom dead zone along the U.S. Gulf Coast, typically covering an area comparable with that of a New England state (see figures 8 and 9).28 Gulf oil spills get no such free pass. The freshwater necessary to mitigate this environmental damage is not currently counted in water footprint due to a definitional quirk: The affected water body is saltwater rather than freshwater. This loophole in water footprint should be closed.
Figure 8. Corn Fertilizer Nitrification Emissions in the Mississippi River Watershed

Figure 9. U.S. Gulf Coast Hypoxic Dead Zone

Energy Margin
Energy Return on Investment
In almost every human endeavor, the question is not just whether something can be done but whether it should. Modern reasoning tools, such as cost-benefit analyses, are used to predict and weigh likely outcomes. Even if an outcome appears to be positive, comparing options can determine whether the same resources invested differently might produce an even better result. Committing resources to lower-return options incurs what economists call opportunity cost. In nature, species that make poor investments with their limited energy resources are outcompeted by rivals, fail to survive, and go extinct. Market economies work similarly for businesses-and nations.
Underpinning the fiscal economy of currencies and finance is the more fundamental economy of energy. Within this system, the ultimate metric for analyzing alternatives is energy return on investment (EROI).29 EROI is a unitless ratio of energy output to energy input. For fuels, EROI can be defined as the amount of usable energy in a new quantity of finished fuel delivered to its point of use divided by the energy consumed to produce and deliver that new quantity of fuel:

The significance of EROI lies in the fact that all inputs and outputs-that is, resource and emission costs versus goods and services benefits-scale with the square of this value. The ratio applies recursively through every repeated cycle, similar to compound interest.
Civilization, in its simplest terms, can be understood as humans collectively sustaining themselves as a species-using energy to collect, mine, and grow resources from the earth and to further refine them through technology. One thing that must be collected, mined, or grown is the energy itself: The higher the fraction of energy consumed for this purpose, the less remains for everything else. Low-EROI civilizations require humans to spend all of their working hours scavenging for food and firewood. High-EROI societies yield surplus energy for travel, leisure, education, fine arts, and indulging curiosity with the tinkering that leads to scientific discoveries and technological innovations, resulting in newer and more efficient processes that further increase EROI.
Since it takes energy to collect, transport, and even consume energy, there is a threshold EROI just to achieve any break-even net benefit to the end user-and this value is approximately 3:1 for liquid fuels at the retail point of sale.30 Of course, breakeven represents only life support, not a healthy economy. A fuel pump EROI of 6:1 is generally considered to be the threshold of utility for a transportation-intensive society.31 Below that threshold, modern energy-intensive civilizations descend into economic contractions that economists call recession and depression. Moving upstream, EROI must be successively higher in the stages of refining, production, and exploration to survive the greater cumulative downstream losses that erode its margin on the way to the fuel pump. Industrializing societies require even higher EROI at each life-cycle phase to have the margin required to build out necessary infrastructure that eventually yields the efficiencies of scale and density of postindustrial civilization. If agrarian-age point-of-use EROIs below 6:1 persist, deindustrialization becomes inevitable due to insufficient margin to maintain existing infrastructure. Energy is nourishment for the organism of human civilization, and a calorie-poor diet leads to wasting of the body. Energy producers and governments, like investment fund managers, have a fiduciary duty to seek the best returns for their constituents and to deliver abundant, high-quality energy. EROI governs both abundance and quality.
EROI of Corn Grain Ethanol
There has been considerable controversy about the energy margin of U.S. corn ethanol produced from the starchy kernel of the plant, including doubt about whether it is net energy-positive at all. A weighted scoring of 17 peer-reviewed studies yields a most-probable EROI of 1.5:1 as the average for the current fleet of U.S. corn ethanol biorefineries.32 This ratio means that for every 1 unit of energy input, 1.5 are created, giving a net gain of 0.5 units. Only 63% of this net energy is in the form of ethanol, while the other 37% is obligatory coproducts such as distillers grains and corn oil.33 While this is a positive energy balance, it is far below the threshold that modern civilization needs. Indeed, when building the Colosseum, the Roman Empire achieved better than 4:1 EROI with human and slave labor fed by giant latifundia state farms that grew wheat and alfalfa (see figure 10).34
Figure 10. Roman Latifundium

The Renewable Fuels Association published its own EROI analyses in 2016 and 2022. These indicated biorefinery fleet averages of 2.8:1 and 3:1, respectively. Even in these industry-sponsored reports, the highest outlier that EROI claimed for any real or modeled facility was 4:1.35 This value will be revisited shortly.
Critical Dependence upon Fossil Fuel
U.S. Department of Agriculture historical data show that corn yields never exceeded 32 bushels per acre from the American Civil War through 1942-despite active farming innovations including crop rotation, hybridization, and mineral nitrogen fertilizer application. Yields skyrocketed, however, when farmers accessed surplus ammonium nitrate from giant synthetic ammonia plants built by the U.S. in the early 1940s for wartime explosives.36 All U.S. ammonia today derives from natural gas, and virtually all of it ends up as fertilizer on crops. Nitrogen as ammonia is now applied to grain corn at a nationwide average of 152 pounds per acre, and that rate is still increasing.37 This fertilization has enabled much of the sixfold increase in yield since 1940 (see figure 11).
Ammonia fertilizer; herbicides, fungicides, and insecticides; enzymes and growth media for fermenting microbes; cultivation equipment and transportation fuel; processing plant heat and chemicals-these all come from natural gas and petroleum. The entire corn ethanol production life cycle depends absolutely upon fossil fuels. Without them, agricultural yields would collapse, distillation would again be viewed as an extravagant waste of scarce energy, and ethanol would revert to being a premium beverage produced only in boutique quantities.
Figure 11. U.S. Corn Grain Yield Versus Ammonia Fertilizer

It is important to note that the 1.5:1 EROI of corn ethanol represents a hybrid of ethanol and fossil fuels. If corn ethanol production were attempted using only corn ethanol for tractor and truck fuel, only stalks and cobs for processing plant power, and only biorefinery coproducts for fertilization, the life cycle would have negative energy balance and could never be completed. Not one biorefinery in the nation uses its own ethanol for distillation heat, and it is extremely rare to find a tractor running on E85. Most, if not all, of the product ethanol would be consumed in creating the next batch. Instead, refiners and farmers-like all industries-appropriate much higher-EROI energy into their production process from petroleum, natural gas, and coal.
Comparison of Fuel Life-Cycle EROI of Petroleum Versus Corn Ethanol
To illustrate the cost of pursuing low-EROI energy sources, figure 12 shows a comparison that generously grants corn ethanol the industry's aspirational 4:1 EROI against a very conservative 8:1 EROI for refined petroleum. Both cycles are normalized to produce the same net energy of 43 million British thermal units (MBtu), which is equivalent to eight barrels of diesel fuel.
In the petroleum cycle, one barrel of energy produces and refines nine more, with one used to power the next cycle. Creating those nine barrels of refined petroleum consumes 2,100 gallons of water, and combusting the one input and eight output barrels of petroleum fuel releases 4.5 tons of CO2.
Figure 12. Life-Cycle EROI Comparison Between Refined Petroleum and Corn Ethanol

In contrast, the corn ethanol life cycle is asymmetric, converting fossil fuel energy and photosynthesis into ethanol and livestock feed. It begins with the input of 2.7 times as much energy-91% of which is nonrenewable, based on the current U.S. national energy composition.38 Even at this highly optimistic 4:1 EROI, the cycle actually requires 58% more input fossil fuel energy than the petroleum fuel cycle to generate the same net energy output. Cultivating corn, processing it into alcohol, and creating its obligatory coproducts consumes 470,000 gallons of freshwater-220 times the water consumed for the petroleum fuel life cycle and equal to submerging every acre of harvested cornfield in 1.5 feet of water.
The disparity in water consumption in this full life-cycle and net-energy analysis exceeds that of the earlier comparison, which oversimplified matters by merely considering equivalent energy volumes of finished fuel in the tank. All energy is created with some energy debt-the lower the EROI, the greater this debt. For example, a 4:1 EROI fuel has twice the energy debt per unit of energy than that of an 8:1 EROI fuel, and therefore twice as much must be produced to deliver the same net energy. This means more production cycles, greater resource consumption, higher emissions, and increased environmental impact. In other words, both resource inputs and emissions outputs scale to the square of EROI, and thus no serious analysis can afford to ignore it.
In the corn ethanol example, the combustion and digestion of one production cycle of output ethanol and coproducts releases 5.5 tons of CO2, giving full credit for the carbon capture technology employed in the newest biorefineries. In this analysis, CO2 emissions were not computed for the land-use change of acres converted to intensive cultivation that otherwise could lie fallow and sequester carbon as part of the Farm Service Agency's Conservation Reserve Program.
The computed 20% increase in GHG emissions versus those of the fossil fuel life cycle does not meet the RFS threshold of a 20% minimum reduction required of first-generation biofuels. In the more likely case that the actual corn ethanol EROI is much lower than 4:1, water consumption and GHG emissions would both be even higher. U.S. corn ethanol does, in fact, have higher GHG emissions than those of gasoline, and the EPA knows it (see GHG Emissions, pp. 21-23).
No Prospect for Significant Improvement in Corn Grain Ethanol
All U.S. biorefineries use either a wet or dry mill process for producing corn grain ethanol. Yield has increased modestly, from 2.68 gallons per bushel in 2002 to 2.90 in 2022.39 Newer plants have higher energy efficiency, mostly due to increased scale, conversion to natural gas process energy, and better process heat handling and recovery. Use of more efficient molecular sieves for dehydration is now industry standard. Many newer plants capture CO2, but they do so at the cost of an additional energy burden that thermodynamically must reduce efficiency and decrease EROI. The most innovative development in the field may be the genetic engineering of a particular corn cultivar to incorporate the amylase enzyme, which breaks down starch and helps to accelerate the fermentation process.40 However, none of these innovations has proved to be a rule-bending breakthrough that would alter the cost or yield curves sufficiently to make corn grain ethanol competitive without subsidies.
First-generation corn ethanol was clearly intended in RFS as a temporary stepping stone to truly advanced, second-generation biofuels. But what about the vision of billions of gallons of ethanol per year from nonedible portions of the corn plant and other woody biomass?
The Promise of Cellulosic Ethanol
Second-generation liquid biofuels made from nonfood sources have simply not materialized in meaningful quantities that are capable of displacing motor fuels, despite monumental investments from federal agencies (e.g., U.S. Department of Agriculture , U.S. Department of Energy , U.S. Department of Defense ), industry (e.g., DuPont, Abengoa, POET, Cargill, ExxonMobil, Shell, Chevron), and scores of venture capitalists and failed start-ups. If any single approach should have been viable, it would be cellulosic ethanol made from corn stover-the stalk, leaf, husk, and cob biomass that remains in the field after the kernels have been harvested. Since stover is a free byproduct of government-subsidized corn production, produced perennially from the same concentrated array of farm fields and available via the existing roads to the same centrally located biorefineries as corn grain, it should be the cheapest of all cellulosic feedstocks.
Yet the largest cellulosic biorefinery attempts to date-strategically located amid cornfields in Nevada, Iowa; Emmetsburg, Iowa; and Hugoton, Kansas, each representing about a quarter-billion dollars of infrastructure and promising tens of millions of gallons per year-have failed spectacularly. A closer look reveals many inescapable realities that destroy the EROI of corn stover ethanol.
The Tyranny of Density
Agriculture has some unique economic traits. In contrast to most industries, its unit costs can increase with scale. The major agricultural energy and resource inputs are flatly proportional to the land area cultivated and bushels harvested, including the fertilizer and pesticides applied as well as the processing plant energy needed later. However, the amount of transportation fuel needed per bushel increases with farm size. As a field expands, the new cropland at the periphery-farthest from the central barn or plant-requires proportionately more transportation fuel for the same yield because of the longer round-trip distance. This explains why farmers have worked for generations to increase the yield per acre rather than just planting more acres. USDA analysis of farm survey data finds that economies of size disappear for farms between 750 and 1,500 acres.41
U.S. corn is now seeded at an astonishing density of 29,000 plants per acre, which is possible only with specially engineered plants that have shorter stalks with upturned leaves in order to maximize solar exposure in tight quarters and that are optimized to seek more growth energy from the soil biome pumped with nitrogen and hydrogen energy from pure anhydrous liquid ammonia fertilizer. With agriculture, economies of density must be considered in addition to economies of scale. Corn stover ethanol offers a painful example.
Feedstock Transportation Cost of Corn Stover Versus Grain
The 2024 U.S. average productivity was a world-dominating 179 bushels per acre of grain corn.42 That equates to 5 tons of corn kernels and 4.7 tons of stover per acre-year. The current ethanol yield of 2.9 gallons per bushel of grain is equivalent to 519 gallons per acre and 104 gallons per ton. The fibrous stover, which is considerably more difficult to process into alcohol, has nevertheless been promised to yield 70 gallons per ton at sustained industrial production.43 For the moment, assume this to be true.
Since stover contains valuable nutrients and helps preserve soil moisture, best practice allows removal of no more than 50% from the field.44 This means that only about 2.3 tons of stover is harvestable per acre-year-theoretically yielding 165 gallons per acre. A tractor and a baler harvesting stover for a cellulosic ethanol plant collect only approximately one-third of the final product ethanol energy per acre, compared with that of corn grain, while burning the same amount of fossil fuel for collection and transport of feedstock.
A cellulosic biorefinery must therefore harvest three times as much land to produce the same amount of ethanol, which means pulling in two-thirds of the feedstock from a greater radius than a corn grain ethanol refinery requires. The average round-trip distance per load increases by a factor of 1.73, and three times as many trips are required, raising the feedstock transportation cost for stover to more than five times that of corn grain per gallon of ethanol produced. At an industrial scale, the bulk of cellulosic ethanol feedstock arrives at the biorefinery with an irredeemable energy debt.
Energy Cost of Fiber to Liquid Fuel Conversion
Chemistry itself presents formidable challenges to cellulosic ethanol. Corn stover, like all woody biomass, is composed of hemicellulose, cellulose, and lignin (see figure 13).45 The essential step for ethanol production is saccharification, which is the process of breaking down solid feedstock into a slurry of individual sugar molecules that can be fermented into alcohol by natural yeast or other microorganisms.
Two-thirds of a corn kernel is starch-a daisy chain of sugar molecules that can be separated by breaking a single chemical bond. These simple carbohydrates are easily digestible and contribute to weight gain in humans. But humans cannot digest any of the three types of lignocellulosic fibers that form the outer hull of a corn kernel and the rest of the plant; doing so requires days of nonstop chewing and a ruminant's four-chambered stomach to free that energy. Next to starch, hemicellulose is the easiest of the three fibers to break down, but it is a small fraction of the stover and contains multiple bonds per sugar molecule. Its sugars are mostly in five-carbon form, unlike the common six-carbon sugars that typical yeast can digest. As a result, substantially converting hemicellulose to ethanol requires multiple distinct processes, each with its own engineered microbes or laboratory-synthesized enzymes. These are relatively expensive, require fossil fuel feedstock and energy for production, and generally demand a sterile environment to complete their work without being compromised by contamination.
Figure 13. Complex Chemistry of Lignocellulose Versus Starch
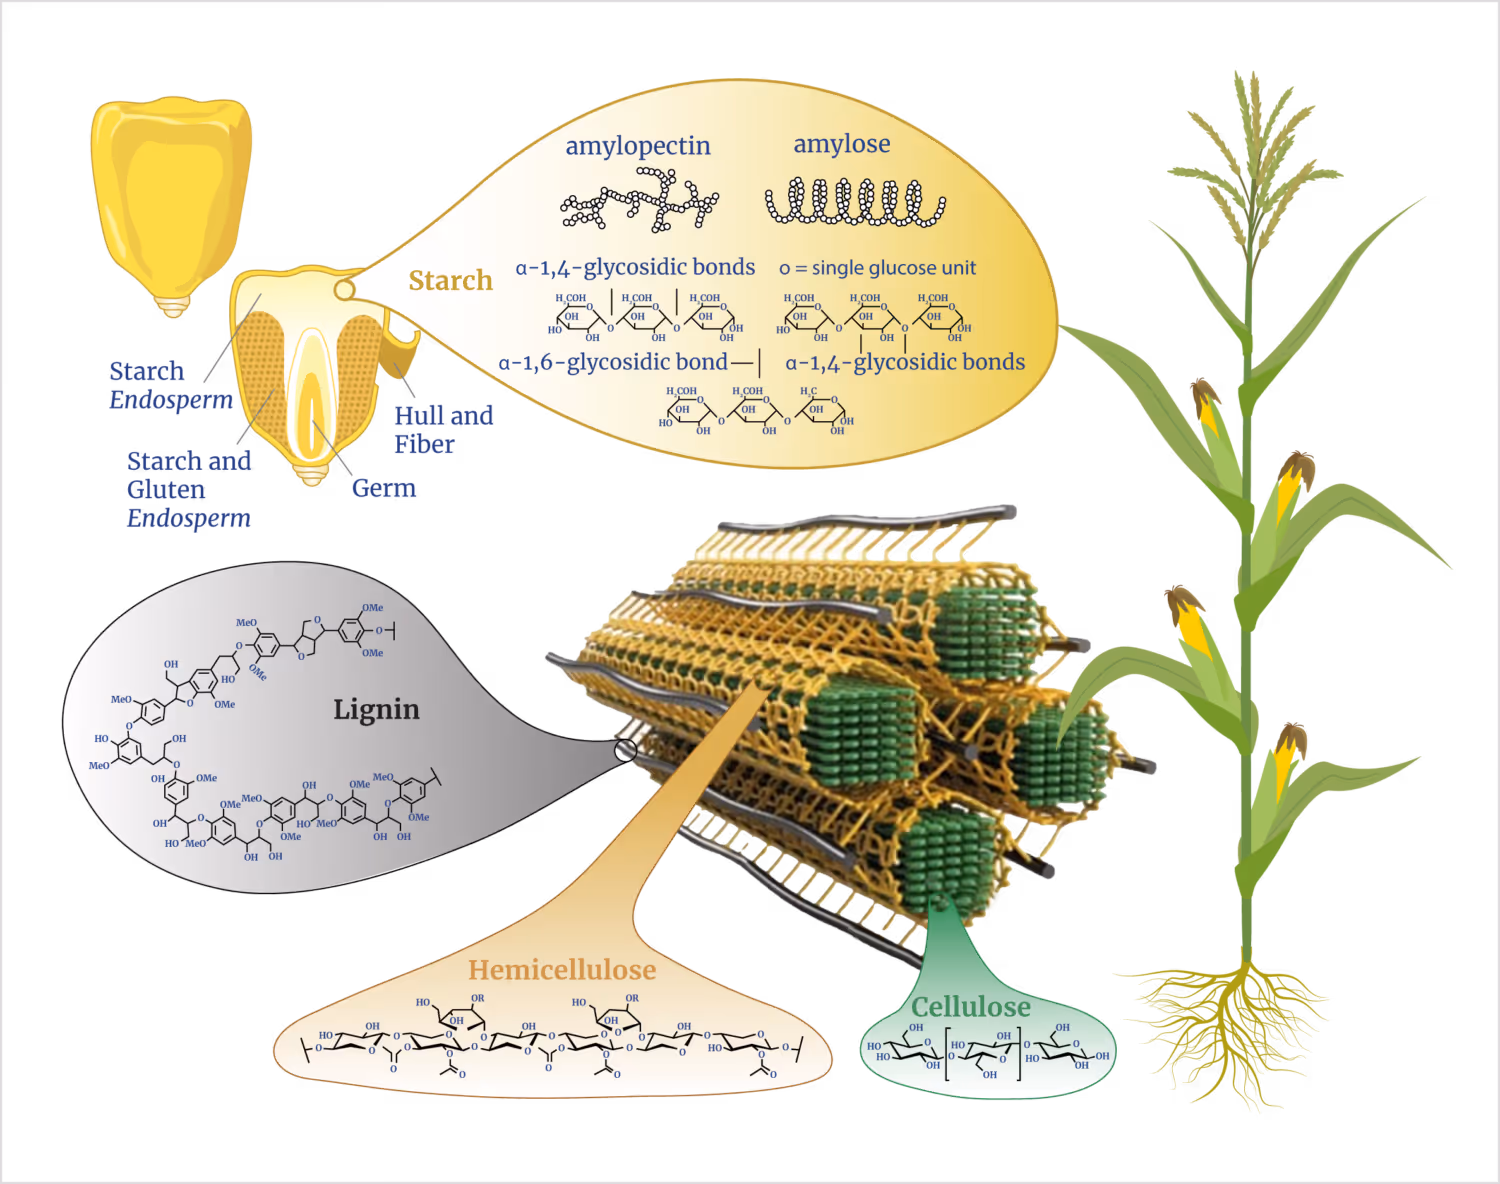
Cellulose fiber forms the bulk of the stover, but its sugar molecules are tightly linked in a three-dimensional crystal with six to eight bonds binding each sugar molecule. Before saccharification, cellulose must be pretreated-its ropes of cellulose either surgically unwound and microscopically diced into individual sugar molecules using delicate nanomachine cellulase enzymes in a weeklong batch process or blasted apart with steam and acid.46 The energy costs to achieve saccharification of cellulose are five to 20 times higher than for starch, depending on whether the process is optimized for yield or speed. The best-case total energy cost to produce each gallon of cellulosic ethanol is double the combustion energy in the final product ethanol itself.47 This negative energy balance for solid biomass to liquid fuel has been known to serious scientists for decades, but the vain hope has been for some miracle enzyme that could shortcut thermodynamics or for enough energy in wastewater or incidental biogas to overcome this deficit. There is no basis for claims that lignocellulosic biofuels will ever have higher EROI than starch biofuels when producing liquid fuels.
Lignin, discovered by papermakers as a stubborn residue after heat and acid dissolved the other components of tree biomass, is a waterproof, nonsugar polymer. With no current market use, it must be either separated, dewatered, and burned for simple heat energy or treated as a water pollutant in the waste stream.
Scavenging for Cellulosic Renewable Identification Numbers
Currently, the most significant production of non-starch bioethanol is from corn kernel fiber. In 2014, Quad County Corn Processors pioneered the technology of adding a bolt-on facility to an existing dry mill to parallel process the hemicellulose fiber of discarded corn kernel hulls. They reported an additional 6% in total ethanol yield.48 It took 10 years for the EPA and industry to establish a lab standard that could validate the amounts of cellulose-derived ethanol versus residual starch clinging to the hulls.49
Since 2024, scores of dry mills have adopted this generation 1.5 approach. The economics works because the hulls are already delivered to the biorefineries as part of the kernel, generating no additional feedstock cost. Given that 92% of ethanol biorefineries are dry mills and assuming that most of the 6% increase in ethanol production is truly cellulosic, this could eventually represent a total national production of just under 1 billion gallons per year. This amount is less than 10% of the statutory RFS advanced biofuels mandate and less than 1% of annual gasoline consumption. Furthermore, this bolt-on cellulosic ethanol production pathway is not viable as a stand-alone operation but depends on continued subsidies for converting food corn into fuel.
Analysis of Alternatives
With such poor returns from cellulosic ethanol production, lignocellulose has better uses. The highest-EROI option for stover is direct combustion as solid fuel, avoiding all transformation losses. But since only kernel hulls are economically collectible, the best an ethanol biorefinery can do to maximize EROI is to burn these hulls as solid fuel for process heat-displacing natural gas-rather than to invest even more external energy into extracting a small amount of ethanol. Of course, distorted renewable identification number (RIN) economics can upend sensible energy economics.
The highest free-market value-added use for lignocellulose has long been known: the Kraft papermaking process. This process has sufficient EROI to pay for the harvesting, collecting, and regrowing of its feedstock biomass without subsidies; utilizes all fiber components; and provides about 70% of its processing plant energy from its coproducts.50 Unlike ethanol, paper products (e.g., printing paper, facial tissue, packaging board stock) garner a retail market value that is too high to consider burning in bulk as fuel. Kleenex facial tissue retails for $2.00 or more for a 200-count, 300-gram box, which is $6,048/ton.51 This equates to ~$2,400 per ton of feedstock biomass, considering the typical 40% finished fiber yield of a paper mill.52 Fuel ethanol retails at the pump for ~$2.50/gal, which equates to $250 per ton of corn kernels or $175 per ton of stover. Clearly, papermaking is the better investment of money, energy, and cellulosic biomass.
EROI Assessment of Corn Stover Ethanol
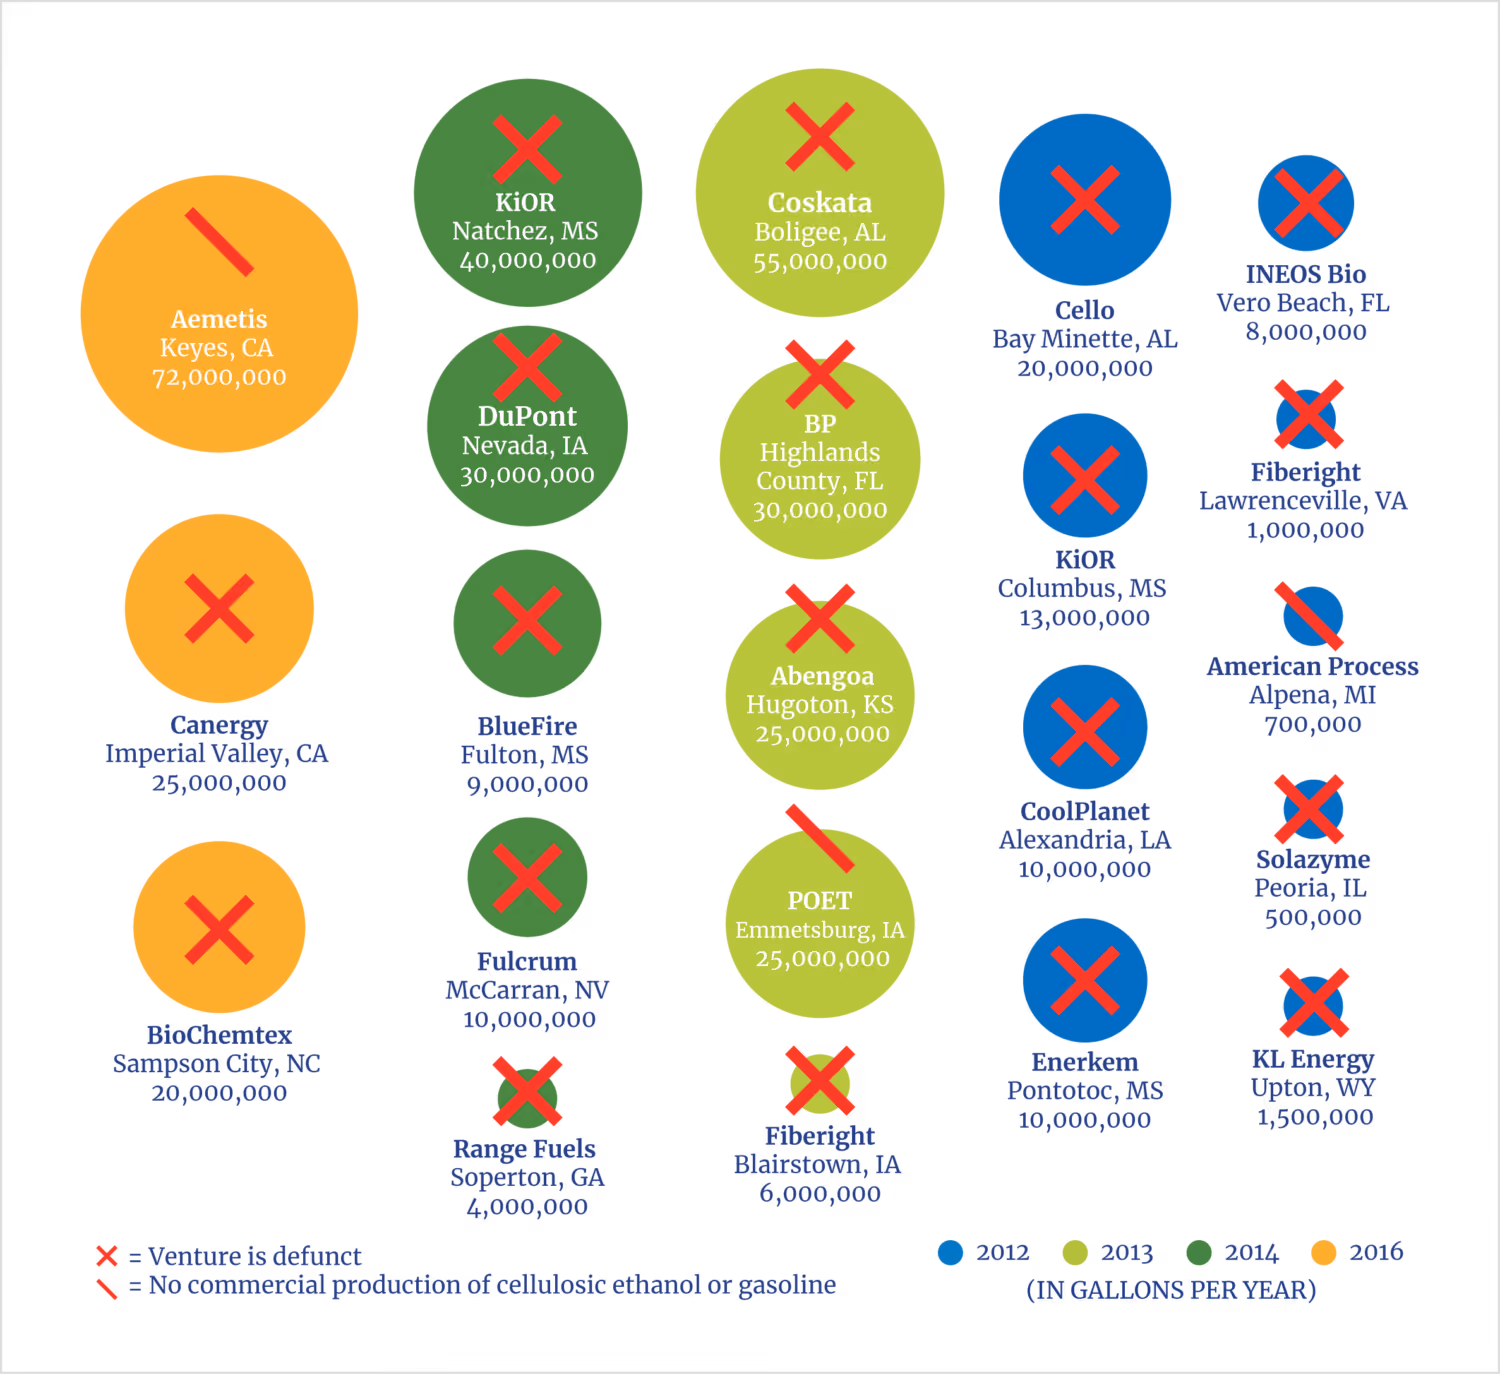
Just as it is difficult to determine the true EROI for corn starch ethanol due to its heavy reliance on fossil fuels, it is similarly challenging to ascertain the EROI of corn stover ethanol because it is so dependent on the corn starch life cycle. With feedstock and saccharification costs that are both multiples higher for corn stover ethanol, it is reasonable to deduce that its EROI must be correspondingly lower. The failure of deep-pocketed industrial leaders such as DuPont, POET, and Abengoa to deliver cellulosic ethanol at scale with giant custom plants built in the very heart of the Corn Belt further underscores fundamental chemical and physical limitations that result in a deeply negative energy balance and an EROI well below 1:1 (see figure 14).
Figure 14. U.S. Attempts at Cellulosic Ethanol and Renewable Gasoline
EROI of Energy Alternatives
For environmental, climate, and societal benefits, industries and governments need to choose the highest EROI options they can, particularly for their energy sources. Figure 15 presents the EROI menu of U.S. energy sources.53
Figure 15. Energy Return on Investment of U.S. Energy Sources
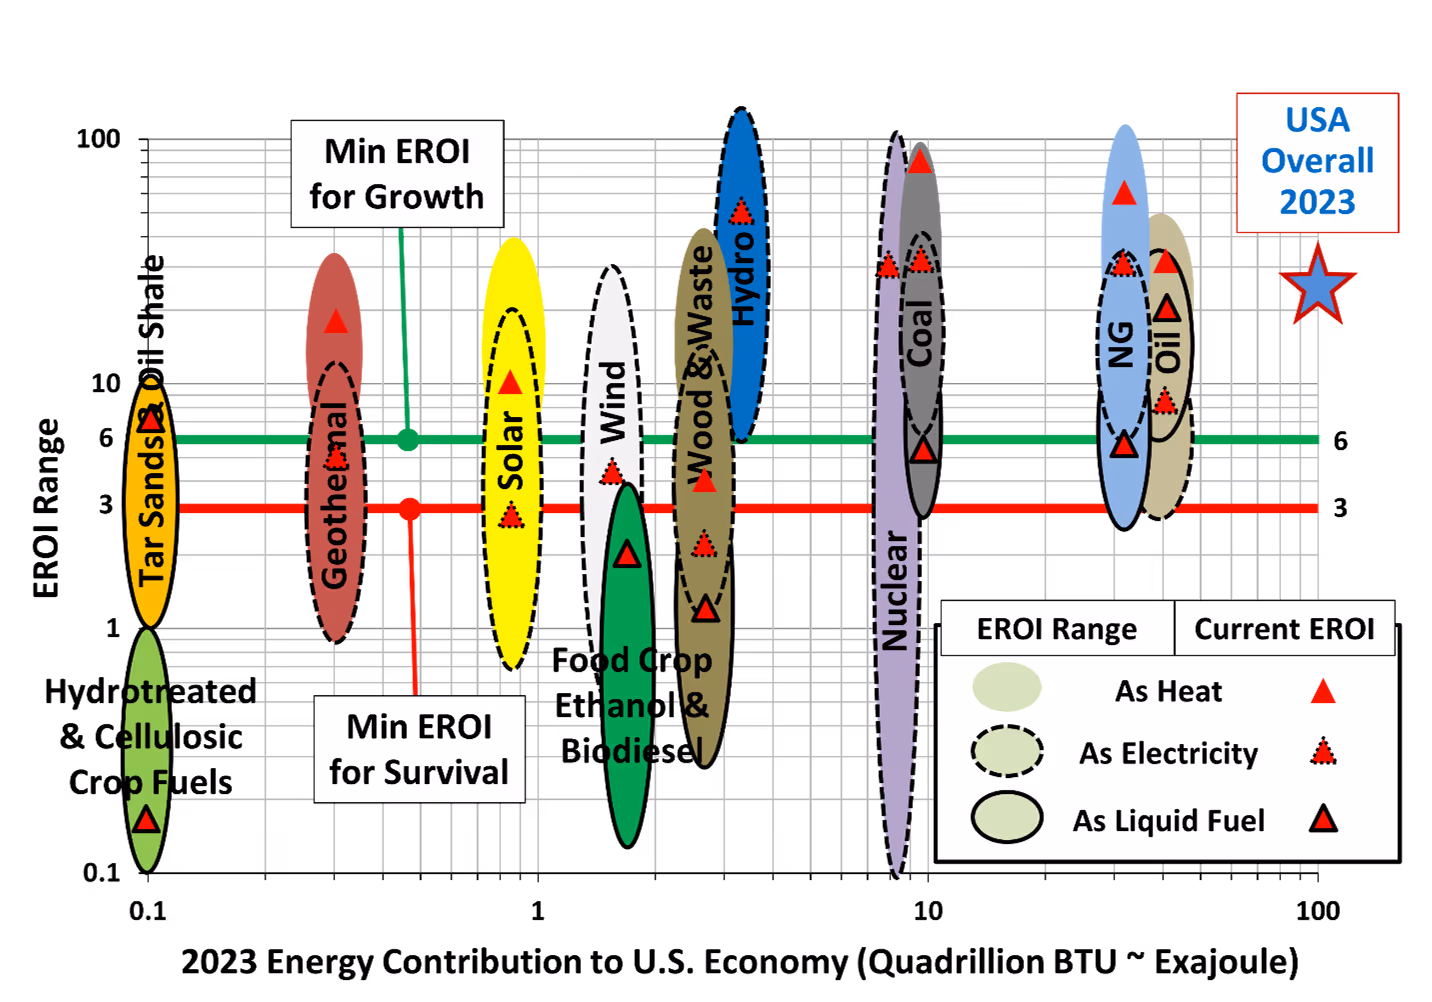
Figure 15 is logarithmic in both axes. The vertical axis shows EROI, and the horizontal axis represents the amount of energy contributed to the national economy by each energy type. The vertical ellipses show historical ranges of each energy type, whereas the red triangles indicate an approximate current average EROI. As the legend clarifies, there is a separate EROI range for each fuel, depending on its use case-whether consumed in its native form as simple heat, converted to electricity, or refined into a liquid fuel. Natural gas and petroleum currently provide more than two-thirds of U.S. primary energy and are nearer to their upper EROI bounds, thanks to improved efficiencies in exploration and production that have unlocked enormous source rock formations (tight shale, sub-salt) for cost-effective extraction. Conventional corn ethanol EROI is up modestly from the 1.25:1 EROI assessed 13 years ago, primarily due to increased use of natural gas, efficiency gains in newer plants, and recent shifts in coproducts from livestock feed to biomethane.54 There have not been any breakthroughs in creating liquid cellulosic fuels or hydrotreated drop-in fuels, and these remain net energy-negative.
As the ellipses indicate, figure 15 is much more precise in the horizontal energy scale-with values that are well known to small tolerances and are regularly published by government sources-than it is in the vertical axis, which has large uncertainties that arise from the unique circumstance of each facility, varying study methodology and boundary conditions, and even definitional debates among researchers. One key observation that influences this figure is that the items on the left-from geothermal power to cellulosic fuels-have an inverse relationship between production scale and EROI. They can work well at demonstration scale in geographically optimal locations, but these niches are rapidly filled, and attempts to further scale production offer diminishing returns. The figure is biased toward showing EROI on a commercial scale, since that is the scale most relevant to addressing looming energy needs.
EROI is also dependent upon infrastructure. For example, natural gas in the United States has far higher EROI than in nations without comparable pipeline infrastructure in order to easily distribute it to a high fraction of industrial, commercial, and residential consumers. Figure 15 is best used as a relative reference between energy sources in the U.S. rather than for extracting absolute values. It complies with seven of the eight points of emerging consensus among EROI researchers.55 As a final caveat, this figure represents the author's synthesis of the evolving EROI literature that is tempered by an understanding of the interplay between thermodynamics, biochemistry, and economics.
Emissions
Environment and Human Health Endangerment
It is sobering to examine the EPA's own regulatory impact analysis (RIA) of the RFS program that it created and to recognize how damaging the agency acknowledges it to be to the environment and human health. As officially documented in 2010, and based on extensive modeling, the EPA projected that full implementation of RFS by 2022 would increase ozone by 0.12 parts per billion, PM2.5 (fine particulate matter) by 0.002 micrograms per cubic meter, corn prices by 8.2%, soybean prices by 10.3% (due to farmers shifting to corn production), nitrogen runoff by 1.43 billion pounds, phosphorus runoff by 132 million pounds, and adult mortality from increased air pollution by up to 245 cases per year.56
This report has already discussed the heightened potential for groundwater and surface water pollution due to ethanol-blended gasoline-a concern that the EPA has refused to address-as well as the Reid Vapor Pressure fuel waiver that was refused for petroleum octane boosters but granted to ethanol. Recent fleet vehicle tests by the California Air Resources Board have found that the amount of toxic acetaldehyde in tailpipe emissions increases with higher ethanol blend fractions.57 Volatile organic compounds like acetaldehyde are also highly reactive surface ozone promoters. The EPA predicted a reduction in hydrocarbon vapors-specifically, carcinogenic aromatics such as benzene-as ethanol displaced gasoline production. However, gasoline production reductions never materialized. Instead, U.S. refinery output has increased by a total of 1 million barrels per day since 2005. The gasoline displaced by ethanol has simply been redirected into exports, which now total more than 13 billion gallons per year.58 While tailpipe emissions of hydrocarbons may have decreased, upstream emissions from the rest of the petroleum life cycle have increased, and the net impact of RFS has been higher air pollution. Of course, these known and tolerated polluting impacts were considered acceptable trade-offs to reduce GHG emissions. So how has that effort progressed?
GHG Emissions
In its 2010 RFS final rule and the associated RIA, the EPA laid out the complex modeling and calculations it used to demonstrate to Congress how the program would meet its statutory mandate to reduce GHG emissions. But several sweeping caveats and indefensible assumptions reveal how unserious this goal has been from the outset.
First, the EPA granted GHG-reduction compliance waivers to all corn ethanol biorefineries that were operating or had begun construction before December 19, 2007 and completed construction before December 19, 2010.59 These plants are exempt from the modest minimum threshold that requires their life-cycle GHG emissions to be at least 20% lower than those of conventional fossil fuels. Under this section 80.1403 waiver, almost 90% of the biorefinery fleet in 2014 was exempted,60 and that fraction has changed little. According to the EPA's July 2025 list of operating plants, 198 waivered biorefineries are still producing ethanol for RINs, including 17 foreign plants in Brazil and Canada.61 This waivered ethanol constitutes the majority of the 15-billion-gallon annual RFS-mandated production.
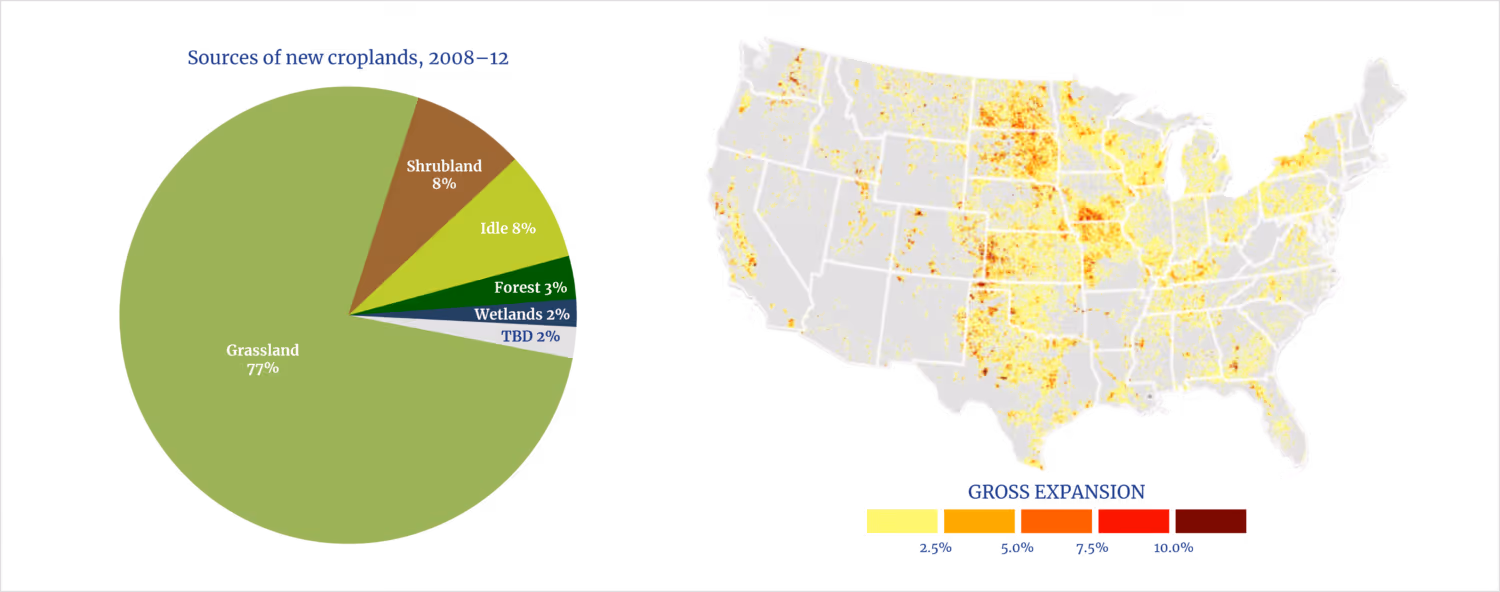
Second, EPA assumed for its RIA calculations that energy farming in the United States could and would be added to food farming without expanding cropland, simply by postulating-without evidence-that farm productivity would increase apace with demand and the same acreage would supply both. The reality is that U.S. farms already operate at peak intensity, and there is no room to squeeze additional crops on existing land. A 2014 report by the Environmental Working Group held the EPA accountable for more than 23 million acres of grassland and wetlands that its research revealed had been converted to biofuels cultivation between 2008 and 2011, releasing an estimated 85-236 million metric tons of CO2-equivalent GHGs, as well as raising some food and agricultural commodity prices by 20%-40% due to competition with food agriculture (see figure 16).62 Satellite imagery studies have backed up these findings.63
Figure 16. RFS Land-Use Change: Cropland Expansion
Third, the EPA grossly underestimated indirect land-use change around the world,64 by which U.S. farmers who have shifted from food to fuel cause overseas farmers to fill the food import gap by putting new local land into cultivation, usually with lower efficiency, higher GHG emissions, and greater environmental damage. The EPA justified this faulty assumption using unrealistic models that presumed that people worldwide would simply accept eating fewer calories if food were to become scarcer and that did not account for water competition between fuel farming and food farming.65 To its credit, the agency pledged to commission a National Academy of Sciences study to review its RFS rule. In 2011, the National Research Council responded with a raft of negative findings-including that the EPA had failed to treat energy and food as global markets; that its underestimation of indirect land-use change emissions could more than offset U.S. domestic emissions reductions; and that biofuels, in general, might not even be a viable strategy for attaining GHG reductions.66 Within a year, the German National Academy of Sciences Leopoldina piled on as well, revealing its own life-cycle modeling that showed biofuels from food crops were being cultivated intensively rather than sustainably and generally had higher GHG emissions than those of fossil fuels.67 Like its U.S. counterpart, the German National Academy questioned the whole strategy of biofuels and recommended that Germany abandon its 10% biofuel targets.
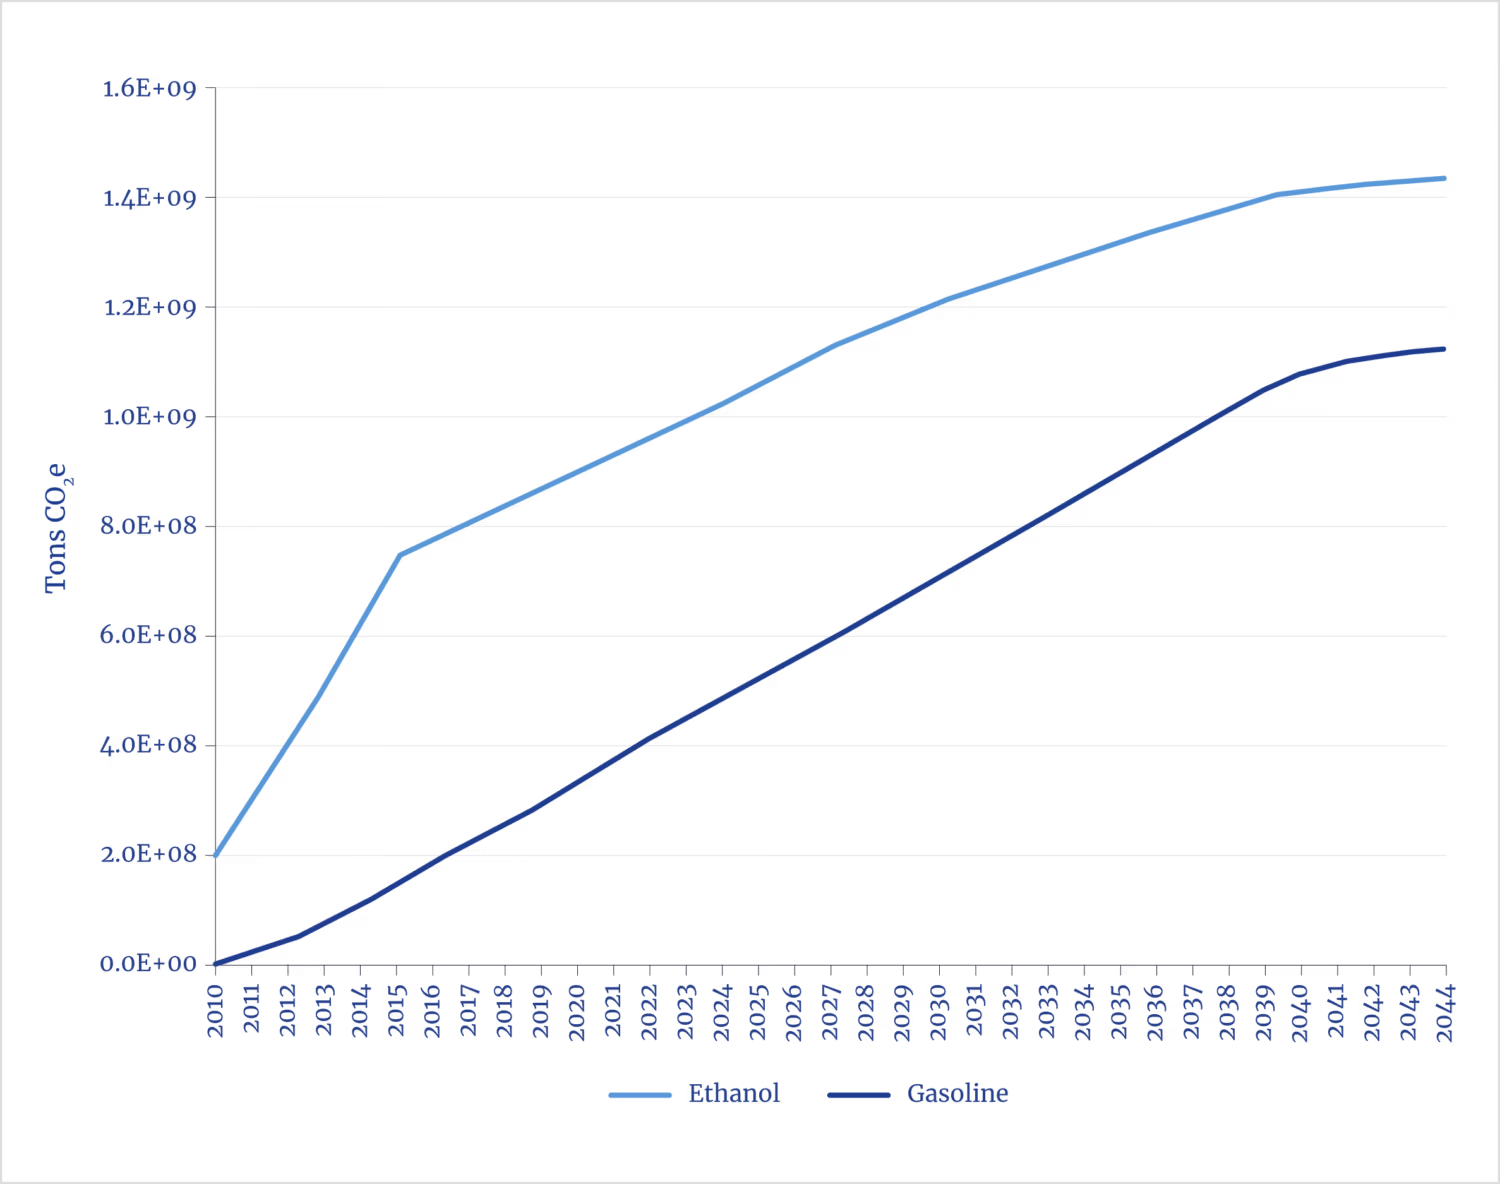
In a 2013 hearing before the House Committee on Energy and Commerce, the Clean Air Task Force delivered the coup de grace. Its chief legal counsel revealed, using the EPA's own data from the RIA, that the published claim regarding the RFS program achieving a net 21% GHG emissions reduction was based on an accounting trick. The EPA was ignoring all emissions from land-use change and new biorefinery construction of the ramp-up years and was counting emissions only 30 years forward, beginning at the 2022 peak of RFS biofuel production. This mythical scenario was further compounded by the assumption that an entire fleet of superefficient biorefineries would suddenly come online in 2022, instead of today's 2026 reality of myriad grandfathered plants operating under perpetual waivers. Accurately counting all emissions since 2010-while still using the EPA's own calculation methodology-shows that RFS has instead increased GHG emissions by 28% above the gasoline reference case, and there is not a realistic trajectory to ever break even (see figure 17).68
Figure 17. Cumulative CO2e Emissions: RFS Corn Ethanol Versus Gasoline
The extreme irony of these revelations is that RFS was created under the Clean Air Act to protect public health and welfare from air pollution-yet it increases emissions of both criteria pollutants and GHGs.
Other nations have taken action to curtail first-generation biofuels based on similar findings. In 2015, the European Parliament and the Council of the European Union amended their directives for starch-based biofuels, shifting from a 10% motor fuel target to a 7% cap.69 Food-based biofuels are estimated today to constitute only 4%-6% of Europe's motor fuel supply.
Market Manipulation
Federal Government Support for Ethanol Supply
Tariffs
The long-term default posture of the U.S. federal government has been effectively very positive toward domestic ethanol interests. The Tariff Act of 1789-passed by the First Congress-set a contemporaneously steep duty of $0.08 per gallon on distilled spirits, and the nation has continuously maintained an ethanol tariff ever since.70 Since the 1989 implementation of the Harmonized Tariff Schedule of the United States, there has been a flat tariff of 2.5% ad valorem providing a baseline level of protection for domestic distillers that continues to this day.71 The Renewable Fuels Association successfully lobbied for an additional $0.54-per-gallon import tariff, applied from 1980 through 2011, to protect U.S. producers against ethanol imports from Brazil and other nations.72
Farm Program
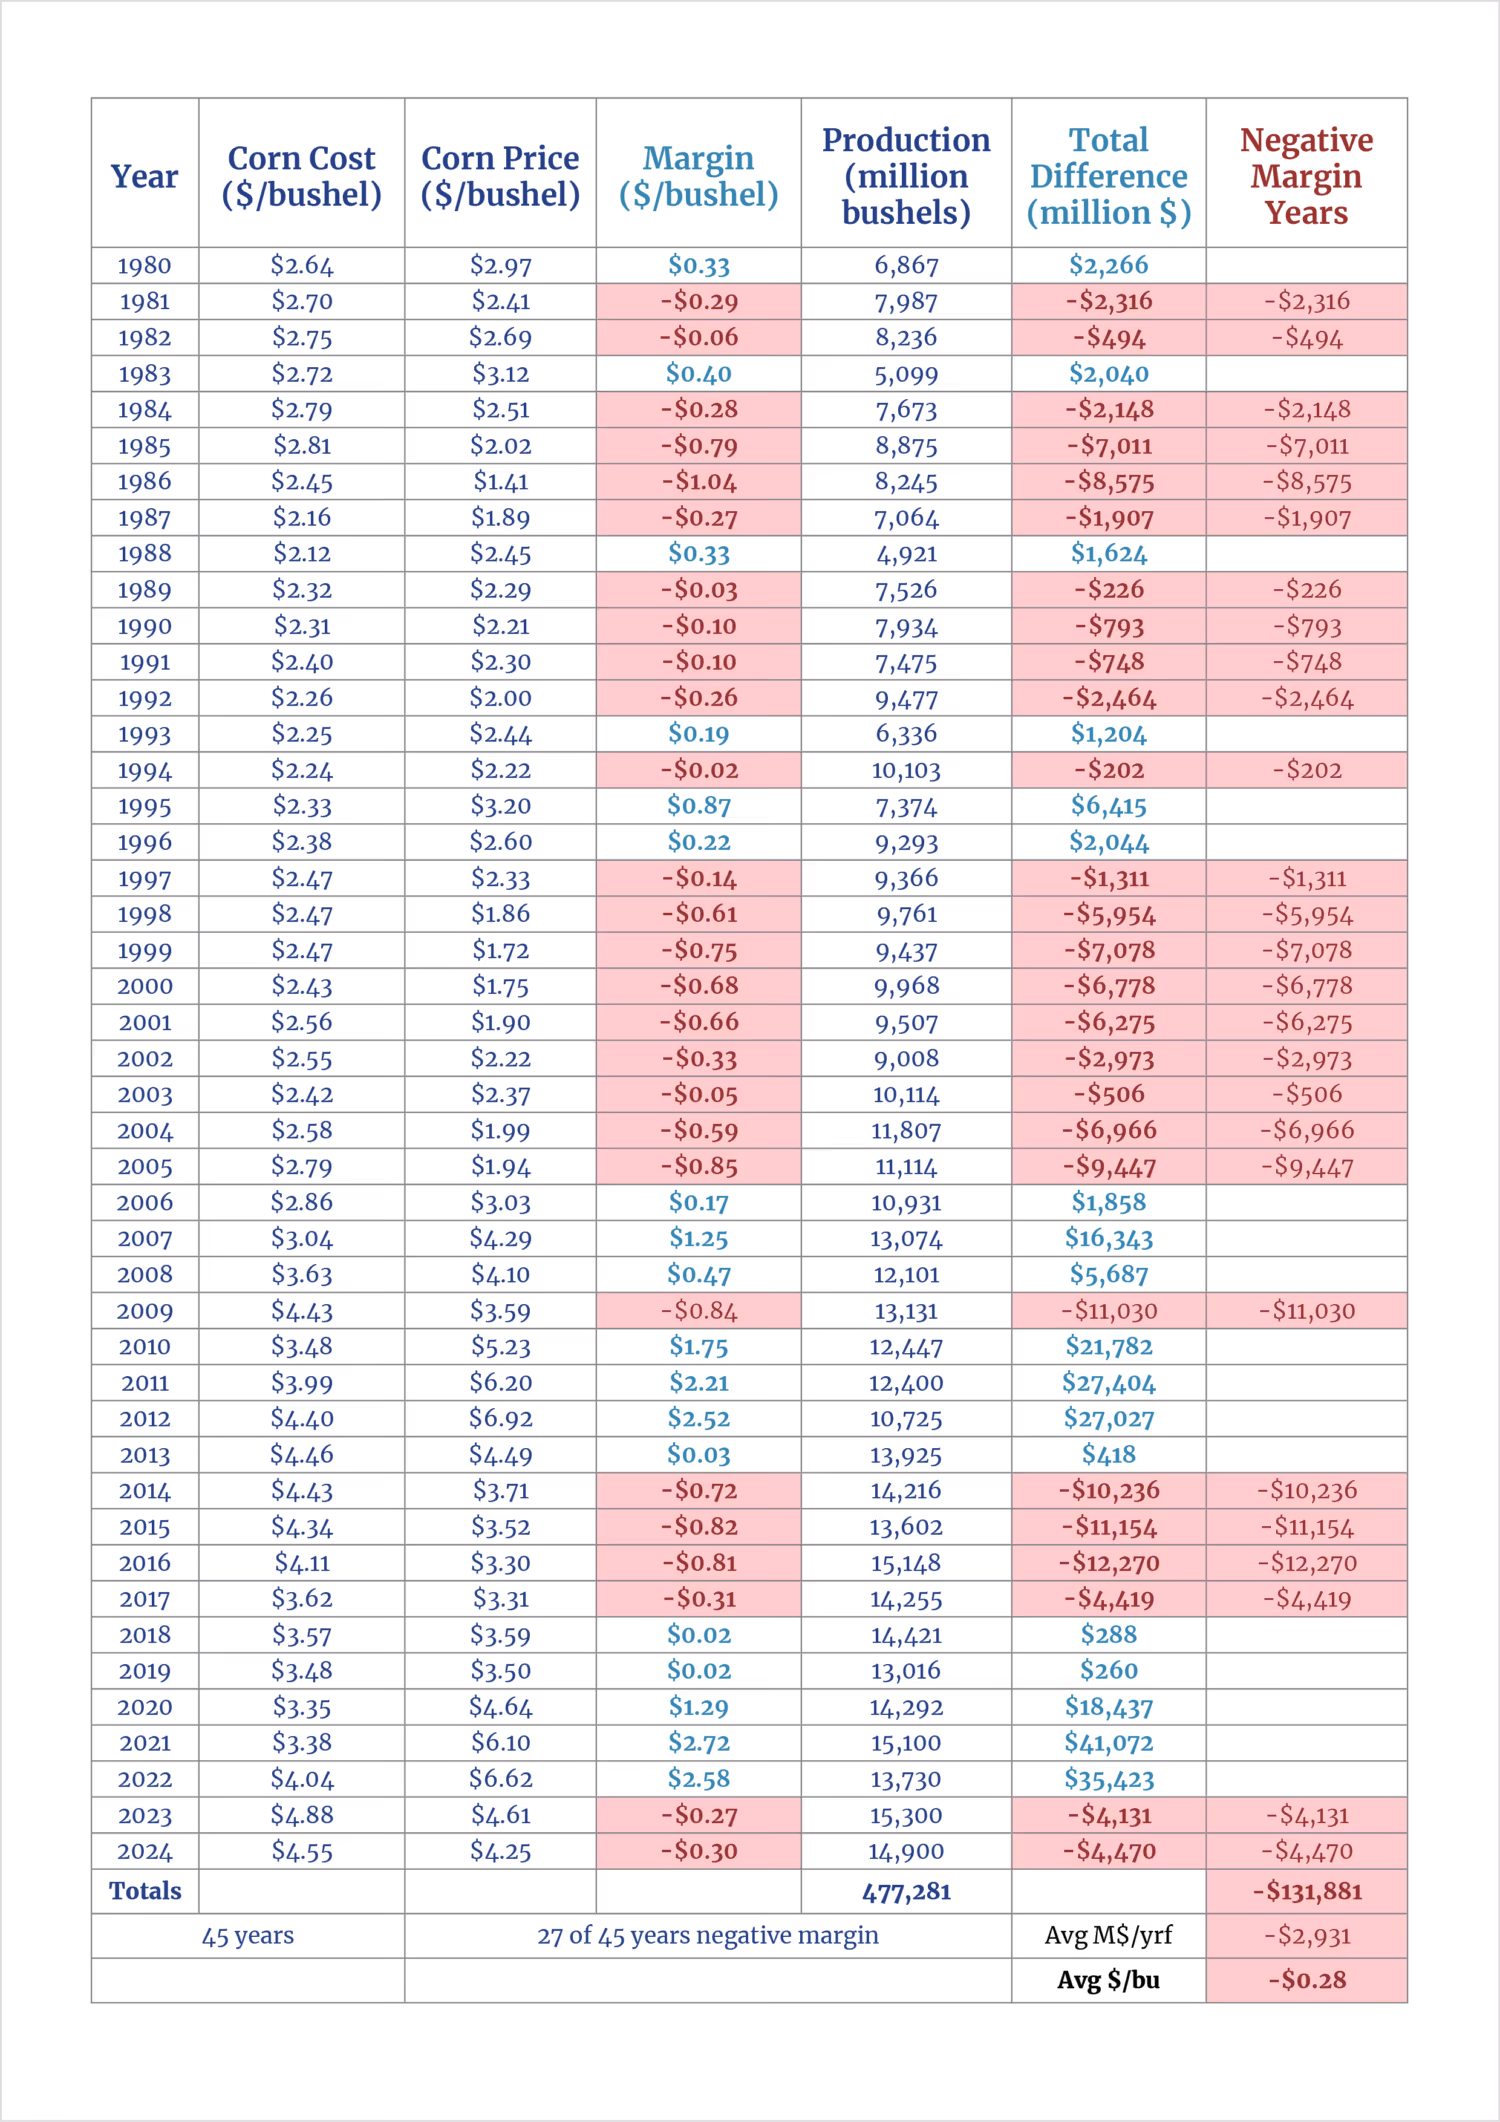
Generations of Farm Bill pro-agriculture policies and subsidies have also directly subsidized ethanol refineries by artificially reducing their feedstock prices. The USDA, U.S. Government Accountability Office (GAO),73 Food and Agricultural Policy Research Institute, and a wealth of economists all recognize that the quinquennial Farm Bill's perpetual subsidies contribute to mild overproduction and some reduction in the price of corn. Analysis of historical corn prices versus costs of production revealed that costs exceeded market price for 27 of the 45 years since 1980.74 With the conservative assumption that this pattern could not exist if federal subsidies did not make farming during the loss years, on balance, at least a break-even proposition, the minimum effective subsidy across this period must be the cumulative dollar gap between corn revenue and cost of production in the loss years. That gap, without inflation correction, totals $132.8 billion-an average annual subsidy of $2.9 billion to corn growers. Such support equates to a pass-through benefit to their customers that reduces the price of corn by an average of $0.28 per bushel. Using a yield of 2.9 gallons per bushel, this translates to a biorefinery subsidy of approximately $0.10 per gallon (see table 1).
Table 1. Farm Program Corn Subsidy Calculations, Illustrated Using Iowa Data
Tax Expenditures
More than 80% of U.S. government subsidies to the energy sector have historically taken the form of tax expenditures such as tax exemptions and nonrefundable tax credits.75 This approach is politically expedient because taxes not collected are less visible and much harder to quantify than direct expenditures that deplete money already on the ledger of the U.S. Department of the Treasury. These measures may appear less like subsidies but are just as real as direct payments.
Figure 18. U.S. Gas Lines During 1973-74 Embargo

Source: AP Images/Marty Lederhandler. Reprinted with permission.
True to pattern, the first federal government response to the 1970s oil crisis (see figure 18) was a tax expenditure in the Energy Tax Act of 1978, which defined the term gasohol and introduced a $0.40-per-gallon excise tax exemption for ethanol blended with gasoline.76 With a 1:10 blending ratio, this amounted to a $0.04/gal cost reduction for gasohol versus gasoline-about 6% below the contemporary average pump price of $0.63/gal.77 A series of congressional bills sustained and modified the benefit over the following decades.78 Some research and development funding, plus three tax credit programs for small ethanol producers, blenders, and retailers, added $2-$3 billion in subsidies through 2000.79 In 2005, the exemption was restructured as a tax credit to alleviate the increasing loss in excise tax revenue to the Highway Trust Fund.80 The Volumetric Ethanol Excise Tax Credit was allowed to expire at the end of 2011, after it was broadly recognized as redundant to the volumetric mandates of the EPA's new RFS. At its 2009 peak, this tax expenditure is estimated to have cost the Treasury approximately $5 billion per year, with a lifetime value of $45 billion.81
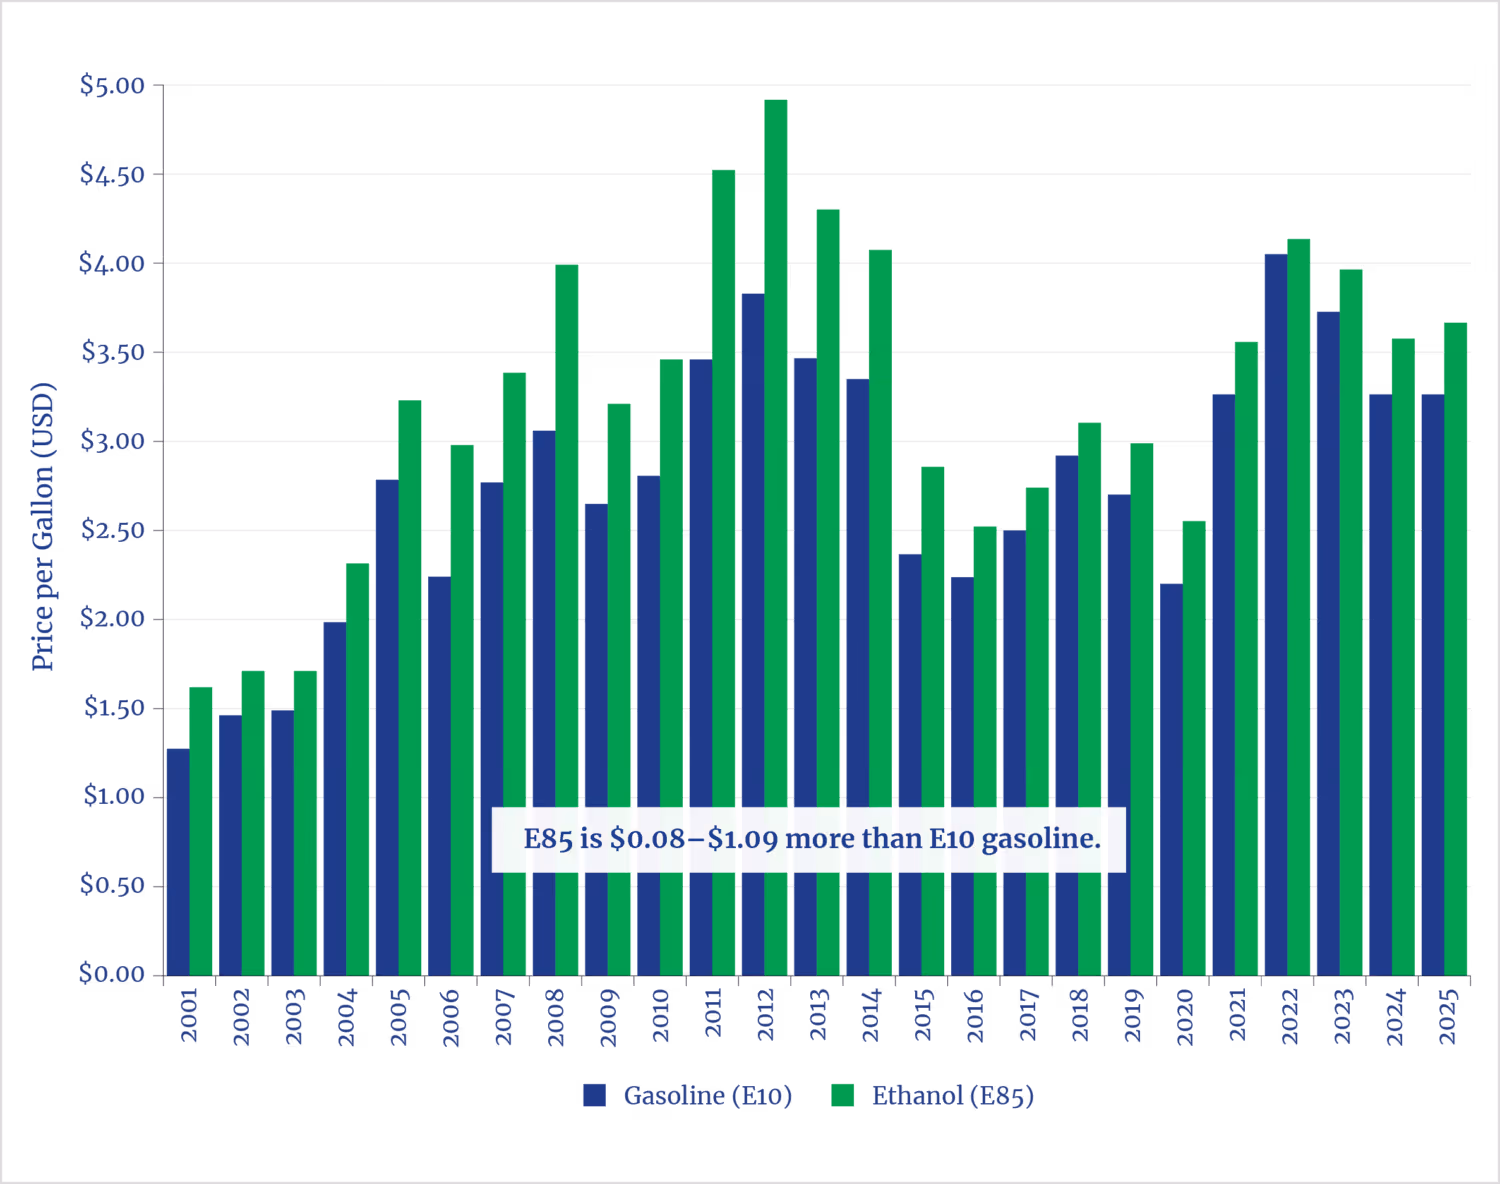
The first-order effect of these ethanol tax expenditures was not to reduce fuel prices but to raise the price of ethanol by the amount of the exemption or credit. This is because ethanol is delivered at the pump as a gallon-for-gallon fungible substitute for gasoline in the United States, but its power to affect gasoline prices is completely dwarfed by the exogenous price forces of the global crude oil market. In other words, oil is the dog that wags the ethanol tail, and the excise tax break simply gives fuel distributors room to pay a bit more for a gallon of ethanol than for a gallon of gasoline in the blend and still break even by collecting the difference as a tax benefit.82 Ethanol, an alcohol, has two-thirds the combustion energy content of the pure hydrocarbons that constitute the rest of the gasoline formula. Figures 19 and 20 show that even after decades of competition, ethanol has maintained a stubborn price premium over gasoline in both the wholesale and retail markets when properly compared on an equal-energy (equal miles in the tank) basis.
Figure 19. Persistent Wholesale Price Premium for Ethanol: 12-Month Price Comparison

Figure 20. Persistent Retail Price Premium for Ethanol: U.S. Price per Gallon of Gasoline-Equivalent Energy
Stacking the ethanol import tariff atop the excise tax exemption did indeed reduce importers' competitiveness by selectively subtracting the tariff amount from the importer's margin without affecting that of the domestic producer. But this strategy of reducing competition-together with the increased costs that surviving importers had to pass on-served to increase, rather than decrease, domestic ethanol prices.83 The combination of these producer-friendly government market interventions promoted the growth of the corn ethanol industry while having little effect on national motor fuel supply or prices.
Other Legislation
The Crude Oil Windfall Profit Tax Act of 1980 decisively segregated ethanol fuel and plants from onerous Internal Revenue Service (IRS) rules and taxes for distilled spirits beverages.84 The Energy Security Act of 1980 set a goal of producing 10% of the nation's motor fuel supply as ethanol by 1990 and granted the U.S. secretary of agriculture extraordinary power to issue million-dollar insured loans to those who wanted to build small ethanol refineries.85 Needless to say, this unleashed an immediate wave of ethanol refinery construction. The number of corn ethanol refineries in the nation increased from fewer than 10 in 1980 to 163 in 1984. But by the end of 1985, only 74 remained operating after the oil price crash caused by a global petroleum production glut.86 National ethanol production had reached the World War II-era peak of approximately 600 million gallons in 1985 and did not retrench, but further growth was slow and remained linear until the turn of the century. With the U.S. Customs Service, IRS, and USDA fully engaged in support of ethanol, the federal government found even more leverage in another agency: the EPA.
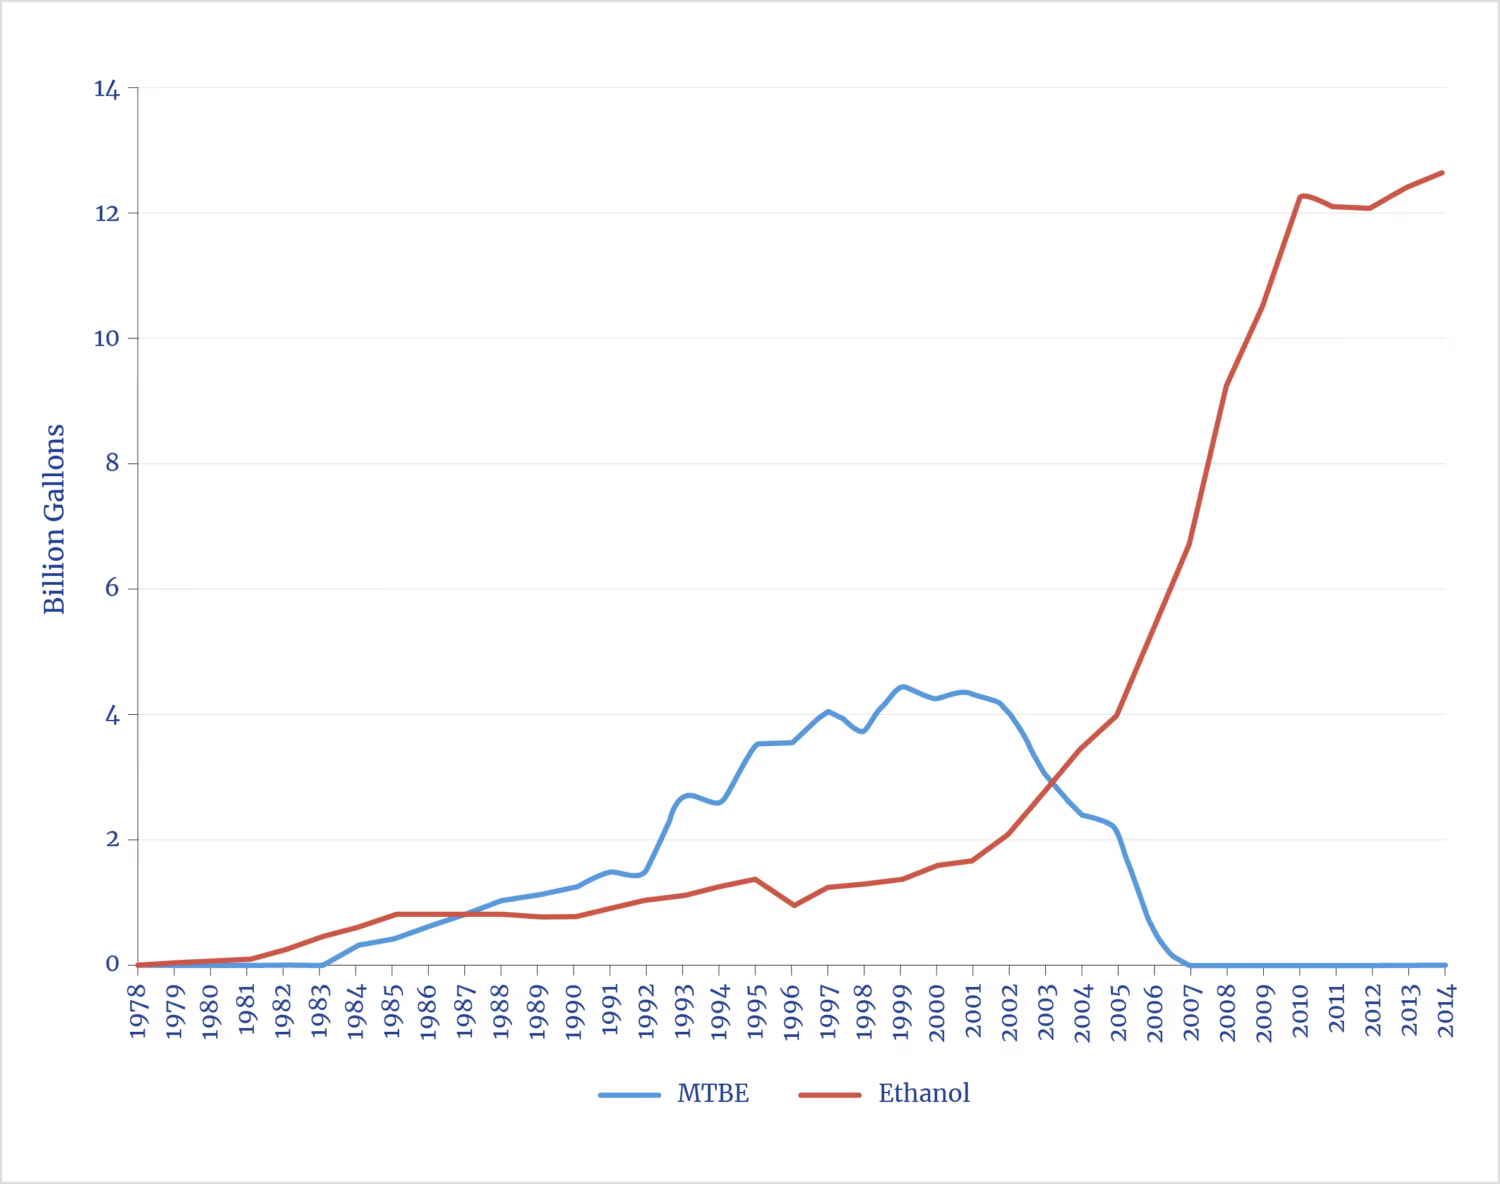
As the EPA pursued the phaseout of lead from gasoline throughout the 1980s, petroleum refiners initially substituted cheap and readily available aromatic hydrocarbons.87 Congress redirected the market in 1990 with Clean Air Act amendments-ostensibly to reduce unhealthful emissions-that reformulated gasoline to essentially eliminate aromatics. The new rules uniquely declared aromatic hydrocarbons to be toxins (though all components of gasoline are toxic), set limits on fuel volatility (i.e., Reid Vapor Pressure) to reduce evaporative emissions, and required the addition of oxygenates to promote more complete combustion and reduce carbon monoxide in tailpipe exhaust.88 The industry responded by substituting methyl tert-butyl ether (MTBE), a less volatile, octane-boosting, and oxygenating hydrocarbon that was fully compatible with refinery and pipeline infrastructure and had never been declared a health risk. In 1997, after years of adoption, MTBE began to be reported in groundwater. Extremely bitter and odorous, MTBE is easily detected-even in concentrations well below levels that threaten public health-and exposed a chronic, nationwide problem with leaking underground fuel storage tanks. The EPA rightly initiated a national underground tank inspection and leak mitigation program to protect groundwater but also blamed the messenger by vilifying MTBE. State governments began unilaterally banning it, and refineries finally began shifting to ethanol-an octane booster and oxygenate that had been avoided due to its higher cost and incompatibility with existing refinery and pipeline infrastructure. By 2006, MTBE had been completely removed from the gasoline supply and ethanol had its first permanent foothold (see figure 21). However, this ethanol Cinderella story has a darker side.
Because ethanol is infinitely soluble in both water and fuel, it bridges the gap between the two and allows hydrocarbons that would normally float on water to mix in.89 This creates a challenge for managing fuel spills on water, which can no longer be easily contained with floating booms, and for addressing leaks from underground tanks, in which contamination plumes travel faster and farther through moist soil and penetrate deeper into aquifers. Without MTBE's extreme odor and bitterness to sound the alarm at just a few parts per billion, groundwater contamination is harder to detect until it becomes a health risk.
Figure 21. U.S. Oxygenate Consumption, by Year: 1978-2014
The EPA received evidence in 1999 that ethanol may extend gasoline soil and groundwater pollution plumes by 25%-40% and inhibit natural gasoline biodegradation in the soil. Yet the agency has not established national monitoring for environmental contamination from ethanol, as it did for MTBE.90 Ethanol has also received regulatory favor with other special treatment.
Adding ethanol also increases fuel volatility and emissions of toxic compounds, including formaldehyde, acetaldehyde, and nitrogen oxides that contribute to smog. Congress and the EPA have granted ethanol a standing Reid Vapor Pressure waiver that they refused for aromatics. A cost-benefit analysis of alternative fuel formulations by the University of California, Santa Barbara in emissions-conscious California found ethanol gasoline more carcinogenic than aromatic gasoline, with the healthiest option being gasoline without ethanol or any oxygenation.91 An EPA-commissioned, blue-ribbon panel of experts in 1999 also recommended discontinuing the use of all oxygenates in gasoline.92 All U.S. cars built since 1993 have catalytic converters, oxygen sensors, and engine computers that already control their carbon monoxide emissions, so oxygenation contributes only disadvantages by increasing smog-causing evaporative emissions and reduces fuel economy by displacing hydrocarbons with oxygen in the fuel tank.
Congress rescinded the fuel oxygenation requirement in the Energy Policy Act of 2005, so the current rationale for ethanol in gasoline-aside from RFS-is purely as an alternative octane booster.93
Federal Government Support for Ethanol Demand
Renewable Fuel Standard
RFS represents the federal government's largest effort to manipulate the ethanol market to date and is the first program to address the demand side. In 2005, the RFS blending (i.e., consumption) mandate added a complex third dimension to the incentive equation. Empirically, the production curve in figure 1 shows that RFS mandates and the associated RIN market have been much stronger economic forces than the tax expenditures and tariffs. Most informative is how conventional corn ethanol met the blending mandate with production perfectly matching the 15-billion-gallon-per-year cap set for 2015, but it has not demonstrated any ability to sustain production above the subsidized level for the past 10 years. It is also telling that cellulosic ethanol and renewable gasoline from cellulosic feedstock have not emerged in meaningful quantities despite billions of dollars in private and government spending on research and development and scores of completed biorefinery construction projects, including several completed commercial-scale plants.
E85 and Flexible-Fuel Vehicles
The obvious way to create a market for ethanol fuel is to create ethanol-fueled vehicles. Congress has enacted a whole-of-government approach to this end, including directing the actions and funding by various federal agencies-DOE, USDA, DOD, U.S. Department of Transportation, U.S. Department of Commerce, Treasury, U.S. General Services Administration, and EPA. Some highlights:
- In 1978, a watershed legal determination was made without court, judge, or hearing-in fact, without action. By failing to respond within the statutory 180 days, not commissioning research, and not completing the formal review process, the EPA effectively granted a Clean Air Act waiver request from a small company named Gas Plus, Inc. to blend ethanol in gasoline in a 1:10 ratio and sell it as gasohol. In a subsequent memorandum, the EPA clarified that this inaction constituted a broad waiver94 of the Clean Air Act that opened up the entire American fuel market to gasohol.
- In another crafty move, the 1988 Alternative Motor Fuels Act used a fuel economy computation gimmick in conjunction with the EPA's Corporate Average Fuel Economy (CAFE) mandates to incentivize automakers' production of FFVs-cars that can run on anything between 0% and 83% ethanol blends of gasoline.95 The EPA was instructed to count only the gasoline portion of the fuel when computing each vehicle's fuel economy, a creative method that enabled E85-capable FFVs to earn miles-per-gallon ratings above 100 and offset the automakers' highly profitable but gas-guzzling SUVs, trucks, and muscle cars.96
- In the Clean Air Act Amendments of 1990, Congress established the Clean Fuel Fleets Program as a mandatory approach for large cities that failed to meet national air-quality standards to achieve compliance. Certain centrally fueled fleets of 10 or more vehicles were required to maintain a specified percentage of clean-fuel vehicles, including high-ethanol blends.97
- In the Energy Policy Act of 1992, Congress defined alternative fuel to include blends that contain 70% or more ethanol. It then directed the U.S. secretary of energy to acquire alternative fuel vehicles for the federal fleet, establish a public information program advocating alternative fuel use to the general population, assist states with development of their own adoption programs, and establish a low-interest loan program for small businesses to increase their use of alternative fuel vehicles. The act further directed the U.S. secretary of transportation to enter into cooperative agreements and joint ventures with larger municipal governments, school districts, and regional transportation authorities to demonstrate the feasibility of alternative fuel fleets.98
- The Energy Independence and Security Act of 2007 required every federal fueling station to install at least one renewable pump.99
- The American Recovery and Reinvestment Act of 2009 provided $300 million toward alternative fuels, including funding 67 FFV gas stations.100
- In 2015, the USDA supplied $82 million in cost-sharing grants for the installation of E15 and E85 pumps at 865 ethanol stations.101
- In recent years, the EPA has issued numerous E15 waivers that made this blend available at 3,189 stations nationwide (less than 3% of all gas stations).102
Despite these initiatives and the additional subsidies in the IRA, the adoption of FFVs remains very low and the use of high ethanol blends is even lower. E85 is available at fewer than 6,200 of the more than 160,000 gas stations in the United States (~4%), and these stations are geographically concentrated in the Corn Belt and California.103 Only about 22 million of the 300 million on-road, registered vehicles are E85-capable (~7%). Fuel consumption statistics indicate that fewer than 5% of FFVs are regularly fueled with E85, and these are mostly fleet vehicles. A survey found that only one in three private owners knew that their vehicle was rated for E85.104 The only significant use of E95 was a municipal bus fleet in California, which then abandoned it in 1996 due to fuel and maintenance costs.105 The availability of E15 has increased in recent years; however, this growth has been dwarfed by the shift toward electric vehicles, a trend also mirrored by automakers. American citizens are still voting with their pocketbooks. Until ethanol achieves a genuine price advantage over gasoline or consumer choice is further constrained by government intervention in the marketplace, the existing Farm Bill subsidies and RFS mandates will continue to define the upper limit of ethanol fuel production.
Conclusion
The U.S. federal government has long championed fuel ethanol interests and the agricultural corn production ecosystem that currently supplies the majority of bioethanol. Over the past 35 years, multi-department subsidy and regulatory regimes have built a conventional ethanol industry that produces exactly the subsidized and mandated amounts-but has not demonstrated independent viability to operate, let alone grow, without ongoing government market intervention.
Despite equally generous and forceful government support for lignocellulosic ethanol and renewable gasoline, plus tremendous private intellectual and capital resources, no meaningful production of these fuels-the true goal of RFS-has materialized. As of 2017, 89% of annual corn ethanol production was still grandfathered by the EPA to require no reduction in GHG emissions relative to those of fossil fuels.106 That fraction likely remains the same today, as there is neither incentive to shut down the plant nor impetus to upgrade the product for a situation in which a locked-in regulatory advantage already protects producers as well as their ethanol and RIN customers. Based on this perpetual grandfathering, GAO correctly predicted in 2019 that the EPA would not meet its Clean Air Act mandate for RFS to achieve a 20% GHG emissions reduction.107 Rather than issuing a course correction to the EPA and its RFS as they missed the 2022 deadline for this statutory mandate with emissions going up instead of down, Congress instead created additional potential subsidy paths with new section 45Z Clean Fuel Production Credits under the IRA.
RFS was created under the Clean Air Act but has increased both health-harming criteria pollutants and GHG emissions. Its secondary purpose of enhancing energy security was obviated by a resurgent domestic petroleum industry, as the United States now exports refined petroleum with more than double the total energy content of all RFS-produced fuels.108 U.S. corn ethanol has increased food prices, increased the strain on domestic water resources, and increased harmful land-use change around the world. These facts undermine the legal basis for the continued existence of RFS as a program run by the government agency tasked with protecting air, land, and water quality. It is certainly past time to acknowledge that corn ethanol is not clean, green, renewable, or sustainable; that it has no prospect of reducing GHG emissions or replacing gasoline; and that it represents a huge opportunity cost of taxpayer dollars that could be better spent elsewhere.
Notes
- Renewable Fuels Association, "RFA: U.S. Ethanol Production Set a Record in 2025, New Data Show," Ethanol Producer Magazine, March 2. 2026.
- U.S. Environmental Protection Agency (EPA), "Regulation of Fuels and Fuel Additives: Changes to Renewable Fuel Standard Program; Final Rule," Federal Register 75, no. 58 (March 26, 2010): 14670-904.
- Most of what the EPA now counts as advanced biofuel under RFS is biomethane from waste digesters-the bulk of which is injected into pipelines or burned locally for plant heat and power, with vanishingly little used as feedstock for the extremely complex and expensive process of conversion to pure liquid hydrocarbon drop-in replacements for gasoline, diesel, or jet fuel in transportation use. This incongruously contradicts the Clean Air Act definition of renewable fuel as "fuel that is produced from renewable biomass and that is used to replace or reduce the quantity of fossil fuel present in a transportation fuel." See 42 USC Section 7545(o)(1)(j).
- "U.S. Ethanol Plants, Capacity, and Production," Alternative Fuels Data Center, U.S. Department of Energy (DOE), accessed February 1, 2026, https://afdc.energy.gov/data/10342.
- "Spreadsheet of RIN Generation and Renewable Fuel Volume Production by Fuel Type for the Renewable Fuel Standard," Fuels Registration, Reporting, and Compliance Help, EPA, September 27, 2015, https://www.epa.gov/fuels-registration-reporting-and-compliance-help/spreadsheet-rin-generation-and-renewable-fuel-0.
- A. J. Liebmann, "History of Distillation," Journal of Chemical Education 33, no. 4 (April 1956): 166-73.
- Bill Kovarik, "Biofuels in History," in Biofuel Crops: Production, Physiology and Genetics, ed. Bharat P. Singh (CABI, 2013), 1-22.
- Thomas L. Hungerford, U.S. Federal Government Revenues: 1790 to the Present (Congressional Research Service, 2006), 8.
- Horst O. Hardenberg, Samuel Morey and His Atmospheric Engine (Society of Automotive Engineers, 1992); and Daniel Strohl, "Fact Check: Henry Ford Didn't Design the Model T as a Multi-Fuel Vehicle," Hemmings.com, July 28, 2025. Samuel Morey was the first engine inventor documented to use ethanol as fuel for internal combustion engines, in 1828. Henry Ford's first car, the 1896 Quadricycle, had a hand-built, ethanol-fueled engine. His 1908 Model T, though specifically designed for gasoline-as the contemporary owner's manual confirms-had fuel mixture and spark advance controls that permitted operation on almost any volatile combustible liquid, including ethanol and kerosene.
- Bill Kovarik, "Henry Ford, Charles Kettering and the Fuel of the Future," Automotive History Review, no. 32 (Spring 1998): 7-27, republished online at Environmental History.
- See "International: Petroleum and Other Liquids," U.S. Energy Information Administration (EIA), accessed February 2, 2026, https://www.eia.gov/international/data/world/petroleum-and-other-liquids/annual-refined-petroleum-products-consumption; and "Annual Ethanol Production: U.S. and World Ethanol Production," Renewable Fuels Association, accessed February 2, 2026, https://ethanolrfa.org/markets-and-statistics/annual-ethanol-production. In 2024, global motor gasoline consumption was 419 billion gallons, while global ethanol production amounted to 31.31 billion gallons.
- Frank Uekotter, "The Revolt of the Chemists: Biofuels, Agricultural Overproduction, and the Chemurgy Movement in New Deal America," History and Technology 37, no. 4 (2021): 429-45.
- William "Bill" Kovarik, "Ethanol's First Century," paper presented at the XVI International Symposium on Alcohol Fuels, Rio de Janeiro, Brazil, November 27, 2011.
- See EIA, Monthly Energy Review February 2026 (EIA, 2026), 65, table 3.1. The United States surpassed Russia and Saudi Arabia in crude oil production in 2018 and became a net exporter of petroleum in 2020. In 2025, exports totaled 2.753 million barrels per day or 42.2 billion gallons per year-twice its annual production of all biofuels-and were mostly refined petroleum.
- Stefan Heck and Matt Rogers, "Are You Ready for the Resource Revolution?," McKinsey Quarterly, March 1, 2014.
- Brett Walton, "U.S. Groundwater Losses Between 1900-2008: Enough to Fill Lake Erie Twice," Circle of Blue, May 16, 2013.
- Rachel Becker, "Trump's Office Called 7 Governors to D.C. for Colorado River Talks. Here's What California Said," CalMatters, January 31, 2026.
- U.S. Department of Agriculture (USDA), "Feed Grains Data: Yearbook Tables," dataset, table 4, Economic Research Service, accessed February 12, 2026.
- See Maite M. Aldaya et al., The Water Footprint Assessment Manual: Setting the Global Standard (Earthscan, 2011).
- May Wu et al., Consumptive Water Use in the Production of Ethanol and Petroleum Gasoline-2018 Update, ANL/ESD/09-1 Rev. 2 (Argonne National Laboratory, 2018), 9. Liter per liter is equivalent to gallon per gallon.
- Mesfin M. Mekonnen et al., "Water, Energy, and Carbon Footprints of Bioethanol from the U.S. and Brazil," Environmental Science & Technology 52, no. 24 (2018): 14508-18, 14512.
- "Ethanol Blends," Alternative Fuels Data Center, DOE, accessed March 13, 2026, https://afdc.energy.gov/fuels/ethanol-blends. E85 composition is regulated by the EPA under theClean Air Act.
- "2023 Ford F150," FuelEconomy.gov., accessed January 27, 2026, https://fueleconomy.gov/feg/PowerSearch.do?action=noform&path=1&year1=2023&year2=2023&make=Ford&baseModel=F150&srchtyp=ymm.
- P. W. Gerbens-Leenes and A. Y. Hoekstra, The Water Footprint of Sweeteners and Bio-Ethanol from Sugar Cane, Sugar Beet and Maize, Value of Water Research Report Series no. 38 (UNESCO-IHE Institute for Water Education, 2009).
- See Monica Saavoss et al., Trends in Production Practices and Costs of the U.S. Corn Sector, Economic Research Report no. 294 (Economic Research Service, USDA, 2021), 16-17. In 2009, the weighted consensus in the literature for the water footprint of U.S. corn ethanol was 1,220 gal/gal. This indicates a 19% improvement over nine years.
- See "Gasoline Explained: Use of Gasoline," EIA, last updated August 22, 2023, https://www.eia.gov/energyexplained/gasoline/use-of-gasoline.php. Approximately 135 billion gallons of gasoline per year equals the energy in 203 billion gallons of ethanol, which-at 508 gallons per acre of corn per year, the current U.S. national average-requires 400 million acres.
- EPA, "Regulation of Fuels and Fuel Additives."
- "Gulf of America Hypoxia Watch," National Centers for Environmental Information, accessed March 13, 2026, https://www.ncei.noaa.gov/products/gulf-america-hypoxia-watch.
- Other related formulations of energy balance ratios include energy return on energy investment, energy cost of energy, energy intensity ratio, and EROI-the most common formulation in the literature.
- Charles A. S. Hall et al., "What Is the Minimum EROI That a Sustainable Society Must Have?," Energies 2, no. 1 (2009): 25-47, 40-45.
- David Murphy, "The Energy Return on Investment Threshold," The Oil Drum, November 25, 2011. See also T. A. "Ike" Kiefer, Twenty-First Century Snake Oil: Why the United States Should Reject Biofuels as Part of a Rational National Security Energy Strategy, WICI Occasional Paper no. 4 (Waterloo Institute for Complexity and Innovation, 2013).
- Author performed AI-assisted analysis of 17 academic studies and meta-studies with EROIs ranging from 0.59:1 to 2.3:1. A value of 1.5:1 +/ 0.4 was determined by weighting the EROI or energy balance of each study by four scoring criteria: recency (40%), rigor and comprehensiveness (30%), independence and credibility of authors (20%), and alignment with broader consensus (10%). The papers considered were David J. Murphy et al., "New Perspectives on the Energy Return on (Energy) Investment (EROI) of Corn Ethanol," Environment, Development and Sustainability 13 (2011): 179-202; David Pimentel and Tad W. Patzek, "Ethanol Production Using Corn, Switchgrass, and Wood; Biodiesel Production Using Soybean and Sunflower," Natural Resources Research 14, no. 1 (March 2005): 65-76; Roel Hammerschlag, "Ethanol's Energy Return on Investment: A Survey of the Literature 1990-Present," Environmental Science & Technology 40, no. 6 (2006): 1744-50; Michael Wang et al., "Well-to-Wheels Energy Use and Greenhouse Gas Emissions of Ethanol from Corn, Sugarcane and Cellulosic Biomass for U.S. Use," Environmental Research Letters 7, no. 4 (2012): 045905; Alexander E. Farrell et al., "Ethanol Can Contribute to Energy and Environmental Goals," Science 311, no. 5760 (2006): 506-8; Dennis R. Keeney and Timothy H. DeLuca, "Biomass as an Energy Source for the Midwestern U.S.," American Journal of Alternative Agriculture 7, no. 3 (1992): 137-44; Gregg H. Marland and Anthony F. Turhollow, "CO2 Emissions from the Production and Combustion of Fuel Ethanol from Corn," Energy 16, no. 11-12 (1991): 1307-16; David Pimentel, "Ethanol Fuels: Energy Security, Economics, and the Environment," Journal of Agricultural and Environmental Ethics 4 (1991): 1-13; David Pimentel, "The Limits of Biomass Utilization," in Encyclopedia of Physical Science and Technology, 3rd ed., vol. 2, ed. Robert A. Meyers (Academic Press, 2001), 159-71; David Pimentel, "Ethanol Fuels: Energy Balance, Economics, and Environmental Impacts Are Negative," Natural Resources Research 12, no. 2 (June 2003): 127-34; Adam J. Liska and Kenneth G. Cassman, "Towards Standardization of Life-Cycle Metrics for Biofuels: Greenhouse Gas Emissions Mitigation and Net Energy Yield," Journal of Biobased Materials and Bioenergy 2, no. 3 (2008): 187-203; Paul W. Gallagher et al., 2015 Energy Balance for the Corn-Ethanol Industry (USDA, 2016); Hosein Shapouri et al., 2008 Energy Balance for the Corn-Ethanol Industry, Agricultural Economic Report no. 846 (USDA, 2010); Adam J. Liska et al., "Improvements in Life Cycle Energy Efficiency and Greenhouse Gas Emissions of Corn-Ethanol," Journal of Industrial Ecology 13, no. 1 (February 2009): 58-74; Michael Wang et al., "Life-Cycle Energy and Greenhouse Gas Emission Impacts of Different Corn Ethanol Plant Types," Environmental Research Letters 2 (2007): 024001; Adam J. Liska, "Eight Principles of Uncertainty for Life Cycle Assessment of Biofuel Systems," in Sustainable Biofuels: An Ecological Assessment of Future Energy, ed. Ajay K. Bhardwaj et al. (Walter De Gruyter, 2015), 243-68; and Stavroula Papagianni et al., "Review and Meta-Analysis of Energy Return on Investment and Environmental Indicators of Biofuels," Renewable and Sustainable Energy Reviews 203 (October 2024): 114737.
- Renewable Fuels Association, 2025 Pocket Guide to Ethanol (Renewable Fuels Association, 2025), 6.
- Point-of-use energy return on investment was computed by the author using data provided in Thomas Homer-Dixon, The Upside of Down: Catastrophe, Creativity, and the Renewal of Civilization (Island Press, 2006), and supporting material from http://www.theupsideofdown.com/rome/colosseum.
- Renewable Fuels Association,Re-Examining Corn Ethanol's Energy Balance Ratio (Renewable Fuels Association, 2016); and Renewable Fuels Association, Corn Ethanol's Energy Balance Continues to Improve (Renewable Fuels Association, 2022).
- "Fertilizer Use and Price," Economic Research Service, USDA, last updated December 30, 2025, https://ers.usda.gov/data-products/fertilizer-use-and-price; and "Quick Stats," National Agricultural Statistics Service, USDA, accessed January 28, 2026, https://quickstats.nass.usda.gov/results/135B5D16-72AE-3081-AEE8-6E1BB5616FF3.
- Henrique Monaco et al., "Trends in Fertilizer Use and Efficiency in the U.S.," farmdoc daily, May 29, 2025; and National Agricultural Statistics Service (NASS), 2021 Agricultural Chemical Use Survey: Corn, NASS Highlights, no. 2022-1 (USDA, 2022), 1.
- "U.S. Energy Facts Explained: Consumption & Production," EIA, accessed March 14, 2026, https://www.eia.gov/energyexplained/us-energy-facts.
- Higby Barrett, Ethanol's Petroleum Footprint: An Analysis of the Petroleum Energy Balance for Ethanol (Renewable Fuels Association, 2024), 5-6. Note that this reference claims a 2022 yield of 2.95 gallons per bushel, but correcting the figure to exclude 2% gasoline denaturant by volume yields 2.90 gallons per bushel.
- Steffen Mueller and John Kwik, 2012 Corn Ethanol: Emerging Plant Energy and Environmental Technologies (University of Illinois at Chicago, 2013), 26.
- Saavoss et al., Trends in Production Practices, iv.
- NASS, Crop Production: 2024 Summary (USDA, 2025).
- Advanced BioFuels USA, "POET-DSM Plans On-Site Enzyme Manufacturing Facility at Project Liberty," Advanced Biofuels USA, February 17, 2017. A National Research Council committee arrived at the same 70 gallons per ton; see National Academy of Sciences, Renewable Fuel Standard: Potential Economic and Environmental Effects of U.S. Biofuel Policy (National Academies Press, 2011).
- Dan Quinn and Bruno Scheffer, "Corn Stover Removal Comes with Trade-Offs," Farm Progress, June 3, 2025.
- For an excellent breakdown of cellulosic ethanol chemistry, see Andrew McAloon et al., Determining the Cost of Producing Ethanol from Corn Starch and Lignocellulosic Feedstocks, NREL/TP-580-28893 (National Renewable Energy Laboratory, 2000).
- Bin Yang and Charles E. Wyman, "Pretreatment: The Key to Unlocking LowCost Cellulosic Ethanol," Biofuels, Bioproducts & Biorefining 2, no. 1 (January/February 2008): 26-40.
- Cellulosic ethanol shows 41.96 megajoules per liter (MJ/L) production cost versus 21.3 MJ/L combustion energy. See Carlos Ariel Cardona Alzate and Oscar J. Sanchez Toro, "Energy Consumption Analysis of Integrated Flowsheets for Production of Fuel Ethanol from Lignocellulosic Biomass," Energy 31, no. 13 (October 2006): 2447-59, 2447.
- Donnelle Eller, "Iowa Has First Gallon of Cellulosic Ethanol," Des Moines Register, July 1, 2014, updated July 2, 2014.
- ASTM International, "Standard Test Method for Determination of Cellulose/Hemicellulose-Derived Glucan and Galactan Content in Solid Corn Biomass Samples," ASTM, April 11, 2025. See also Office of Transportation and Air Quality Compliance Division, Guidance on Qualifying an Analytical Method for Determining the Cellulosic Converted Fraction of Corn Kernel Fiber Co-Processed with Starch, EPA-420-B-22-041 (EPA, 2022); and Office of Transportation and Air Quality Compliance Division, Guidance on Qualifying an Analytical Method for Determining the Cellulosic Converted Fraction of Corn Kernel Fiber Co-Processed with Starch, EPA-420-B-19-022 (EPA, 2019).
- International Paper, 2023 Sustainability Report (International Paper, 2024), 24.
- Y. Datta, "The U.S. Facial Tissue Market: A Competitive Profile," Journal of Economics and Public Finance 9, no. 3 (August 2023): 92-105, 101.
- International Paper, 2024 Annual Report (International Paper, 2025), 35, 39.
- Kiefer, Twenty-First Century Snake Oil, 16; with updates incorporated from Louis Delannoy et al., "Emerging Consensus on Net Energy Paves the Way for Improved Integrated Assessment Modeling," Energy & Environmental Science 17, no. 1 (2024): 11-26; D. Weibach et al., "Energy Intensities, EROIs (Energy Returned on Invested), and Energy Payback Times of Electricity Generating Power Plants," Energy 52 (April 2013): 210-21; Charles A. S. Hall et al., "EROI of Different Fuels and the Implications for Society," Energy Policy 64 (January 2014): 141-52; and Lawrence Livermore National Laboratory, "Estimated U.S. Energy Consumption in 2023: 93.6 Quads" (Lawrence Livermore National Library and DOE, 2024).
- Biomethane is created on-site solely for process energy use at the Aemetis facility in Keyes, California. This reflects California's Low Carbon Fuel Standard credits and $19.7 million in grants and tax credits already awarded to finance the $30 million plant conversion. For plants in other states, such as Verbio Nevada Biorefinery in Nevada, Iowa, producers instead harvest RINs and section 45Z tax credits by simply injecting the gas into local pipelines and forgoing the massive capital investment of plant conversion. This aligns with ethanol EROI analysis that assumes only 9% renewable energy inputs, matching national availability. See Stock Titan, "Aemetis California Ethanol Plant Drives Substantial Carbon Intensity Reduction Using Praj Low-Carbon MVR System," Stock Titan, October 7, 2025; and Chris Clayton, "Failed Cellulosic Ethanol Plant Became North America's Largest RNG Producer," DTN, January 16, 2026.
- The lone departure from the consensus in Delannoy et al. (2024) is the relative ranking of intermittent grid power sources versus dispatchable thermal generation. This stems from current weaknesses in EROI methodology when assessing energy fitness for purpose, which makes it difficult to compare energies of like quality rather than just gross energy values.
- EPA, "Regulation of Fuels and Fuel Additives," 14683.
- Tianbo Tang et al., "Expanding the Ethanol Blend Wall in California: Emissions Comparison Between E10 and E15," Fuel 350 (October 2023): 128836.
- "U.S. Exports of Finished Motor Gasoline (Thousand Barrels)," Petroleum & Other Liquids, EIA, released February 6, 2026.
- EPA, "Regulation of Fuels and Fuel Additives," 14677.
- "Fuels Reporting Registration," Fuels and Fuel Additives, EPA, accessed November 15, 2011, https://web.archive.org/web/20141013171348/http:/www.epa.gov/otaq/fuels/reporting/programsregistration.htm.
- "Registered Companies and Facilities in EPA's Fuel Programs," EPA, last updated July 28, 2025, https://www.epa.gov/fuels-registration-reporting-and-compliance-help/registered-companies-and-facilities-epas-fuel.
- Emily Cassidy, "Inconvenient Corn Ethanol Truths," Environmental Working Group, September 16, 2014.
- See, for example, Tyler J. Lark et al., "Cropland Expansion Outpaces Agricultural and Biofuel Policies in the United States," Environmental Research Letters 10, no. 4 (2015): 044003.
- Haley Leslie-Bole et al., Rethinking Biofuels in the U.S. Midwest (World Resources Institute, 2025), 8.
- Cassidy, "Inconvenient Corn Ethanol Truths."
- National Research Council, Renewable Fuel Standard.
- Rudolf Kurt Thauer et al., Bioenergy-Chances and Limits (Nationale Akademie der Wissenschaften Leopoldina, 2012).
- Clean Air Task Force, Corn GHG Emissions Under Various RFS Scenarios (Clean Air Task Force, 2013).
- European Union, "Directive (EU) 2015/1513 of the European Parliament and of the Council of 9 September 2015 Amending Directive 98/70/EC Relating to the Quality of Petrol and Diesel Fuels and Amending Directive 2009/28/EC on the Promotion of the Use of Energy from Renewable Sources," Official Journal of the European Union L 239 (2015): 1-29.
- First Congress, Tariff Act of 1789, Session I, Chapter II.
- "2026 HTS Revision 4," v1.0.13, U.S. International Trade Commission, accessed March 17, 2026, https://hts.usitc.gov/search?query=2207.10.60.
- "History of Ethanol Timeline," Renewable Fuels Association, accessed January 18, 2026, https://ethanolrfa.org/ethanol-101/ethanol-timeline.
- GAO was known as the General Accounting Office until 2004.
- Ann Johanns and Chad Hart, Historical Costs of Crop Production, Ag Decision Maker File A1-21 (Iowa State University Extension and Outreach, 2025), 2; and Ann Johanns, Cash Corn and Soybean Prices (USDA NASS), Ag Decision Maker File A2-11 (Iowa State University Extension and Outreach, 2026), 2. Iowa corn cost and price statistics were used as proxy for all states.
- Paul H. Tice, Setting the Record Straight on U.S. Fossil Fuel Subsidies (National Center for Energy Analytics, 2025).
- Jim Wells, "Petroleum and Ethanol Fuels: Tax Incentives and Related GAO Work," letter to Senator Tom Harkin, GAO/RCED-00-301R, General Accounting Office, September 25, 2000.
- "Average Price: Gasoline, All Types (Cost per Gallon/3.785 Liters) in U.S. City Average," Federal Reserve Bank of St. Louis, updated March 13, 2026, https://fred.stlouisfed.org/series/APU00007471A.
- The Crude Windfall Profit Tax Act of 1980 extended the $0.40/gal ethanol tax exemption and gave the option of taking it as a credit (which was later repealed in 1988). The Surface Transportation Assistance Act of 1982 increased the subsidy to $0.50/gal. The Tax Reform Act of 1984 further increased the ethanol tax exemption to $0.60/gal. The Omnibus Budget Reconciliation Act of 1990 reset the ethanol subsidy to $0.54/gal. Also in 1990, Congress amended the Clean Air Act by requiring fuel oxygenation, beginning in 1992, to reduce carbon monoxide and ozone in specific urban non-attainment areas; this created some demand for ethanol but initially a much greater demand for (methyl tert-butyl ether) MTBE. The Energy Policy Act of 1992 made gasoline-ethanol blends as low as 5.7% eligible for tax exemption. It also created demand for ethanol by mandating manufacture and purchase of E85 vehicles for certain government and municipal fleets, which began to materialize in 1997. The 1998 Transportation Equity Act for the 21st Century extended the ethanol tax exemption through 2007 with a slow decline from $0.54/gal to $0.51/gal. It also created the Clean Fuels Formula Grant Program, which covered 80% of capital costs for the conversion of mass transit to alternative fuels. The Energy Policy Act of 2005 restructured the ethanol benefit as the Volumetric Ethanol Excise Tax Credit (VEETC) at a rate of $0.51/gal, and it introduced the ambitious RFS production quotas that were shortly expanded into RFS2 by the Energy Independence and Security Act of 2007. The 2008 Farm Bill set the rate to $0.45/gal. After recognizing the incentive to be largely redundant to the blending mandates of RFS, Congress allowed the VEETC to expire at the end of 2011.
- Wells, "Petroleum and Ethanol Fuels," GAO/RCED-00-301R, 19. In 1979, about $1 billion was earmarked for biomass fuel projects in the Department of the Interior and Related Agencies Appropriation Act. The Energy Security Act of 1980 provided another $1 billion in insured loans to small ethanol producers, loans for small biorefinery start-ups, and purchase agreements for biomass energy supply to federal agencies.
- American Jobs Creation Act of 2004, Pub. L. No. 108-357 (2004), 43; and Harry de Gorter and David R. Just, The Economics of U.S. Ethanol Import Tariffs with a Consumption Mandate and Tax Credit, Cornell University Working Paper no. 2007-21 (Cornell University, 2008).
- David Shepardson, "Congress Ends Corn Ethanol Subsidy," Detroit News, January 6, 2012.
- de Gorter and Just, "The Economics of U.S. Ethanol Import Tariffs," 8.
- de Gorter and Just, "The Economics of U.S. Ethanol Import Tariffs," 10.
- H.R. 3919-Crude Oil Windfall Profit Tax Act of 1980.
- S. 932-Energy Security Act.
- "History of Ethanol Timeline."
- Caley Johnson et al., History of Ethanol Fuel Adoption in the United States: Policy, Economics, and Logistics, NREL/TP-5400-76260 (National Renewable Energy Laboratory, 2021).
- S. 1630-Clean Air Act Amendments of 1990.
- David Korotney, "Water Phase Separation in Oxygenated Gasoline-Corrected Version of Kevin Krause Memo," memorandum, EPA, n.d.
- Blue Ribbon Panel on Oxygenates in Gasoline, Achieving Clean Air and Clean Water, EPA420-R-99-021 (EPA, 1999), 18, 30, 57, 91.
- Samuel Hitz et al., The Role of Oxygenated Fuel in California Air Quality (University of California, Santa Barbara, 1999), 6.
- Blue Ribbon Panel on Oxygenates, Achieving Clean Air, 87.
- H.R. 6-Energy Policy Act of 2005.
- EPA, "Fuel and Fuel Additives: Gasohol; Marketability," Federal Register 44, no. 68 (April 6, 1979): 20777-78.
- Ethanol fuel requires some gasoline to be blended for lubrication and seal compatibility, so E85 (51%-83% ethanol by volume) is generally the high end, though E95 does exist.
- Johnson et al., History of Ethanol Fuel Adoption, 10.
- H.R. 3030-Clean Air Act Amendments of 1990.
- H.R. 776-Energy Policy Act of 1992.
- Johnson et al., History of Ethanol Fuel Adoption, 12.
- Johnson et al., History of Ethanol Fuel Adoption, 12.
- Johnson et al., History of Ethanol Fuel Adoption, 12.
- "E85 Prices," Renewable Fuels Association, accessed January 19, 2026, https://e85prices.com.
- "E85 Prices"; and K. Moriarty et al., E85 Dispenser Study, NREL/TP-7A2-47172 (National Renewable Energy Laboratory, 2009).
- K. Reid, "Alcohol at the Pump," National Petroleum News 97, no. 9 (2006): 40-44, as cited in Scott K. Shriver, Network Effects in Alternative Fuel Adoption: Empirical Analysis of the Market for Ethanol, Columbia Business School Research Paper no. 14-34 (Columbia Business School, 2014).
- Brent D. Yacobucci, Fuel Ethanol: Background and Public Policy Issues, RL33290 (Congressional Research Service, 2006, updated 2008).
- Frank Rusco, Renewable Fuel Standard: Information on Likely Program Effects on Gasoline Prices and Greenhouse Gas Emissions, GAO-19-47 (Government Accountability Office, 2019), 7.
- Rusco, Renewable Fuel Standard, 19-21.
- EIA, Monthly Energy Review February 2026, table 3.1.
Continue Reading
-3.png)

.jpeg)
Who Pays When Wind Turbines and Solar Panels Wear Out? A Hidden Energy Liability
This means that consumers or taxpayers-not the owners-will likely be left to pay a significant portion of the $50 billion or more in future decommissioning costs.