The U.S. Energy Information Administration Needs to Fix How It Reports Renewable Power Capacity
The Issue
Since 2010, federal tax credits, state subsidies, and mandates have led to a massive expansion in U.S. solar and wind power installations. Although it has been widely reported that the recently passed One Big Beautiful Bill Act (OBBBA) is the death knell for the growth of renewable energy, this legislation continues the subsidies for wind and solar facilities that are in service by 2030.1 In fact, according to the U.S. Energy Information Administration (EIA), more than 1,100 new wind and solar facilities are either under construction or planned by the end of the decade.2 The EIA reports that new wind and solar generation will account for 80% of all new electric generating capacity added through 2035 (see Figure 1).3
Wind and solar advocates claim that this huge increase in generating capacity demonstrates the ability of these resources to meet rising electricity demand being driven by economic growth, artificial intelligence, and data centers. Advocates also promote the idea that the trend is economically beneficial, claiming that solar and wind are cheaper than natural gas generation, the only other major generating resource that the EIA projects will be added. However, the EIA’s reporting of projected capacity additions is incomplete and may be misleading policymakers about the adequacy of future electricity supplies to meet growing demand.
Figure 1. EIA Forecast of Added Generating Capacity, 2025–35
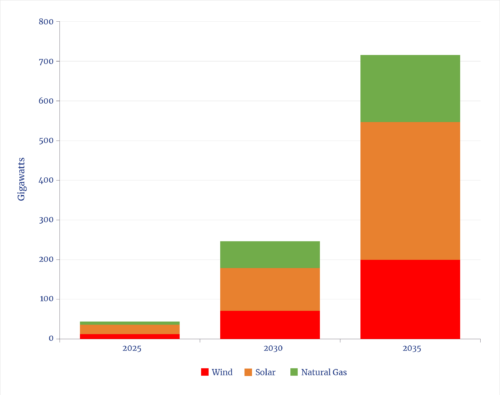
Source: U.S. Energy Information Administration, Annual Energy Outlook, table 16, Apr. 15, 2025
In addition to projections about wind and solar capacity additions for the next 10 years, the EIA has (at least implicitly) supported wind and solar advocates’ claims of lower costs. Specifically, it has published data showing that the so-called “levelized” costs per kilowatt-hour (kWh) of wind and solar are lower than conventional generating resources like natural gas, even without subsidies.4 (Levelized costs can be thought of as similar to fixed mortgage payments.)
The problem with both claims lies with the very nature of wind and solar: they generate electricity only intermittently—when the wind is blowing and the sun is shining. Without accounting for this unavoidable characteristic, direct comparisons of wind and solar power with traditional generating resources such as natural gas mislead policymakers.
The episodic nature of wind and solar power has critical impacts on both supply adequacy and cost, which, while recognized by some, are nonetheless not incorporated into how bottom-line data are reported by the EIA. In other words, the EIA data and projections do not reflect the fact that a megawatt of solar or wind generation is simply not equivalent to a megawatt of conventional power. Nor do reported levelized costs of wind and solar reflect the true costs to consumers.
The issue is thus value. Specifically, owing to their inherent intermittency, the value of a wind or solar gigawatt is much lower than traditional generating resources.
The Reality
Dispatchable vs. Intermittent Energy Sources and Capacity
Traditional coal, natural gas, nuclear, and hydroelectric generating plants can be scheduled to run when needed. Some of them, especially nuclear and most coal plants, are designed to operate continuously and are referred to as “baseload” facilities.5 Others, especially natural gas plants, can quickly be turned on or off (“dispatched”) to match changes in demand. Collectively, traditional generation can be both scheduled and dynamically managed, enabling the operators of electric grids to reliably meet demand at the lowest cost.
The inherent intermittency of wind or solar reduces the physical and economic value of that power capacity relative to traditional generating resources because either sufficient reserves or storage must be maintained to meet demand when wind and solar generation are unavailable. Thus, just reporting total wind and solar capacity misleads (even if unintentionally) because it does not account for the adequacy of the electrical energy generated to meet demand and the actual costs to do so.
Consider the following analogy. Imagine that a city and its citizens are offered two types of buses for commuting. One is with new buses and free fares. However, these run only one-third of the time, are often unpredictable, and are less likely to show up on bad-weather days. If you wait for one of these new free buses but it fails to show up, you must suffer the inconvenience of having to take a relatively expensive Uber ride, which can cost even more on busy or bad-weather days. Meanwhile, the other option is to pay a modest fare (say, one-tenth of an Uber ride) on a conventional bus—but one that’s reliable, regardless of weather. Over a year of commuting, the total costs for the free bus service are likely to be much higher and the value much lower than commuting on the conventional bus service.
In the context of electric grids, Uber rides represent the cost of either backup generating capacity or battery storage to compensate for wind and solar unavailability. Adding to these costs is the fact that, when electricity demand is greatest—typically, during the early morning and early evening hours—little, if any, solar power will be available. Similarly, meteorological records show that on the hottest and coldest days, there is often little wind. There can also be multiday periods, often lasting days and even a week, when there is little or no wind (a wind drought) and multiple cloudy days when little solar power is generated.
An accurate reporting of useful wind and solar capacity requires correcting for the intermittency. One straightforward way to do this—though far from complete—would be to adjust the reported capacity by its useful “capacity factor,” a term of art that accounts for the actual total time that a generating plant produces electrical energy over a year. Although the EIA doesn’t publish capacity factors by region (something that varies widely for solar and wind but not significantly for dispatchable power), it does publish average nationwide capacity factors.
In 2024, the average annual capacity factors were 23% for solar and 34% for wind. In addition to regional variations, wind availability is lower during the summer, while solar is much lower during the winter. Natural gas power plants, on the other hand, have availability factors that can exceed 90% if they are operated as baseload power (i.e., not used for episodic backup). To be sure, natural gas capacity factors are lower than their availability factors because many plants are used for backup and to meet peak demand. In 2024, the EIA reported that the average capacity factor for highly efficient, natural gas combined-cycle plants was just under 60%.6
In order to avoid misleading policymakers (and the media), the EIA should report the total equivalent capacity of wind and solar added, i.e., reflecting actual generation during a typical year, rather than assuming, as the EIA does implicitly, that a wind and solar gigawatt has equal electricity-producing value as a conventional gigawatt. Machines and society run on energy, not power. (To use our earlier analogy: a bus is propelled by the energy in the fuel, not the power of the engine.) Moreover, the EIA should report these data on a regional basis to account for differences in how much wind and solar generators produce based on their locations. This can be accomplished by adjusting (called “derating”) total capacity additions of generating resources by their average region-specific capacity factors. For example, the EIA reports that solar generation had an average nationwide capacity factor of 23% in 2024.7 Hence, 100 GW of solar would have an equivalent capacity of just 23 GW for states that meet the average—but just 10 GW in many northern states, where solar capacity factors are lower. Similarly, the average capacity factor for wind generation was 35% in 2024. Hence, 100 GW of wind generation would have an equivalent capacity of 35 GW. By comparison, a gas-fired generator running as a baseload plant can easily have a capacity factor of 80%, or 80 GW.
To illustrate the implications of more accurate reporting, Figure 2 shows the equivalent capacity additions using national average wind and solar capacity factors. The low average capacity factors for wind and solar mean that, in terms of useful energy-production capacity, natural gas—not solar and wind—will be the dominant source of new electricity delivered through 2035.8
Notably, the EIA estimates that an additional 200 GW of useful capacity will be required by 2030—yet, as Figure 2 shows, the total useful capacity planned will be about half of what will be needed.
Figure 2. EIA Forecast of Electricity Capacity, Adjusted (Derated) for Production Capability 2025–35
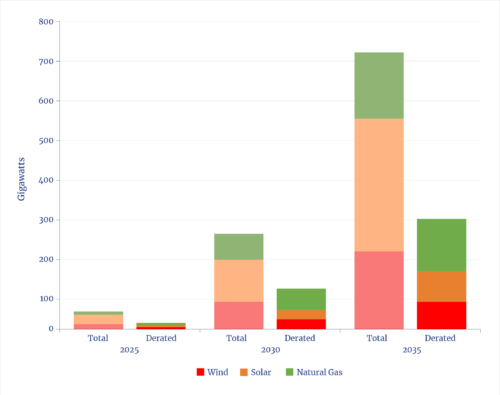
Source: EIA, Annual Energy Outlook, Apr. 15, 2025
The “Levelized Cost” Problem
Typically, utility planners base investment decisions on resource costs. Many state utility regulators, for example, require the utilities they oversee to prepare integrated resource plans (IRPs) that determine what resources those utilities should build over the next decade or two. The portfolio of resources selected typically will include both generating resources and investments in energy efficiency.
In many cases, utilities use levelized costs to compare different resources. However, comparing levelized costs, such as the fixed mortgage payments for different homes, provides little information about actual value. For example, a monthly mortgage payment of $2,000 for one house, versus one of, say, $2,500 for another, provides no information about either house’s value in terms of size, location, condition, and so forth. Similarly, the levelized cost doesn’t reveal power plant attributes, especially intermittency. The lowest levelized cost resources may not be the highest-value ones, or even the cheapest ones, when operated over time in the real world.
For electricity planners and regulators to identify the highest true value, they must compare costs and operational benefits. Just like the commuter bus that doesn’t arrive on a rainy morning, intermittent capacity that is unavailable when it is most needed has far lower economic value.
There is ample data that can be used to adjust real-world benefits based on geographic differences. A solar panel in New York will generate roughly half as much electricity per year as the same panel in Arizona. A wind turbine in the Midwest generates more electricity than one in Florida. Although the EIA accounts for differences in labor and operating costs by region, its levelized cost estimates do not account for differences in geographic performance.
Advocates of solar and wind power often claim that a combination of solar capacity with battery storage can supply the majority of electricity needed and do so less expensively than using conventional plants.9 However, all the studies making such claims have two key flaws.
First, they focus on average electricity demand, rather than what it takes to meet peak demand on the hottest summer days and coldest winter days and the variability over several decades (the period for which grids are designed to serve). For example, New York State’s electric load averaged 17 GW for all hours in 2024; but the summer peak exceeded 31 GW, almost double the average demand.10 Moreover, if that state’s electrification efforts succeed, the winter peak is expected to double by 2055, to 50 GW, far higher than the expected summer peak in 2055 of 38 GW.
Second, simplistic forecasts all overlook the guaranteed occurrence—as meteorological records show—of extended wind or solar droughts, i.e., multiple continuous days, even weeks, of either clouds or wind lulls that will necessitate astonishing quantities of storage.11
Perspective
Although the EIA doesn’t make energy policy, the information that it publishes is used to evaluate policy options. Unfortunately, the implicit bottom line on electricity adequacy that arises from EIA reports provides a misleading picture and distorts policymaking, even if it is an unintentional result of continuing a legacy data methodology appropriate for conventional power.
Correcting this is straightforward. The EIA can report capacity additions of wind and solar based on both nameplate capacity and the capacity adjusted for average seasonal capacity factors by region. It could also report an “effective” cost of generation, not just “levelized,” the former adjusted to incorporate the costs of backup generation or storage to bring wind and solar capacity to operational parity with the same capacity (and availability) as conventional generation.
Endnotes
- J. Michael Showalter et al., “One, Big, Beautiful Bill Act and Follow-On Administration Actions Lessen Federal Incentives for Solar and Wind Generation,” The National Law Review 15, no. 197 (July 11, 2025).
- EIA, Electric Power Monthly, June 2025, table 6.5.
- EIA, “Solar, Battery Storage to Lead New U.S. Generating Capacity Additions in 2025,” Today in Energy, Feb. 24, 2025.
- EIA, “Levelized Costs of New Generation Resources in the Annual Energy Outlook 2025,” April 2025.
- Geothermal plants can also generate electricity in all hours, but there is very little existing or planned capacity. Similarly, it is doubtful that any new large hydroelectric projects will be developed.
- EIA, Electric Power Monthly, June 2025, table 6.7A. Combined-cycle plants have a secondary turbine that recaptures some of the exhaust heat in a secondary steam generator that generates additional electricity.
- Ibid., table 6.7B.
- The EIA assumes that no new nuclear plants will be built in the United States. That assumption is almost certainly incorrect.
- Kostantsa Rangelova and Dave Jones, “Solar Electricity Every Hour of Every Day Is Here and It Changes Everything,” EMBER, June 21, 2025.
- New York Independent System Operator, 2025 Gold Book, table I-1a, April 2025
- A third issue is the vast land areas that wind and solar power require, owing to their low power density, which is measured in terms of capacity per unit of area. The power density of utility-scale solar is about 0.5 MW/acre. The power density of wind is much lower, about 0.01 MW/acre.
ABOUT THE AUTHOR
Jonathan is the President of Continental Economics with years of experience working and consulting for regulated utilities and government. He has addressed critical economic and regulatory issues affecting the energy industry in the U.S., Canada, and Latin America, including gas and electric utility structure and operations, cost-benefit analysis, mergers and acquisitions, cost allocation and rate design, asset management strategies, cost of capital, depreciation, risk management, incentive regulation, economic impact studies, and general regulatory policy. Jonathan has prepared expert testimony and reports for numerous utility commissions and international regulatory bodies and has testified before Congress and numerous state legislative committees, and also served as arbiter in disputes between regulators and regulated utilities. Jonathan has also designed economic models to value nuclear, fossil fuel, and renewable generating assets. He is the coauthor of three textbooks: Environmental Economics and Policy (Addison Wesley Longman, 1997), Principles of Utility Corporate Finance (Regulatory Economics Publishing, 2011), and the widely used, Fundamentals of Energy Regulation, 3d ed (Regulatory Economics Publishing, 2020), as well as numerous academic and trade press articles. Jonathan was previously an Adjunct Fellow with the Manhattan Institute for Policy Research. He earned a B.S degree in Mathematics and Economics from the University of New Mexico, and M.A. and Ph.D. degrees in Economics from the University of Washington.