The Rise of AI: A Reality Check on Energy and Economic Impacts
Executive Summary
Total private sector spending committed to artificial intelligence (AI) is now a significant share of U.S. GDP. Spending on building data centers alone—exceeding $50 billion annually and rising—has now surpassed spending on all other commercial buildings combined.
The evidence of an emerging structural shift in the U.S. economy can be seen in the combination of the epic spending on AI, rapid adoption of AI tools, the implications for national security, the vigorous debates over the impact of AI in society, and, as well, the stock market enthusiasms.
The core consequence of AI deployed at scale is in its potential for boosting productivity, the feature of every economy that drives growth and prosperity. If democratizing AI elevates U.S. productivity growth only to the average of the past half-century, it will add a cumulative $10 trillion more to the U.S. GDP than is now forecast over the coming decade.
Often ignored in AI forecasts: the additional wealth created by using the new technology leads to behaviors that use more energy. An extra $10 trillion would lead to increased overall energy use equivalent to about five billion barrels more energy over the next decade. Such a wealth-induced increase in energy consumption will be far greater than the quantity of energy needed to power the wealth-creating AI. But unleashing this economic and strategic opportunity requires building, and powering, the AI infrastructure.
AI data centers are not unique in that regard. Energy is the “master resource” needed for operating every part of civilization. As Nvidia CEO Jensen Huang recently said: “AI is energy, AI is chips, the models, and the applications . . . . And we need more energy.” As it happens, data centers are measured and tracked in terms of power in watts, not data in bits.
What is unique about AI data centers is the scale and velocity of power demands now emerging. Some individual data centers now under construction will have city-scale power demands, and hundreds are being built or planned. The rate of construction—especially in combination with reshoring manufacturing and reanimating basic domestic industries—has ended the two-decade interregnum of flat electric sector growth.
Policymakers, investors, and businesses in the AI supply chain are all interested in discerning just how much additional electricity will be needed specifically for powering data centers and how it will be supplied. For this analysis, we’ve reviewed dozens of different industry and technical reports to look for clues and consensus.
The facts and trends suggest AI digital demands will require building no less than about 75 GW, possibly as much as 100 GW of generation by 2030. And neither outcome includes the electricity demands for expanding the ancillary but directly related telecommunications networks, as well as that needed for reshored chip fabrication facilities that will manufacture the logic engines inside the data centers.
To meet that much new demand by 2030, underlying engineering realities show that most of the additional electricity generation will necessarily come from burning natural gas. That will, in turn, require about a 10% to 20% increase in overall U.S. gas production.
That rise in gas demand will occur contemporaneously with roughly the same amount of new demand coming from additional LNG export terminals that are already under construction.
The nation is capable, technically, of meeting such a level of growth in natural gas production, pipeline installations, and power plant construction. The primary impediments are institutional and regulatory.
In the longer-term, as the AI structural revolution continues to play out past 2030, even greater energy demands will emerge to power the next phase of growth. Those demands will likely be met increasingly from nuclear energy and additional solar capacity. But each of those require associated infrastructure expansions that, inherently, take far longer than the current torrid pace of AI construction. Nevertheless, if relevant policies and projects are not put in place today, electricity planners in the foreseeable future will be again caught flat-footed in failing to prepare for growth.
The challenge is that electricity-related energy policies now in place were framed during the recent period of low or no growth, combined with misguided pursuits of an energy transition to replace conventional energy sources. The AI boom has illuminated the fact that new periods of growth are inevitable—even if difficult to predict—and that such periods, predictably, lead to increased energy demands requiring additions to, rather than replacements of, existing energy systems.
Google observed earlier this year that “AI presents the United States with a generational opportunity for extraordinary innovation and growth” but that it requires “expedited effort to increase the capacity of . . . U.S. energy systems.” A July 2025 White House directive, Winning the Race: America’s AI Action Plan, called on the private sector to build the “vast AI infrastructure and the energy to power it.” That is precisely what is underway in an historic convergence of the technology, energy, and financial sectors.
Key Takeaways with Implications for Policymakers
The great AI inflection is market-driven:
The race to build AI infrastructures and services is being funded by the private sector, i.e., it is not a policy-driven transformation.
The pace of AI adoption depends on integration challenges for specific applications, and the maturity and efficacy (power) of the AI tools, i.e., more powerful and useful AI tools are rapidly emerging that will drive more adoption.
Three key metrics illuminate the transformation:
The rate of progress in the underlying AI compute capabilities follows a well-established, predictable trend of exponential gains.
AI computational performance has increased a thousandfold since 2018 and is continuing at that pace.
The scale and velocity of private capital deployed to build AI infrastructure is setting records but has not (yet) exceeded historic highs in comparable periods.
Over $1 trillion or private capital is planned or on track to be spent to build AI infrastructure.
The scale of energy demands for AI infrastructures will require substantial expansion of both electric power and natural gas production.
The likely pace of AI will require 75–100 GW of new electricity generating capacity to supply as much as 1,000 terawatt-hours a year more electricity for digital demands by the early 2030s.
The new power plants will drive the need for a 10%–15% overall increase in U.S natural production, contemporaneous with a similar increase in demand for LNG exports.
A key, enabling requirement: meet the unprecedented scale of electricity demand of individual facilities, at the velocity being built.
Hundreds of planned data centers have demand exceeding 300 MW each, many over 1 GW, with construction completions often in two or three years. There are no precedents in utility history for such scale or velocity.
The pace and scale are in tension with supply chains and workforce availability in a sector that is accustomed to flat growth with regulations, policies, and conventions adopted in recent years to pursue an energy transition.
Pace and scale are also in tension with the need to not compromise grid reliability or impose costs on residential rate payers.
Engineering realities will dictate viable solutions. There are two timeframes for meeting AI power demand:
Two to five years: Various classes of natural gas turbines and engines dominate.
The technical capacity exists to meet the demands for gas production, pipelines, and power-producing engines. Both grid-integration and private grid approaches to projects are underway.
Five to 10 years: Feasible for new nuclear generation and expanding transmission to access utility-scale solar/wind facilities (requiring grid-scale batteries).
Both face supply chain challenges; solar, wind, batteries with foreign or China sourced inputs; nuclear with restoring atrophied infrastructures. There is no clear path to significant acceleration of transmission construction (natural gas pipeline construction is far faster).
Introduction
Structure of Technological Revolutions
It has escaped no one’s attention that eye-watering amounts of capital are being deployed in the private sector on artificial intelligence (AI). Similarly, it’s now common knowledge that the great AI build-out is inducing increases in electric demand not seen for decades.
As with all technologies, what appears to be an overnight phenomenon in fact comes from years of engineering developments and incremental progress. History shows that when the relevant capabilities become good enough and costs are low enough, a tipping point is reached, and an inflection happens with rapid and “surprising” growth.
Economic historian Joel Mokyr, the co-recipient of this year’s Nobel Prize in Economic Sciences, borrowed from physics the term “phase change” to describe such inflections, when transformational innovations trigger economic and social revolutions.1 The change in the economy and in daily life—from pre- to post-railroad, from an agrarian to industrial society—was a phase change as dramatic as a liquid becoming a solid.
As professor Mokyr wrote in one of his many seminal books, The Lever of Riches: “Technological progress has been one of the most potent forces in history in that it has provided society with what economists call a ‘free lunch,’ that is, an increase in output that is not commensurate with the increase in effort and cost necessary to bring it about.”2
But technologies’ economic and societal benefits aren’t unlocked in isolation. Mokyr is not naïve in his “free lunch” observation but rather uses that aphorism to frame structural revolutions, i.e., how a phase change occurs in the real world.
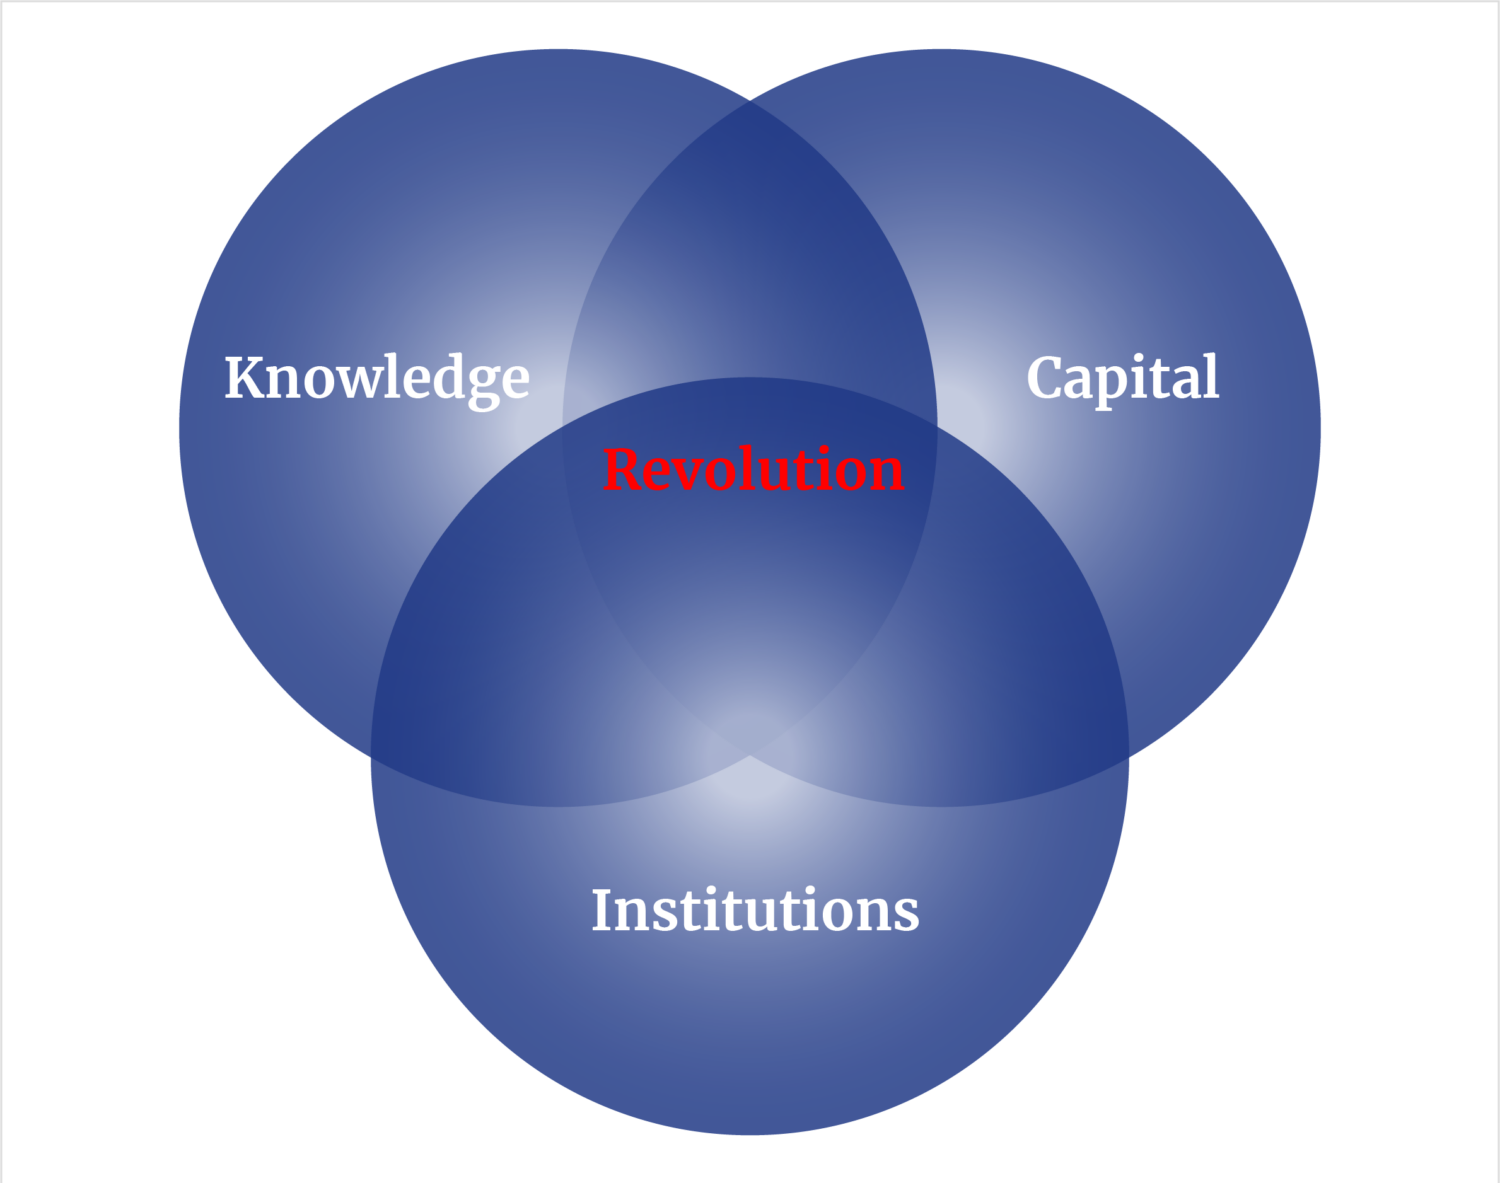
In Mokyr’s framing, such revolutions occur at the intersection of three forces: new knowledge instantiated through technology, the availability and sources of capital to deploy technologies, and the role of institutions that enable or constrain deployment.
Few doubt that AI is consequential, even if there are some who are more anxious than excited about the possibilities. The nature of the opportunities and what it will take to ensure that the United States can capture the benefits from AI can be revealed by answering three questions about the future, with all the usual caveats about predictions, around which this report is organized.
Is AI a structural shift or a bubble?
What are the upstream power implications?
What are the constraints to unleashing the necessary energy to fuel an AI boom?
1. The Structural Shift
1.1 Pillar of the Boom: Compute Power
The release of ChatGPT on November 30, 2022, led to widespread public recognition that AI was now good enough to become increasingly useful—and to disrupt businesses, institutions (and thus policymaking), and stock markets. It was the climax of decades-long technological achievements.
Performance Gains in AI Supercomputers
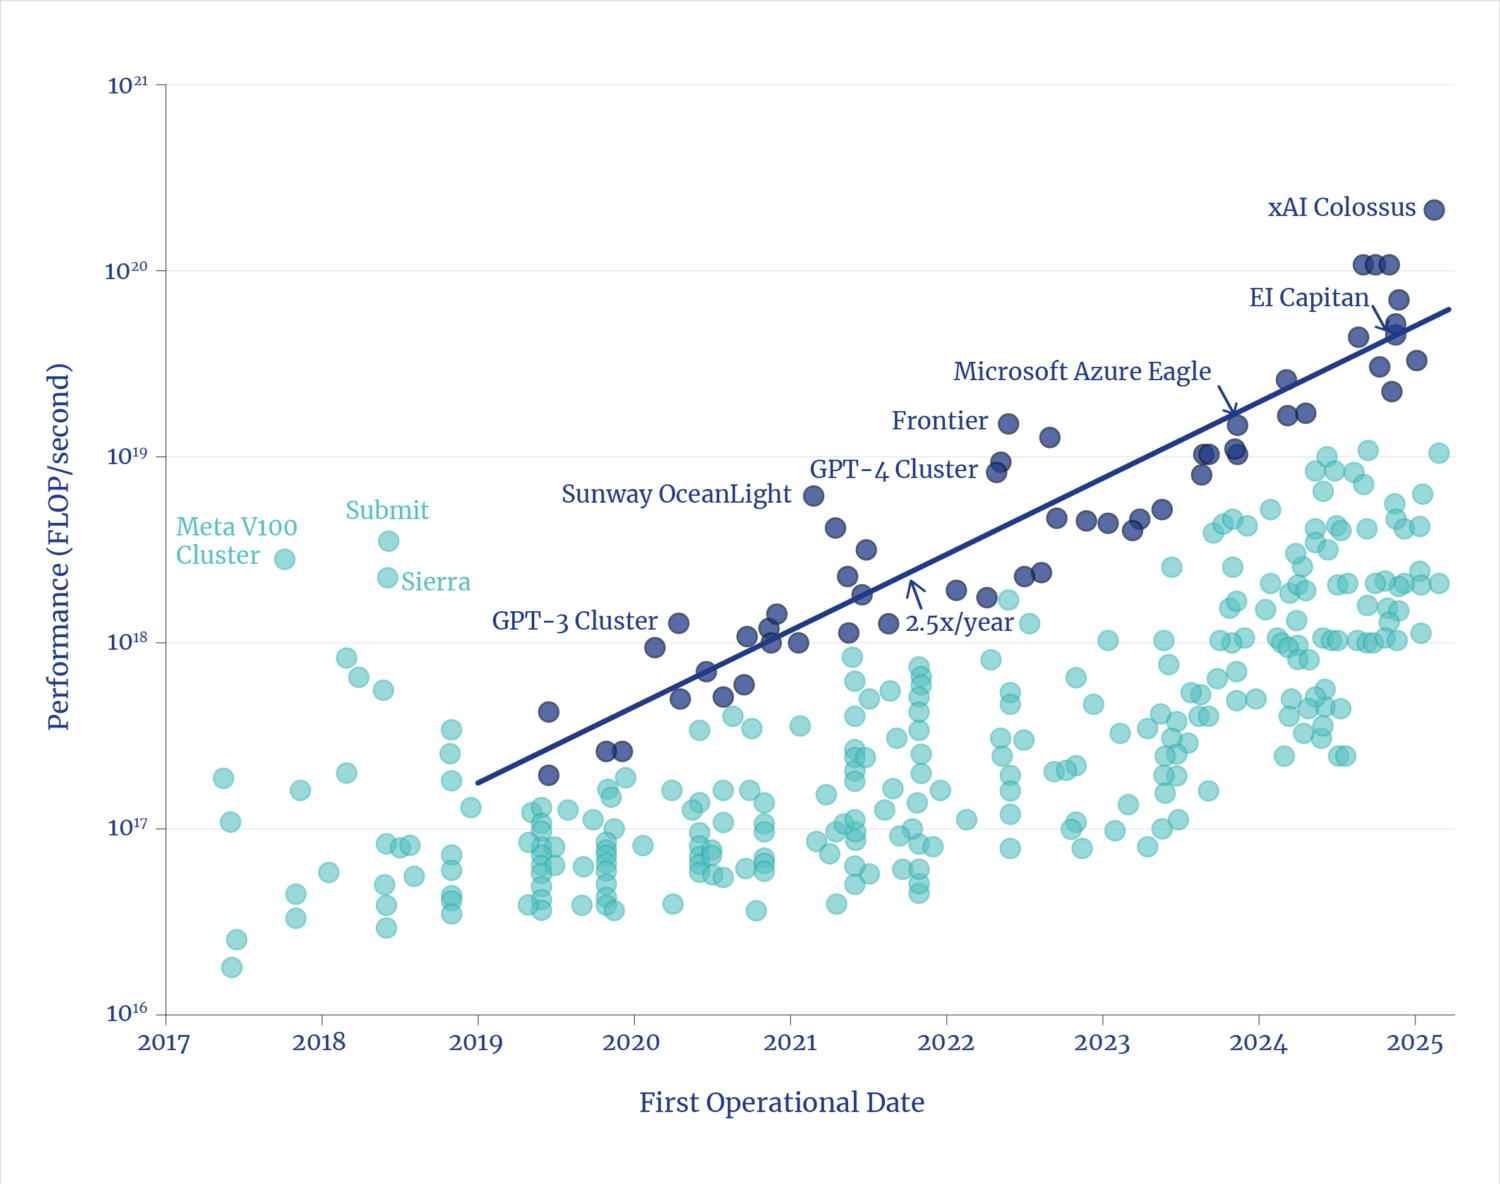
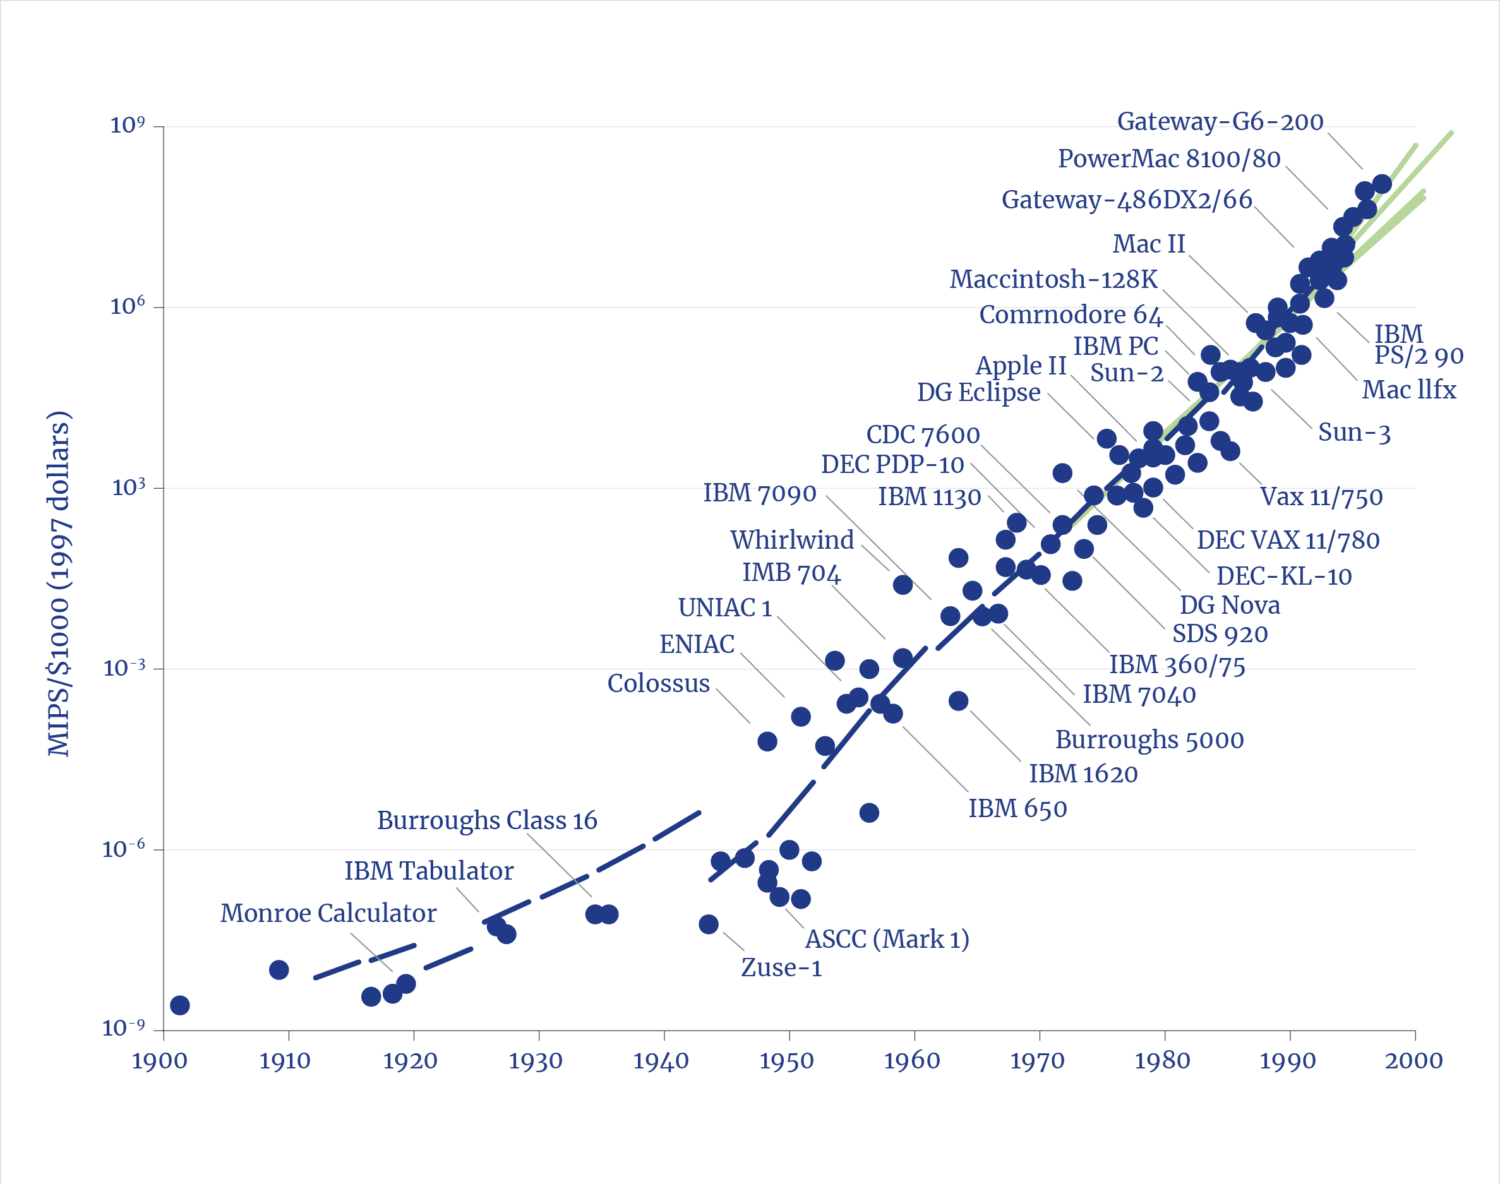
The arrival of supercomputers powerful enough to execute the complex mathematics and coding of “machine learning” arrived, predictably, because of the inexorable, exponential gains in compute performance (measured in FLOPS/second, or logic operations per second, wherein conventional computer progress is often measured in the more general MIPS, million instructions per second [MIPS]). As with the first computer revolution, the rate of improvement continues unabated and exponentially.
The era when binary logic computers were democratized, circa 1980, offers an analogy for the state and future of the emergence of practical AI—a technology that has been in existence for decades, just as digital computers had been by 1980.
The origin of digital computers based on binary logic traces to 1937, with Claude Shannon’s seminal MIT master’s thesis, the Magna Carta of the digital age.3 Alan Turing, a colleague of Shannon, observed at the time that the Colossus computer (built during World War II, just before the U.S. Eniac) could perform tasks that would otherwise have taken, as Turing is said to have observed, “100 Britons working eight hours a day on desk calculators 100 years” to crack the German code.4 Some four decades would pass before the age of the PC would arrive because of the inexorable, exponential progress in compute power.
Economic Performance Gains of Conventional Computers
(1998).
Similarly—nearly four decades before the release of ChatGPT—the concept of a learning algorithm, of “machine learning,” traces to a seminal 1986 paper co-authored by Geoffrey Hinton, credited as a “godfather” of AI. But the silicon engines that could realize Hinton’s vision did not emerge until 1993, when Jen-Hsun “Jensen” Huang co-founded Nvidia.5
As with earlier, conventional logic, it took decades of advancement for silicon hardware to become sufficiently powerful and inexpensive to democratize the massively parallel functions inherent to AI. The past half-dozen years have seen a thousandfold increase in AI computational power, unlocking useful AI—a pace that is not slowing; indeed, evidence points to an acceleration.6
1.2 The Spending: Data Centers
The July 2025 White House directive, Winning the Race: America’s AI Action Plan, summarized the state of play regarding the AI imperative, issued a call to “build and maintain vast AI infrastructure and the energy to power it,” and offered a directive that the nation should “Build, Baby, Build!”7
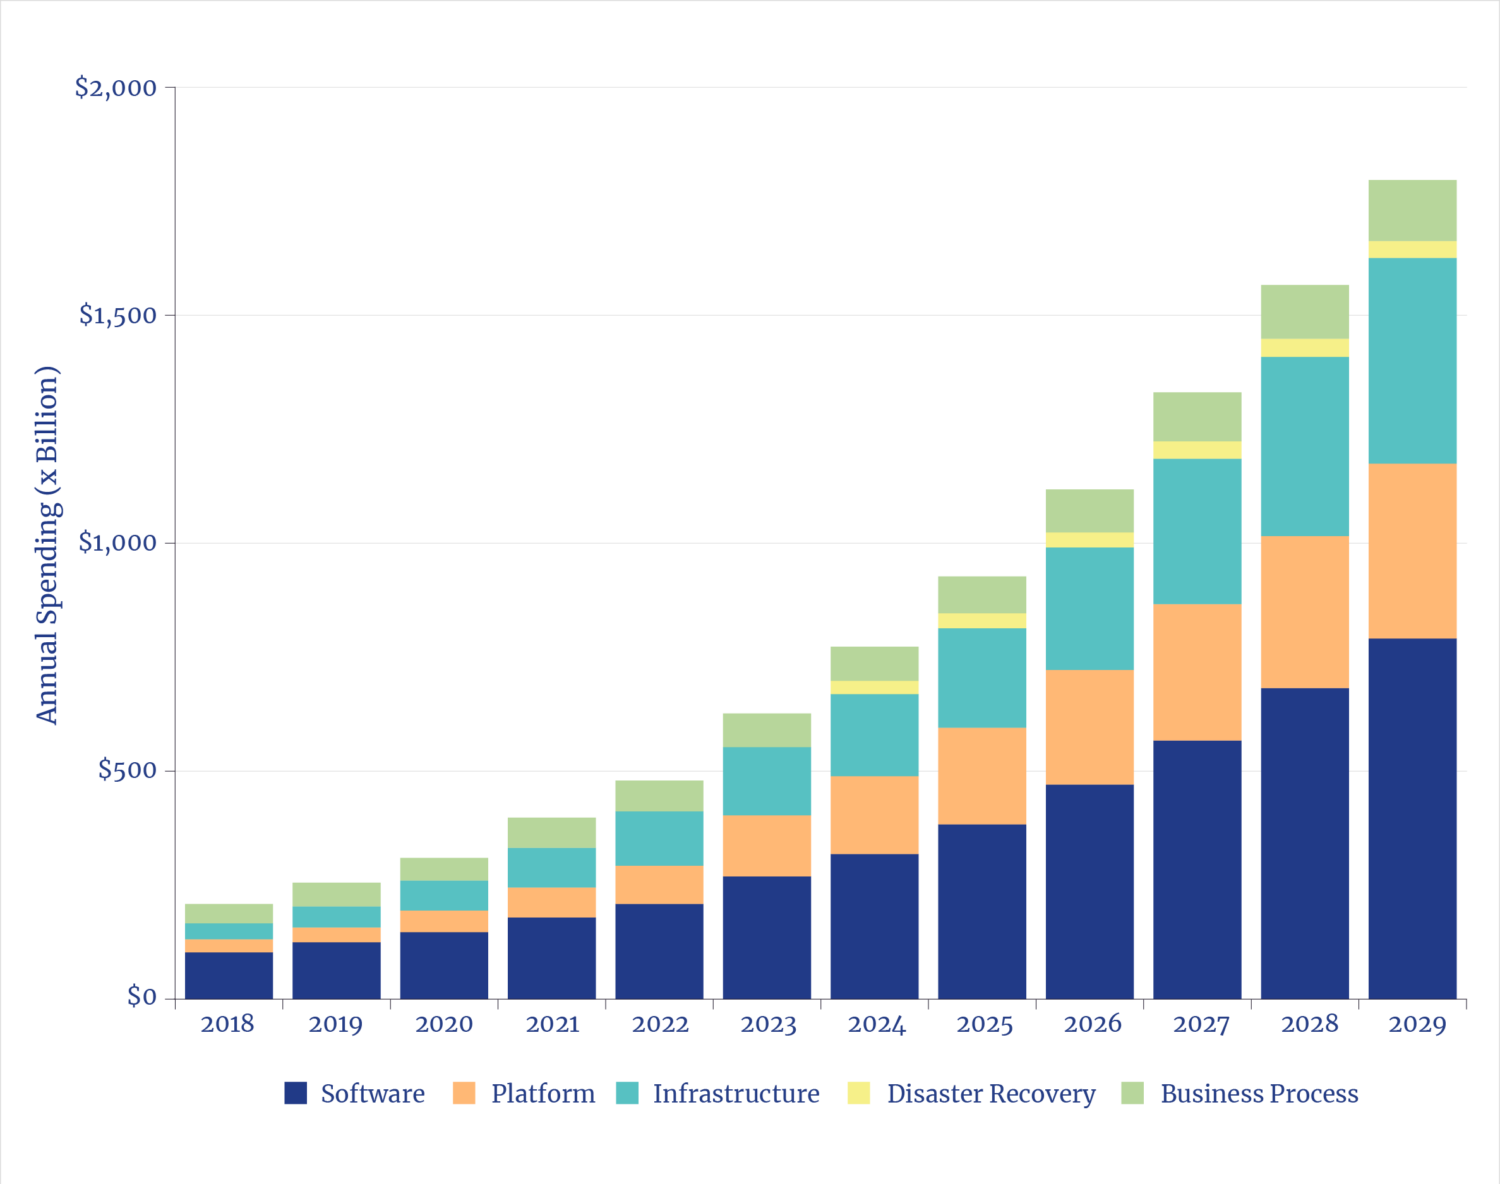
Spending on Construction: Offices vs Data Centers

Source: Lydia DePillis, “The A.I. Spending Frenzy Is Propping Up the Real Economy, Too,” The New York Times, August 27, 2025.
Private sector spending on data centers had been running at roughly $10 billion per year rate before the 2022 release of ChatGPT. Since then, spending took off—data center construction this year surpassed construction spending on all other U.S. commercial buildings. The spend rate exceeds current total spending to build either manufacturing facilities or power plants.8
Some analysts worry that the spending, and the associated escalation in stock valuations of all the companies in the AI ecosystem, upstream and downstream, points to a classic bubble.9 However, BlackRock recently made a bet on the future with a $40 billion acquisition of Aligned Data Centers—the ”largest data center deal in history”—in a clear signal of that firm’s expectation of a long-run trend, not a bubble.10 Of course there is a correlation between the two domains of what investors think a stock is worth and what is being built and planned, and expectations about the future uses of AI.
Big Tech Capital Spending

Total capital spending on AI infrastructures is on track to exceed $1 trillion a year, with some analysts predicting a cumulative $5 trillion deployed by 2030.11 While only hindsight will reveal whether or not private and public market investor sentiments were overexuberant, there are a number of basic indicators that can reveal whether the AI boom is structural, i.e., a secular shift in the economy, or a stock fad.
1.3 The Spending: Current Context
Overall U.S. business spending on information infrastructures has, since the start of the 21st century, dominated, dominated overall spending on the four core areas of private sector investment, substantially exceeding capital deployed for industrial equipment, transportation equipment, and structures. The share of that information infrastructure spending has been increasingly shifting from purchases of on-site compute to enterprise cloud-based services. The arrival of AI accelerates the trend because the dominant locus of AI spending is on cloud infrastructure.
U.S. Business Sector Capital Expenditures

The current level of data center capital deployed (annual spending on construction, rather than stated total commitments) can be put in the context of the overall scale of nearly $1 trillion in annual spending by business to use cloud services. Roughly half of global cloud services is provided by U.S. businesses.12
Of course, all infrastructures at scale necessarily consume significant amounts of energy to operate. Attention to that reality was triggered by a 2024 Federal Energy Regulatory Commission (FERC) forecast that drew on a range of estimates suggesting the U.S. would need between 50 GW and 130 GW more generating capacity than had been earlier imagined, ending the two-decade interregnum of nearly flat electric sector load growth.13
Cloud Services: Global Revenues
For context, the annual energy used by a single 1-GW data center is more than tenfold the annual energy used by cars on 1,000 miles of superhighway. It costs about $10 billion to build both a 1-GW data center and 1,000 miles of highways. And the cost of the energy-using GPUs inside the data center is another $20 billion, essentially the same as the $20 billion cost of the quantity of cars that 1,000 miles of highway supports (at peak).14
Thus, the biggest question for the 21st century: Are we at the equivalent of 1958 in building out a new AI-infused “information superhighway” infrastructure, or are we approaching the equivalent of the year 1992 when the last section of the 40,000 miles of interstate network was completed?
1.4 The Spending: Historical Context
In the face of disruptions, analysts and journalists seek illustrative analogies hoping some are useful to gauge trends. The AI race is often framed as a Manhattan Project or a moonshot.15 Both are category errors on two counts; both were anchored in government spending and programs, and both involved single-purpose goals, not infrastructures.
Analogizing the AI build-out with the construction of the U.S. Interstate Highway System does illuminate the energy features of nation-scale infrastructures, but, also unlike AI, the highway system was financed with public funds. The privately financed continental railroad system has also been offered; spending tripled from the 1840s to 1870s, peaking at over 5% of the nation’s GDP.16 However, a comparison with AI would be more analogous to considering the overall spending on the great transportation transformation made possible by the underlying technology of the combustion engine.
Stock Market Concentration by Sector
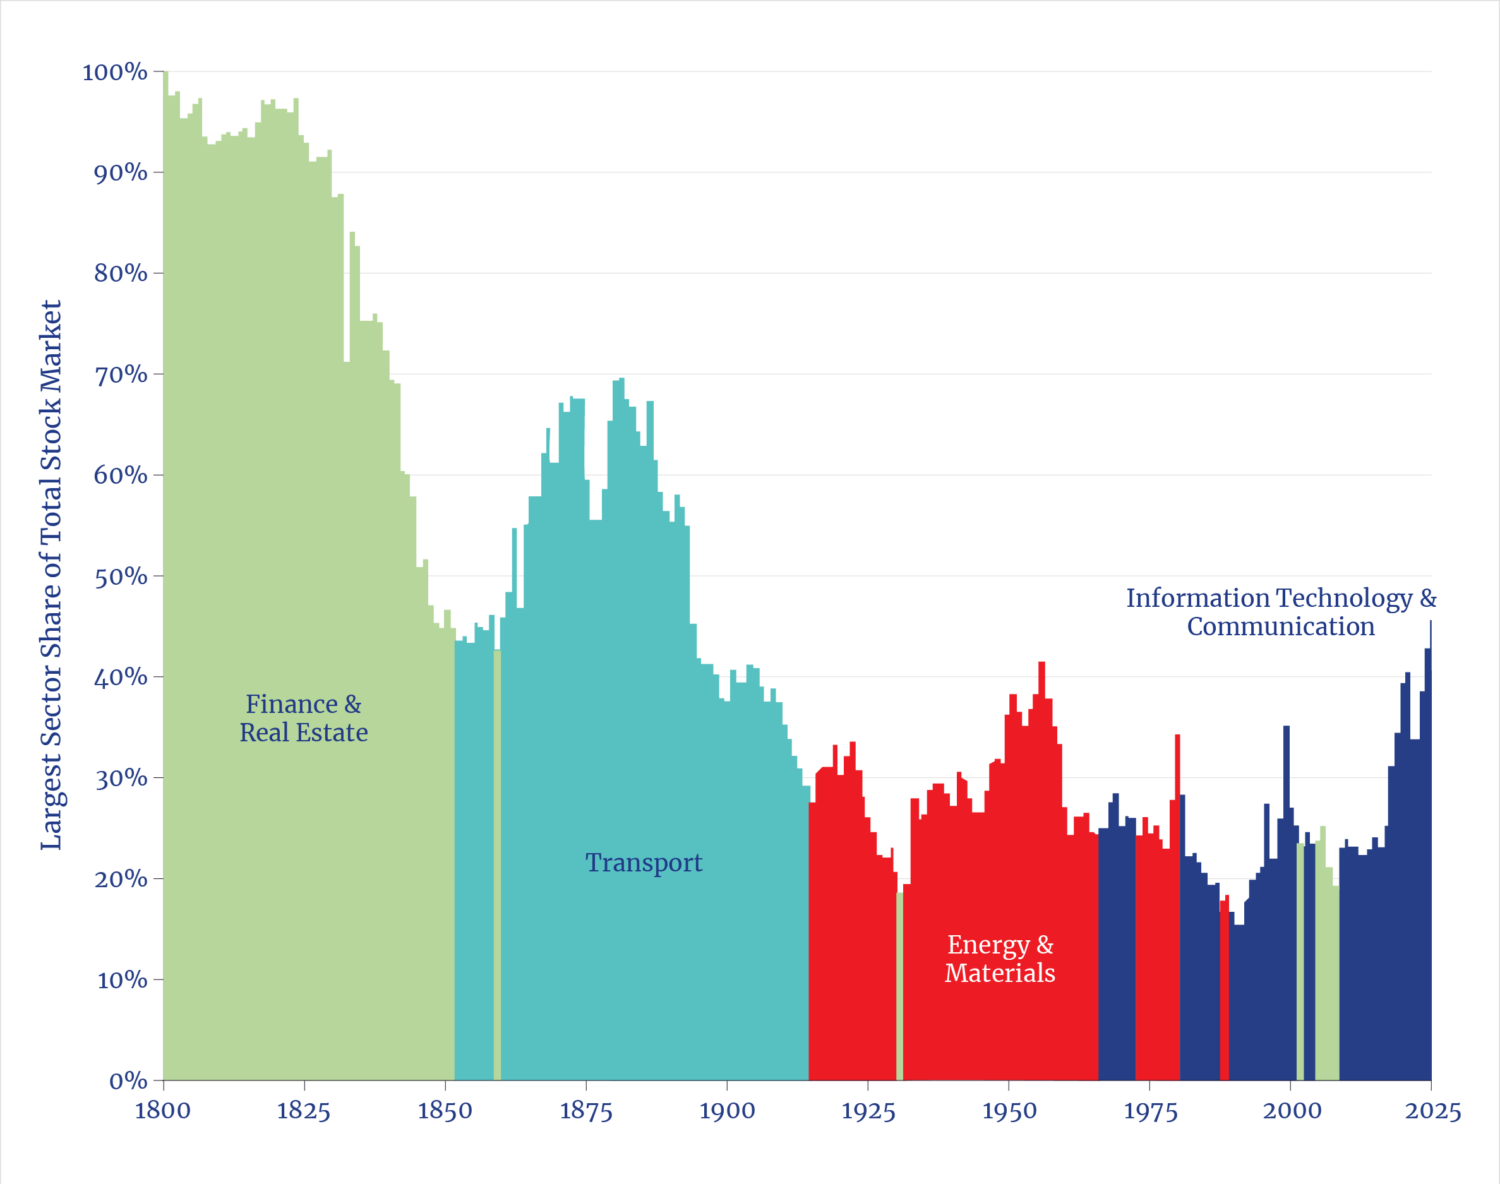
The emergence of the internet infrastructure offers a more recent analogy, though it too would be more relevant in terms of the contemporaneous expansion of the internet along with cellular networks and the PC. While that build-out was associated with the infamous dot-com bubble of 1999, it is obvious in hindsight that all the enthusiasms—and the collateral need for physical infrastructures—were all realized and exceeded in the subsequent years. That boom was privately financed, wherein the capital deployed reached 1.25% of GDP—a level that the AI/cloud build-out is about to reach.17
Perhaps the most suitable analogy is the revolutionary development of chemical science at the end of the 19th century and the subsequent emergence of the chemical industry in the early 20th century. Chemical science allowed humanity to manipulate the basic building blocks of molecules and atoms to invent and fabricate entirely new products and services, from pharmaceuticals to the polymers that are essential to nearly every modern product. Similarly, the knowledge underlying the invention of AI, machine learning, and large language models enables manipulation of basic data to create—hence the new locution of “AI factories”—entirely new classes of products and services for every sector of the economy.
Notably, over the two decades prior to 1929, private sector investment to build what was then revolutionary chemical factories and infrastructures rose to over 5% of GDP.18
Construction Spending by Chemical Industries: 1900 to 1930
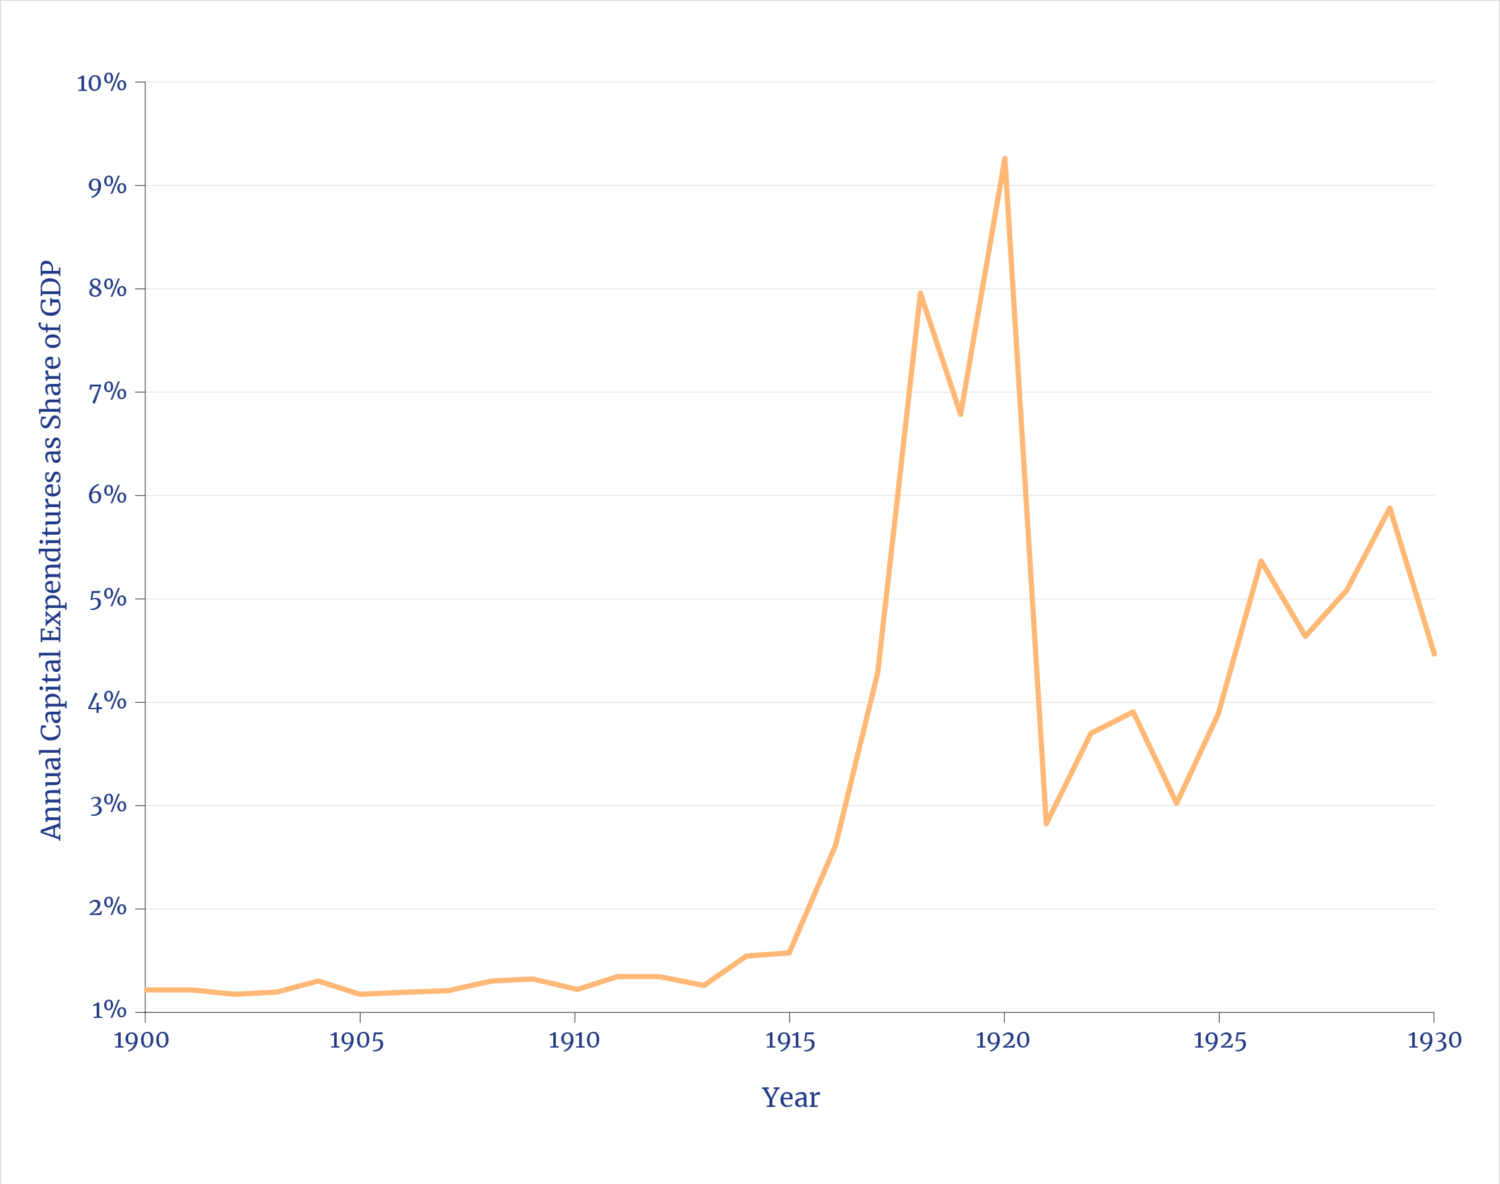
To match that share of GDP by 2030, AI spending would have to reach nearly $2 trillion a year, a level in the range of some forecasts.19
1.5 The Impact: Productivity Deficit
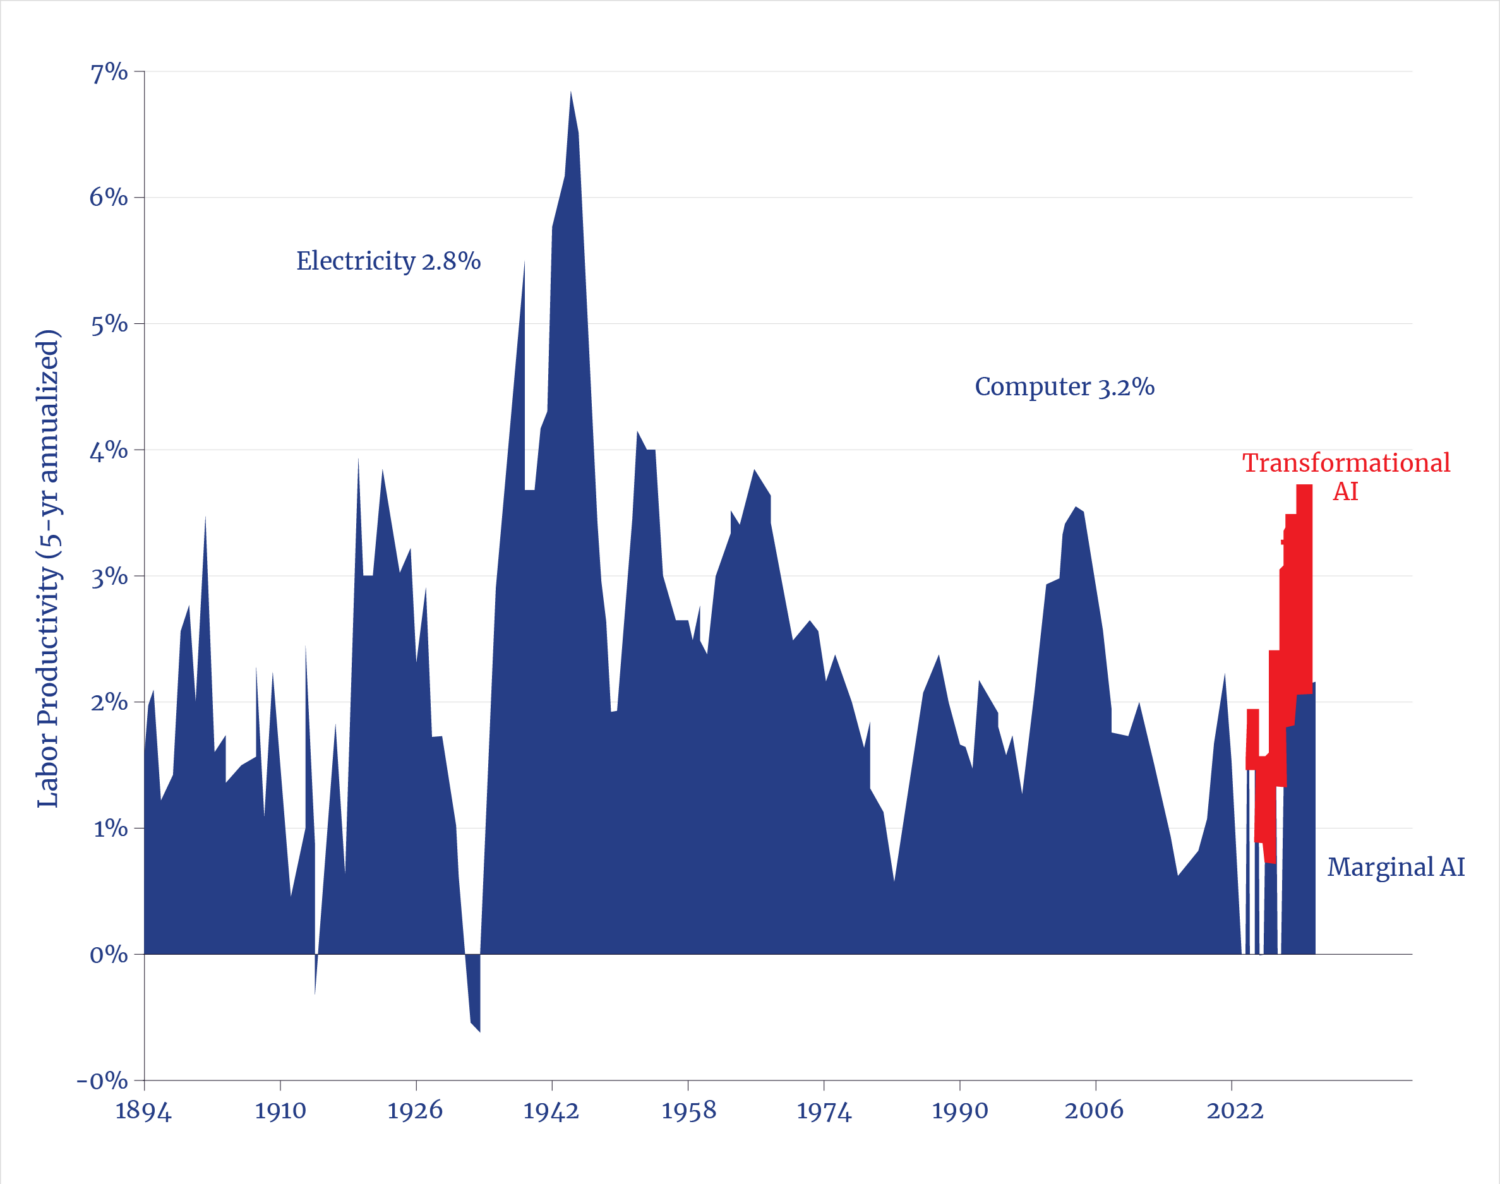
In his acceptance speech for the 1987 Nobel Prize in Economic Sciences, Robert Solow observed that “technology remains the dominant engine of growth, with human capital investment in second place.”20 The collective effect of technological progress—enabled by capital markets and facilitated by institutions—yielded an historic jump in U.S. labor productivity following World War II which, in turn, produced an enormous wealth expansion.
Labor Productivity Growth Rate
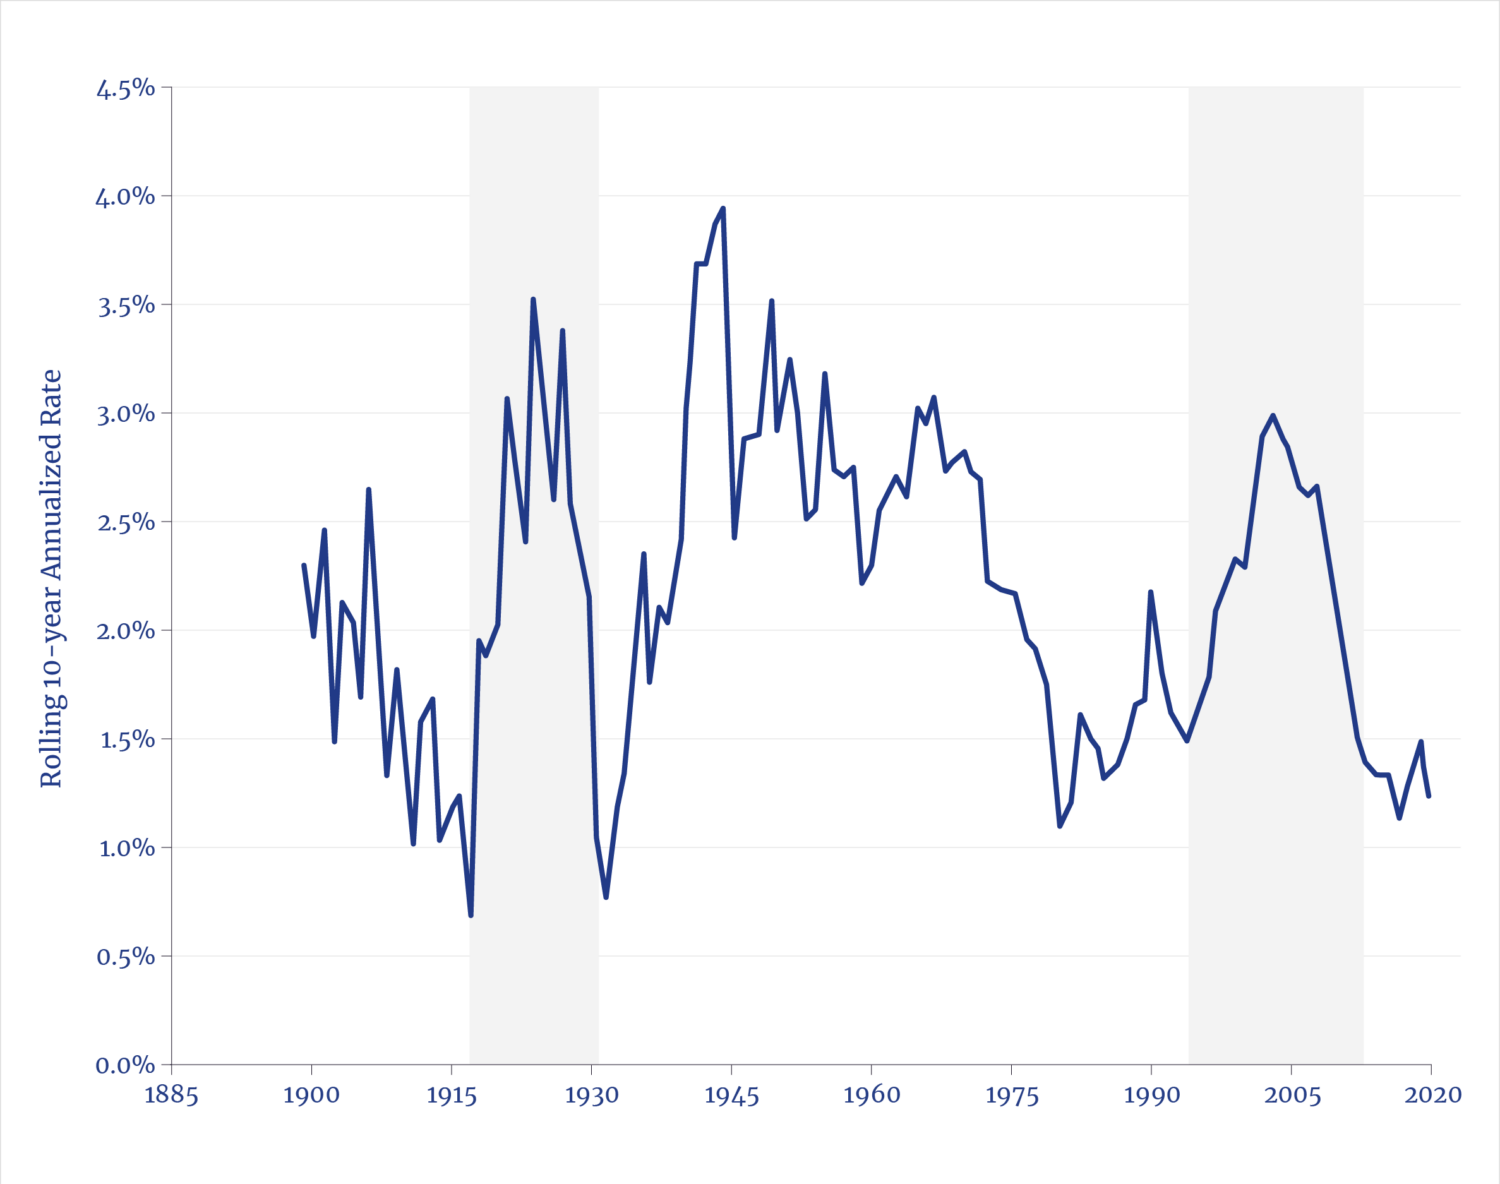
Technology has, over various periods in history, yielded similar gains in productivity. From 1910 to 1930, the labor-hours needed per car manufactured dropped nearly fivefold, as did the labor-hours per ton of steel.21 The railroad-era productivity gains in shipping were visible not just from greater speed than horse-and-wagon transport but also because of a 25-fold collapse in the ton-mile cost of shipping goods, with similar gains for moving people.
Looking further back, the flourishing Middle Ages came from machine inventions in an “age of reason and mathematics,” as economic historian Jean Gimpel framed it in his book, The Medieval Machine. Back then, many machines cut man-hours needed by as much as tenfold, far more than the mere 10% to 30% labor cuts now being attributed to AI.22
U.S. GDP: Two Productivity Growth Scenarios
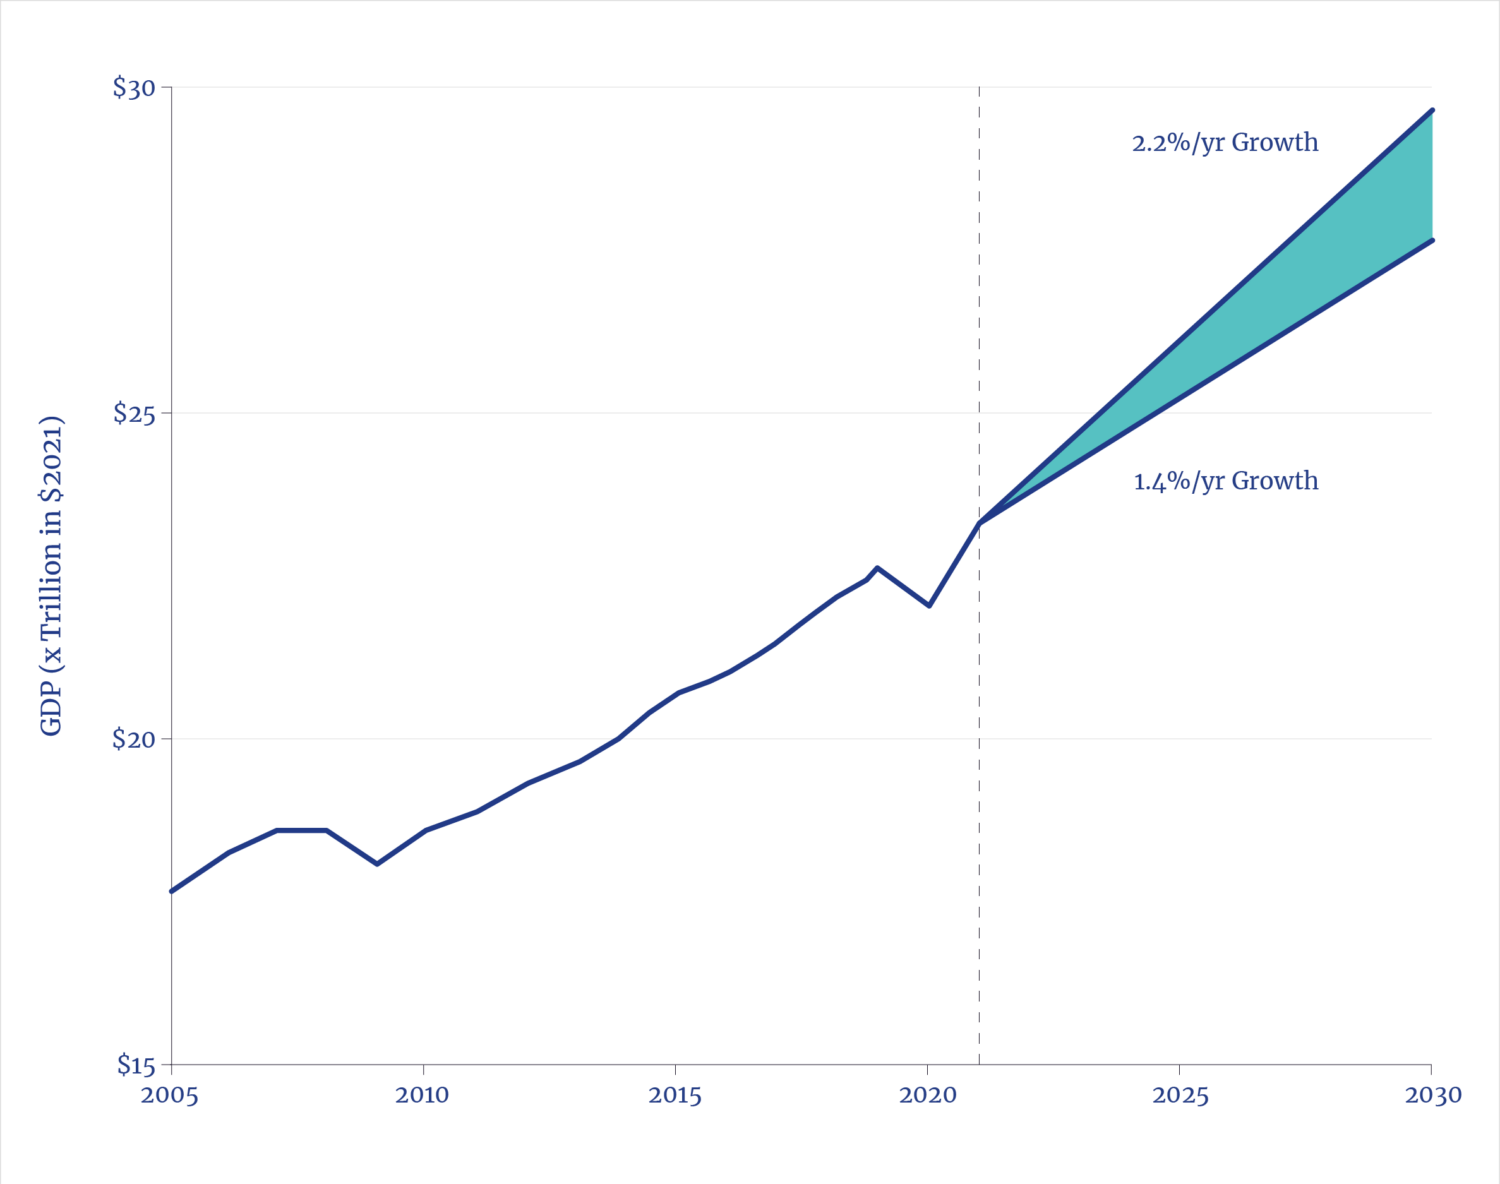
The essence of AI’s promise lies in how—across many and varied applications—it will yield meaningful and, eventually, truly consequential productivity gains. Indeed, market adoption is fundamentally only explicable by virtue of the opportunity to improve productivity.
In its economic forecasts, the U.S. Congressional Budget Office assumes a 1.4% annual productivity growth rate for the next decade, a slight increase over the past decade’s anemic and historically low average of 1.2%.23 While some analysts believe AI can boost the U.S. economy to a 4% productivity growth rate, the highest level in the postwar period—and there is good evidence to support that optimism—consider instead the implications of merely restoring the rate to the postwar long-run average of 2.2%. That would, arithmetically, induce a cumulative $10 trillion of greater economic growth over the coming decade than is currently forecast.
1.6 The Impact: Productivity Promise
The absence of any recent, dramatic increases in corporate revenues has been held up as evidence for the absence of real benefits from AI.24 However, the proper place to start looking is in cost savings that yield the same output, i.e., the very definition of productivity.
Note, for example, the conclusion from a survey of corporate uses for AI thus far, per the Stanford University’s 2025 AI Index Report: “The areas where respondents most frequently reported that their use of AI has resulted in cost savings were service operations (49%), supply chain and inventory management (43%), and software engineering (41%). For revenue gains, the functions that most commonly benefited from their use of AI include marketing and sales (71%), supply chain and inventory management (63%), and service operations (57%).”25
Reported Impacts from Using AI
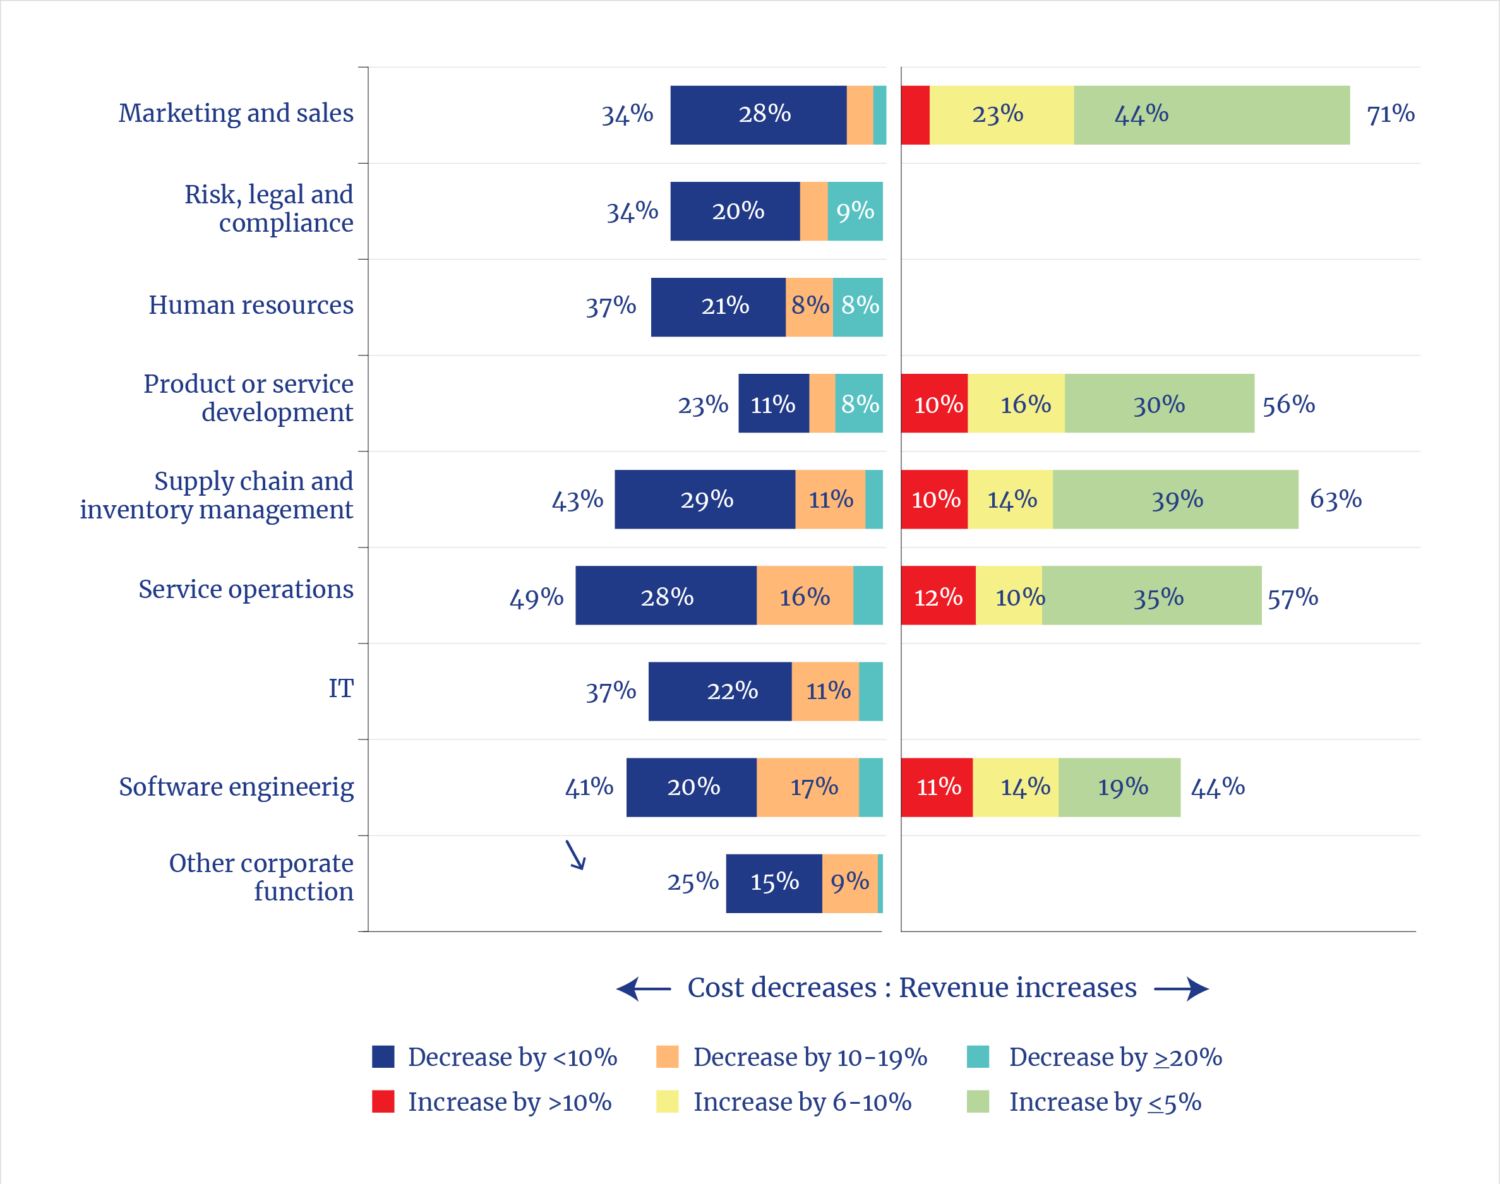
In other words, AI productivity gains are coming first in information-centric applications, the proverbial low-hanging fruit for applying software. Applications in physical systems—which constitute 80% of the GDP—will take longer but likely be more consequential.
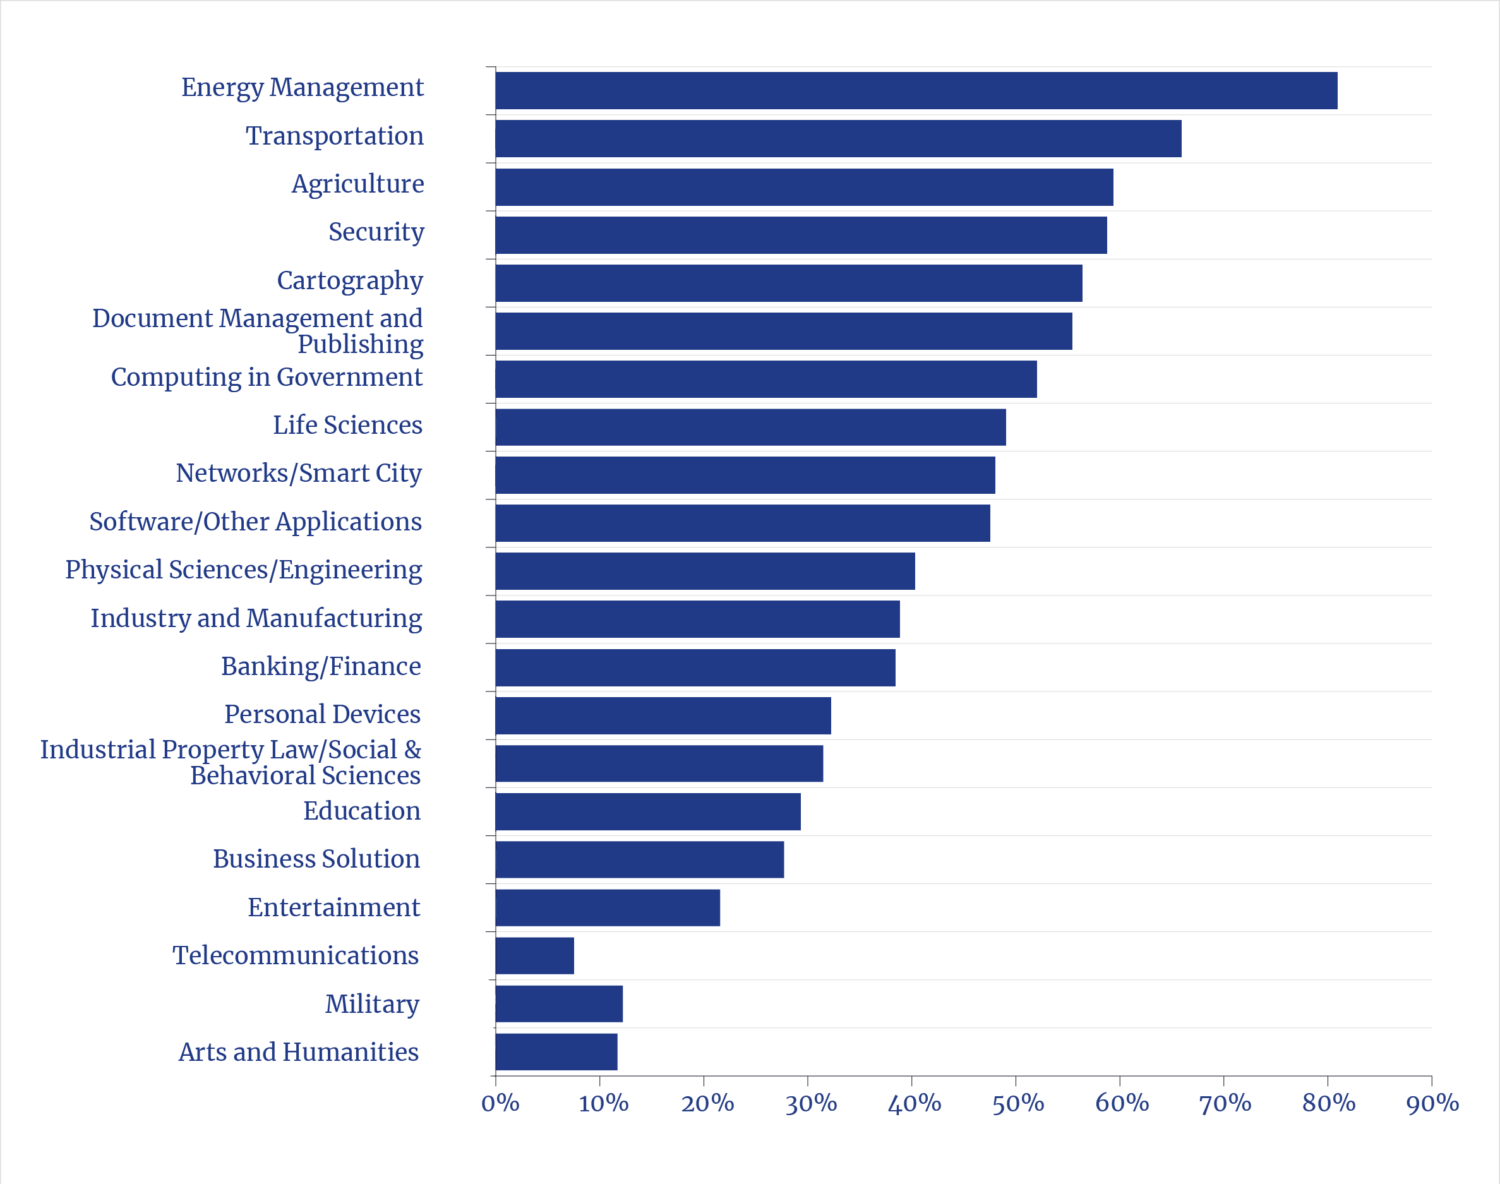
Because businesses file patents in advance of widespread deployment, we can use patents as a leading indicator of where future productivity gains are likely to emerge. The data show not only a boom in AI patents issued over the past half-dozen years but also that many are in operational business activities where productivity gains are consequential.
Growth in AI Patents Issued (2018 -2023)
1.7 Adoption: Early Days
For all businesses, the opportunity to incorporate new technologies—whether hardware or software—into existing products or processes invariably entails a well-known learning curve. There are no exceptions.
Consider manufacturing, not only because of the recent political rediscovery of the fundamental importance of that sector but also because of U.S. goals and policies for reshoring. Rockwell Automation’s 2025 global survey of over 1,500 manufacturers found 95% of respondents have “either invested in or plan to invest in” AI. Unsurprisingly and consistent with history, the current top uses were in information-centric activities; quality control (top application with 50% of respondents), cybersecurity (49%), and process automation (42%). The areas of robotics were significant (37%) and logistics (36%) but lagging.26 As the Rockwell survey also noted, “deploying and integrating new technology (21%) and balancing quality and profitability (21%) are the biggest internal obstacles to growth in the next 12 months.”
Development Status Survey of Businesses Using AI
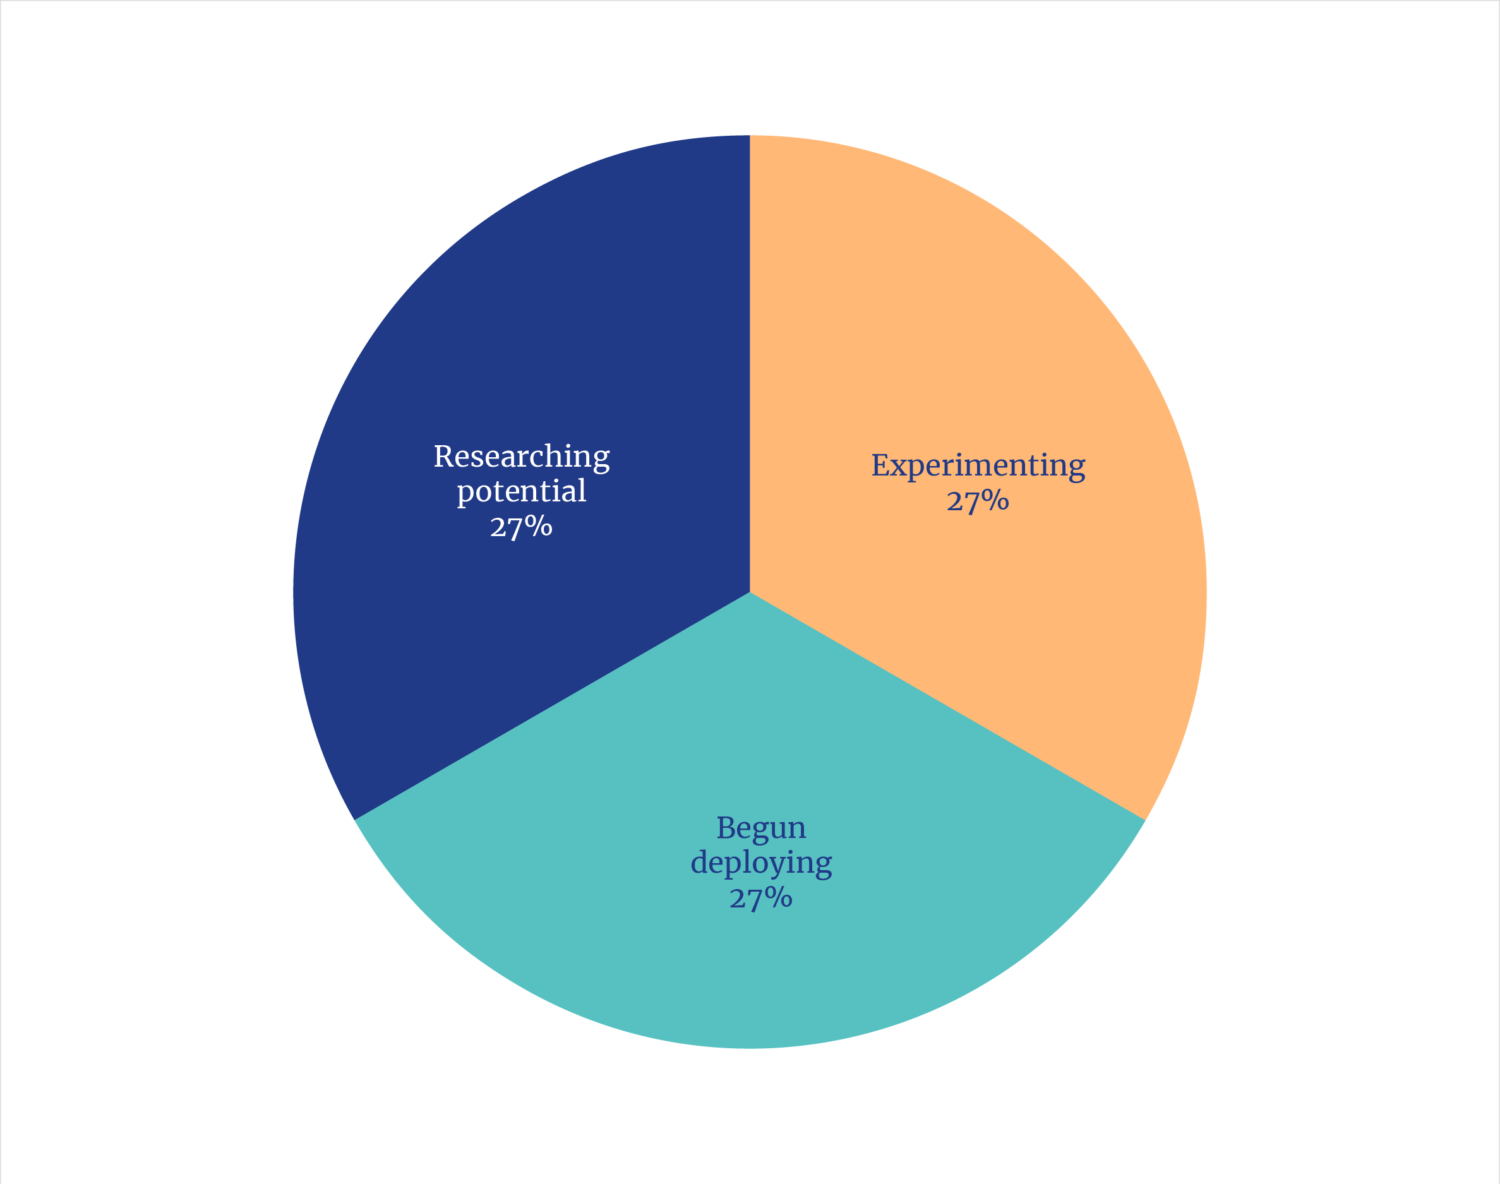
Other analysts report similar realities, i.e., there is not a question of utility, but that it takes time to gain clarity and integrate. As a Gartner analysis found, the kinds of deep changes to processes and procedures take years, not months. However, Gartner sees corporate AI “leaders” planning meaningful investments and actions in the one-to-three-year time period, i.e., in the timeframes that the builders of AI machinery are rushing to satisfy.27
Survey of AI Uses by Industry
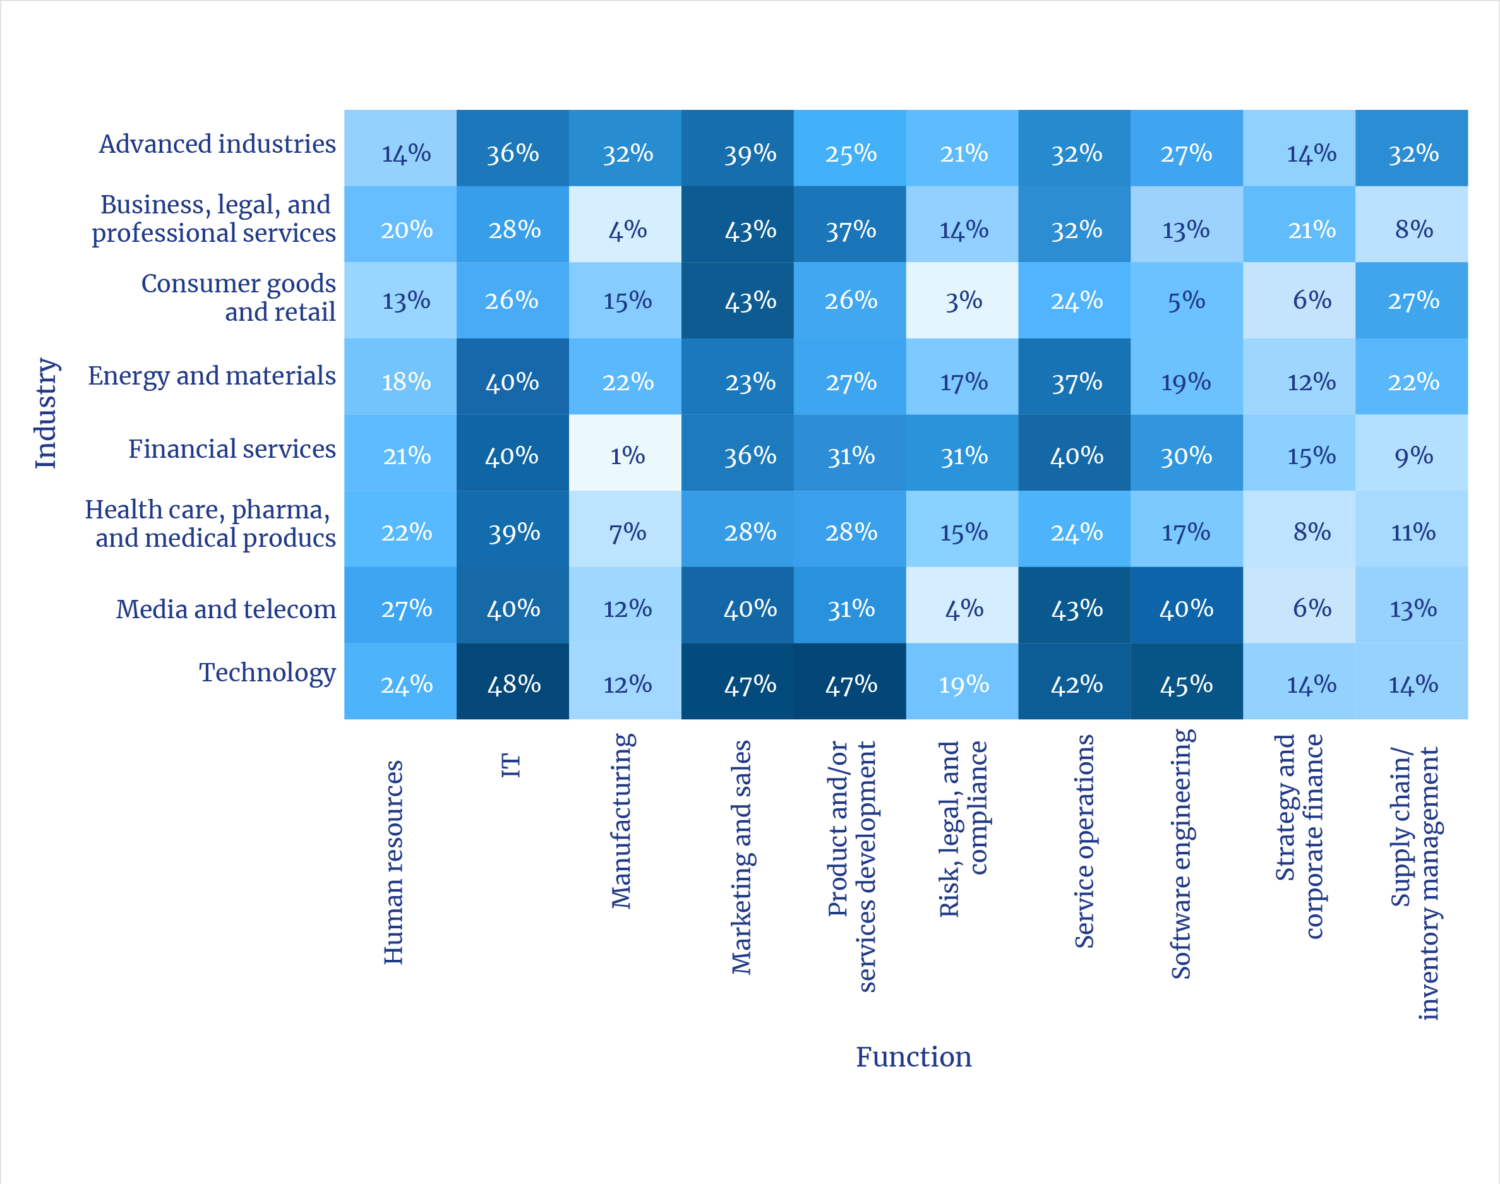
Similarly, a recent McKinsey survey shows more details on the same pattern of early AI adoption in the easier information-centric domains, with lagging but indicative of adoption in hardware domains.28 This suggests, of course, that those providing AI infrastructures are seeing the same pattern and starting to build today what they expect to be a future and significant market.
1.8 A Generational Secular Shift
AI is a technology that will, as with all radically new technologies, become more useful and less expensive with time. It has been widely hailed as transformational, and by all measures, that appears to be a valid conclusion. But it is one that also lends itself to hyperbole and misdirection. If, as the facts suggest, AI is indeed a generational advance in underlying and broad-based productivity gains, then the U.S., and global economies, are on the cusp of a long-run, if only episodic, return to economic growth.
U.S. Business Sector Labor Productivity
Newly Founded AI Companies
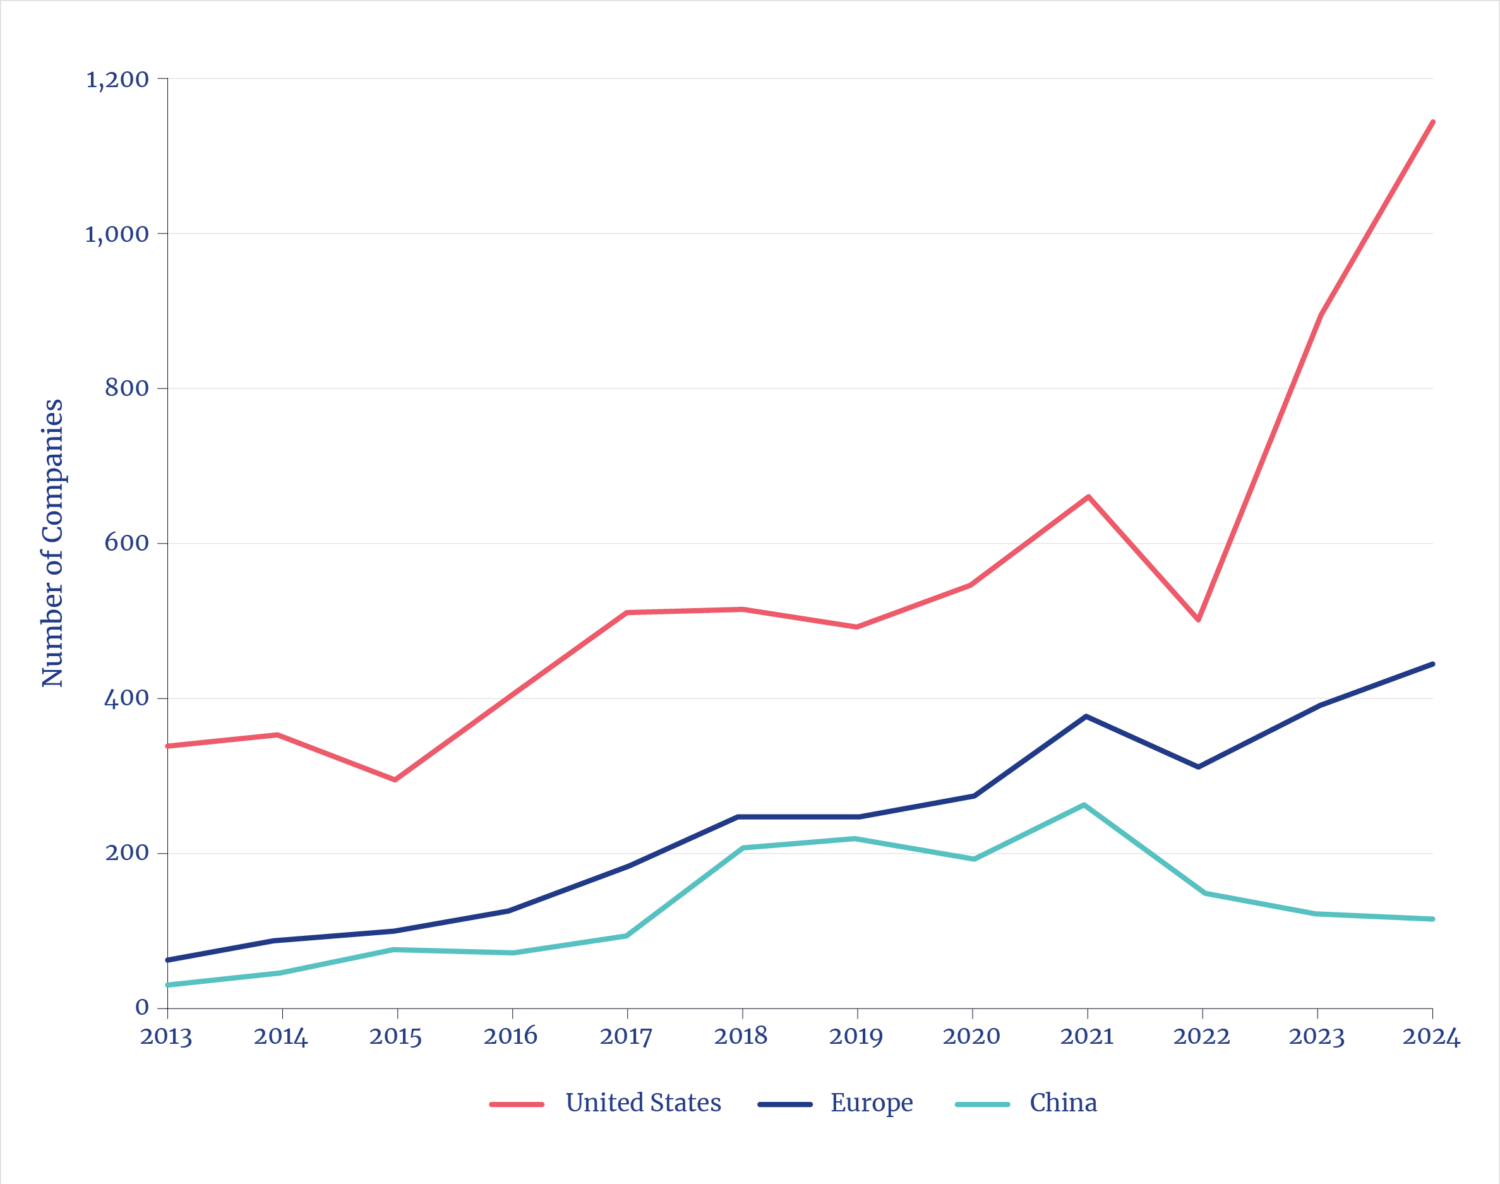
AI was invented and first deployed in the U.S. We are also home to nearly half of all global data center compute power, about three-fourths of all giga-scale AI data centers under construction, as well as all newly funded AI companies. The obvious question on the minds of policymakers and investors: Can the U.S. build the necessary infrastructure—and at the velocity the opportunity seems to demand?
We think the answer is yes in terms of the core engineering capabilities of the nation, but with caveats about institutional realities.
2. AI ENERGY BOOM
2.1 Energy Appetites in the Digital Ecosystem
There is no longer any illusion that the digital ecosystem offers a kind of free lunch when it comes to energy and materials—an illusion fueled, if unintentionally, by terminology such as virtual reality, cyberspace, or smartphones miniaturization. Even though global digital electricity uses have been significant and rising for two decades, it’s the arrival of energy-hungry AI that has generated all the attention. In October, Nvidia CEO Jensen Huang said that “AI is energy, AI is chips, the models, and the applications . . . . And we need more energy.”29 Earlier this year, in U.S. Senate testimony, Sam Altman, CEO of OpenAI (creator of ChatGPT) said: “Eventually, the cost of intelligence, the cost of AI, will converge to the cost of energy. How much you can have—the abundance of it—will be limited by the abundance of energy.”30
Where Electricity Is Used in the Digital Universe
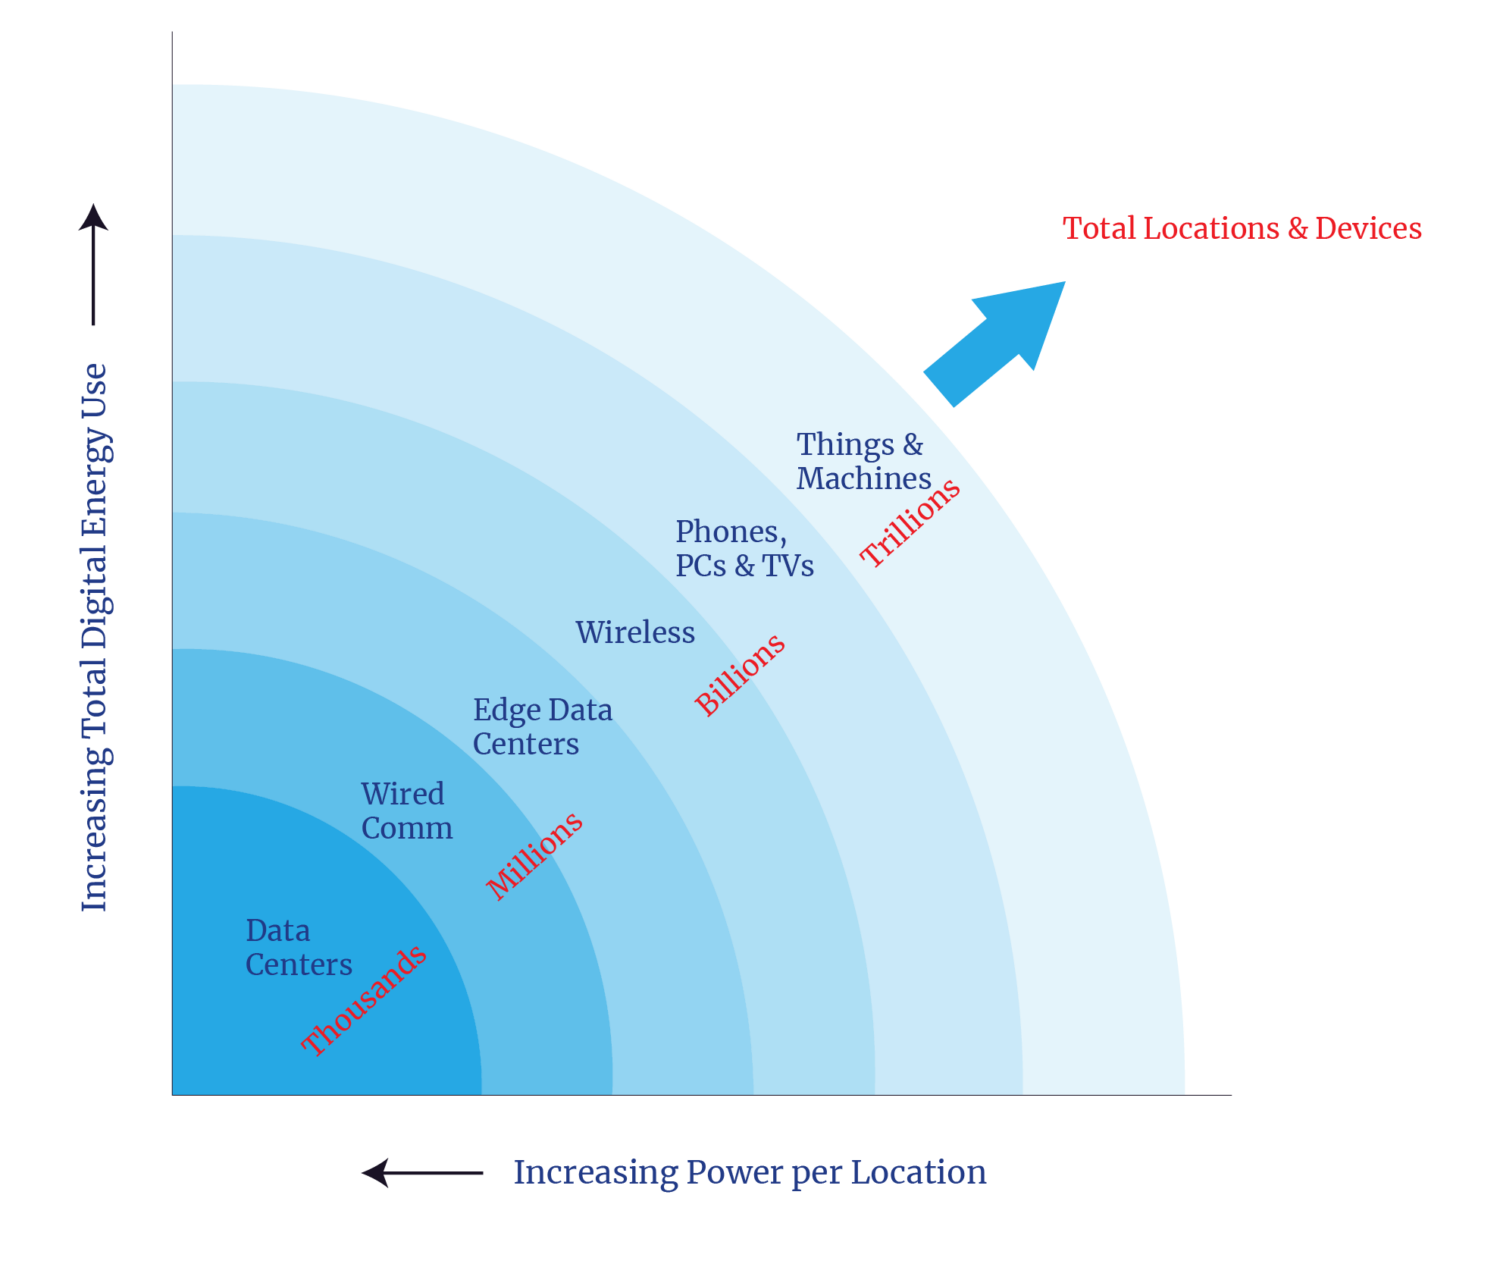
While news stories have focused on the electricity demands of massive AI data centers being built and planned, those buildings constitute just one of the four features of energy use associated with AI. To gauge overall potential future digital power requirements, one should also consider the associated, embodied, and induced energy demands.
- Associated: The wired (fiber) and wireless (cellular) networks that connect data centers and users consume a quantity of electricity rivaling data centers.31 Network traffic will double by 2030, even before accounting for additional traffic to service AI demands.32 There are also substantial and rising loads from blockchains and cryptocurrencies, as well as edge data centers, the latter essential for AI uses that require low latency.33
- Embodied: Fabricating global semiconductors alone uses about one-third as much electricity as global data centers.34 Energy is also used to produce all the related digital hardware.
- Induced: The expected economic growth induced by AI will lead to greater overall societal energy use, a factor likely to be tenfold to twentyfold greater than the energy directly used by data centers.35 If the promise of AI-driven biological discovery does lead to longer, healthier lifespans, that too will induce more energy use by those people.36
All the above features will play a role affecting national energy demand in the coming decade. However, the unique feature of our time is the velocity and scale of the new classes of AI-centric data centers: the combination is unprecedented. The number of such behemoths that will be built will be the primary determinant of accurately guessing near-term electricity demands.
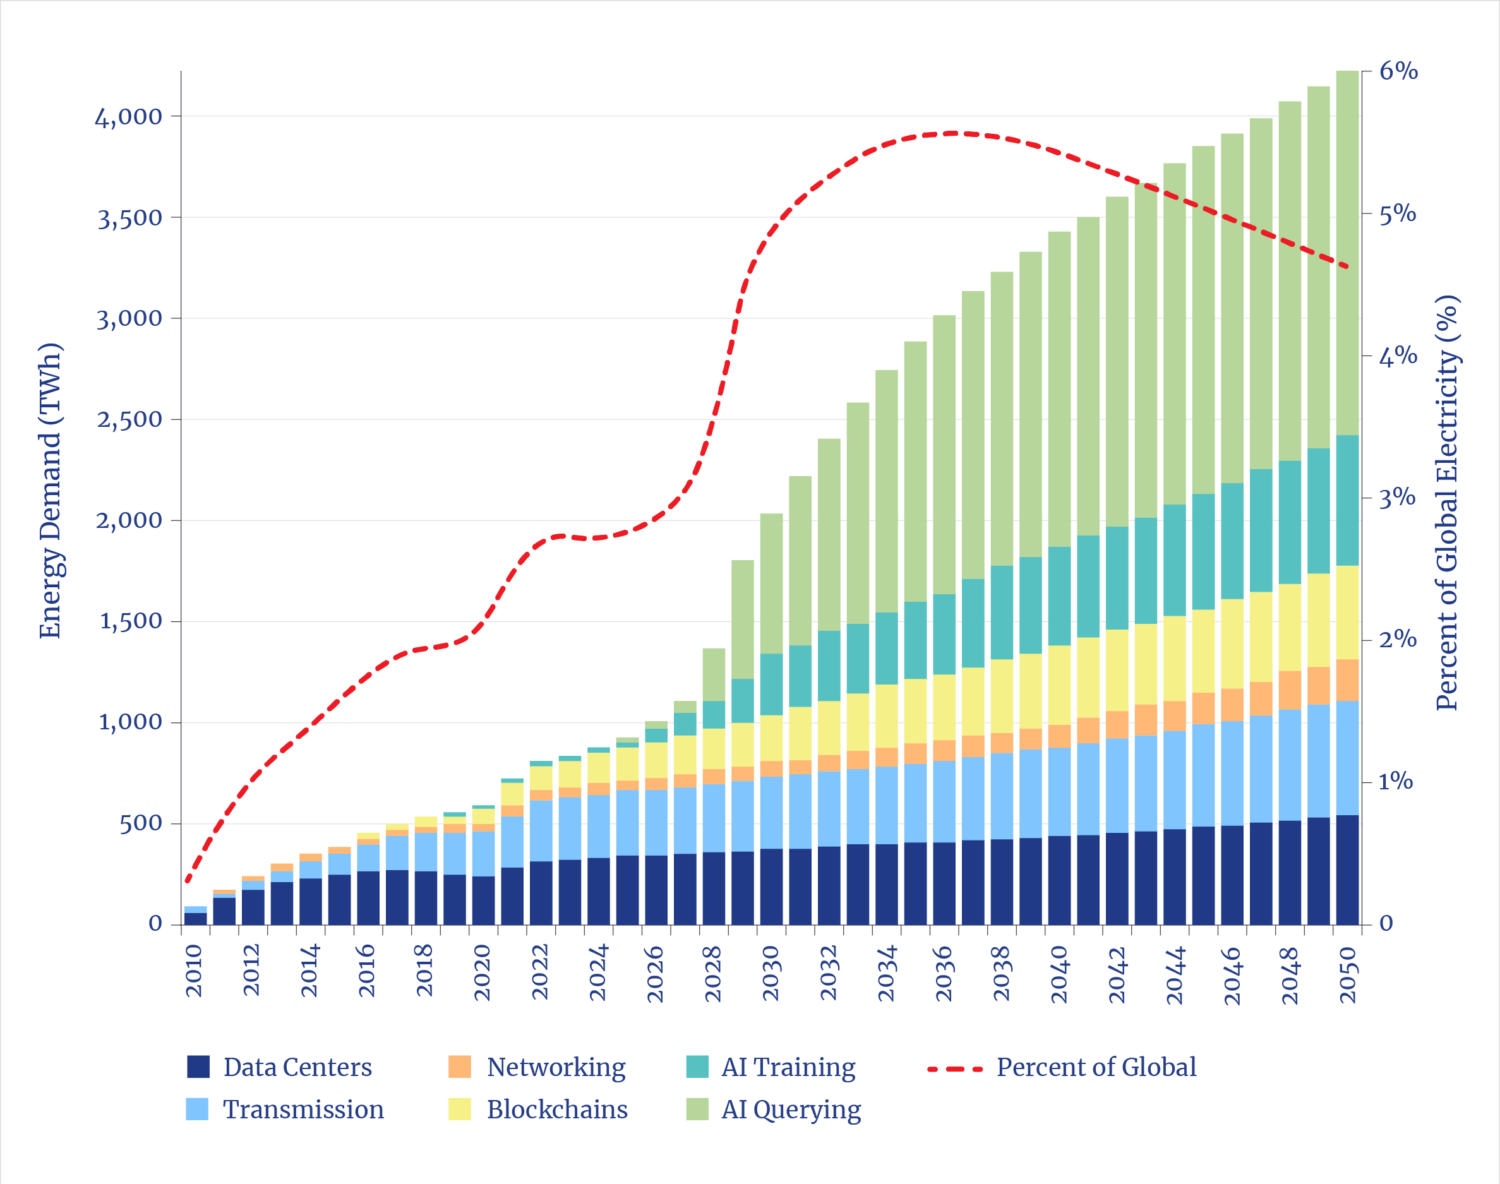
Total Energy Demands in the Digital Universe
2.2 Near-Term AI Digital Power Demand: Scale
It is a sign of the times that data centers are rarely measured in terms of compute capacity in bits, but instead in terms of electricity demand in terms of watts. Until recently, the U.S. data center industry had been adding a total of about 500 MW of new capacity annually over the prior decade. That rate tripled in 2022 and has doubled again since.37 Thus far, construction underway is on track to double again in 2025.
The capacity added in 2025 alone, likely over 10 GW, is comparable to the peak daily electric demand of New York City.
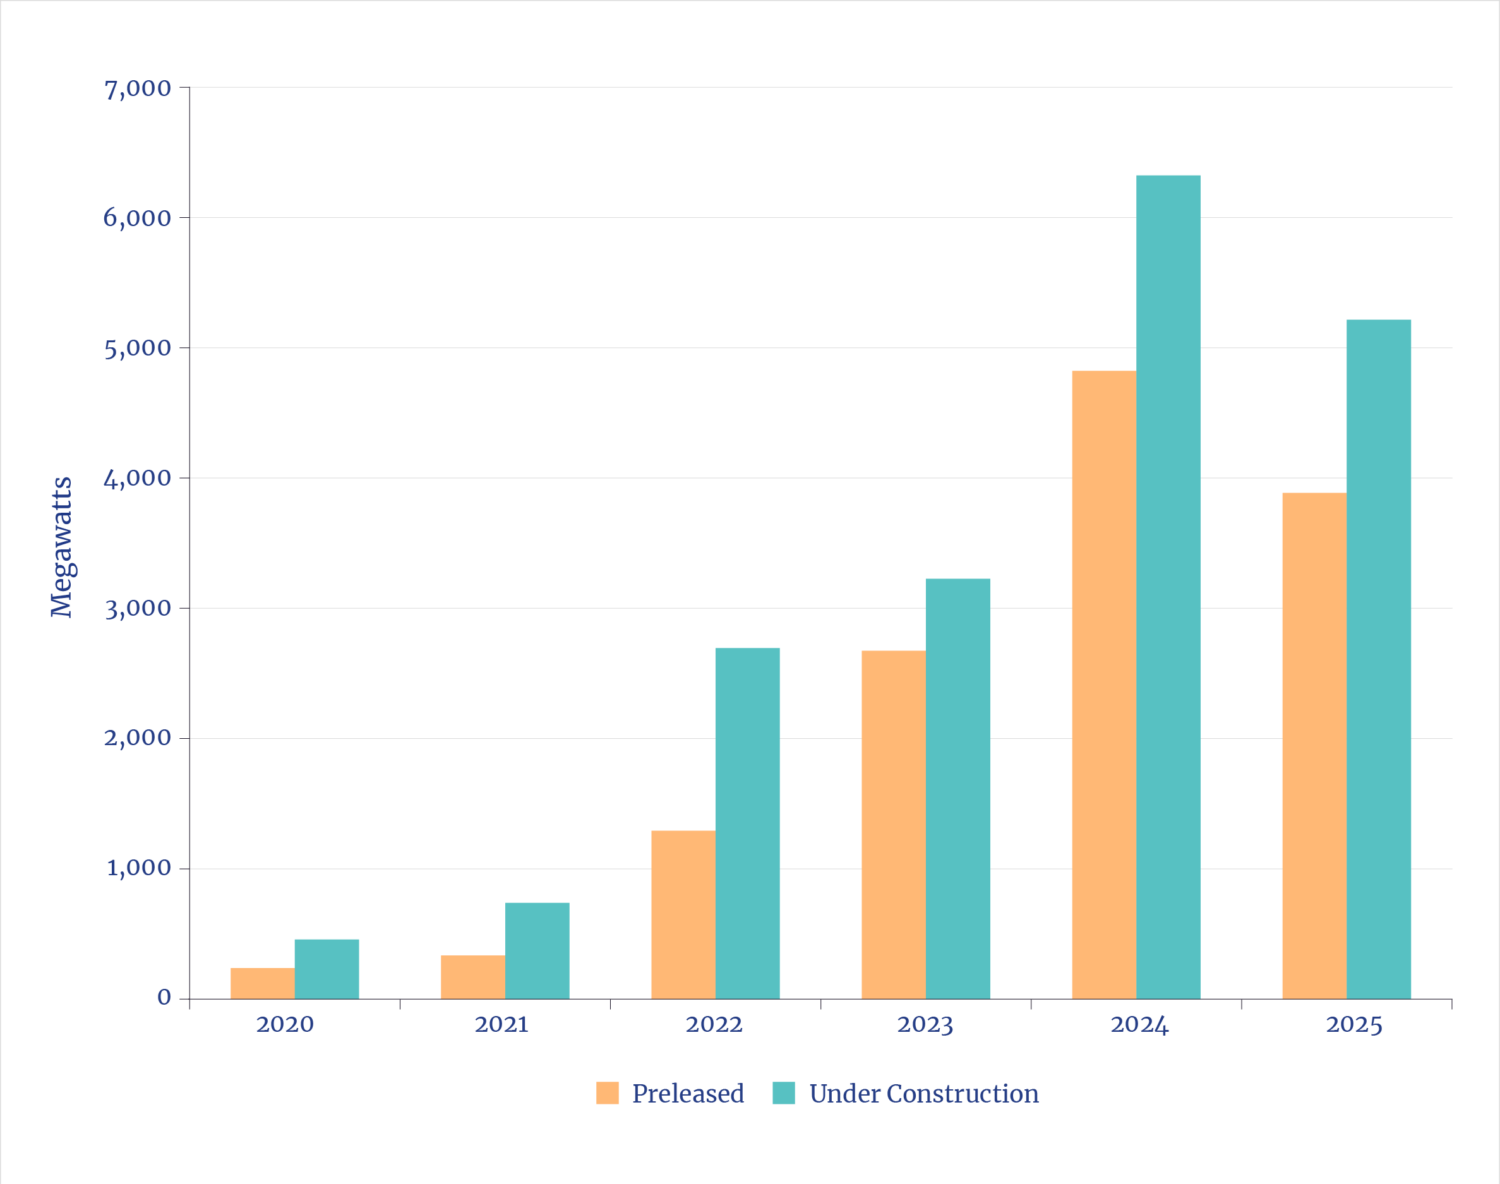
Some commentators wonder if there is a market for all this. But data center vacancy rates (a standard real estate measure) are at a record low of 1.6%, and three-fourths of the assets under construction are preleased, and data center rental rates are up 60% since 2021.38 Even without further expansion, if the current build rate continues through next year, that will double the total installed data center capacity built in the U.S. since 2000. How much faster the build rate expands is the question of the decade.
U.S. Data Centers Under Construction and Preleased
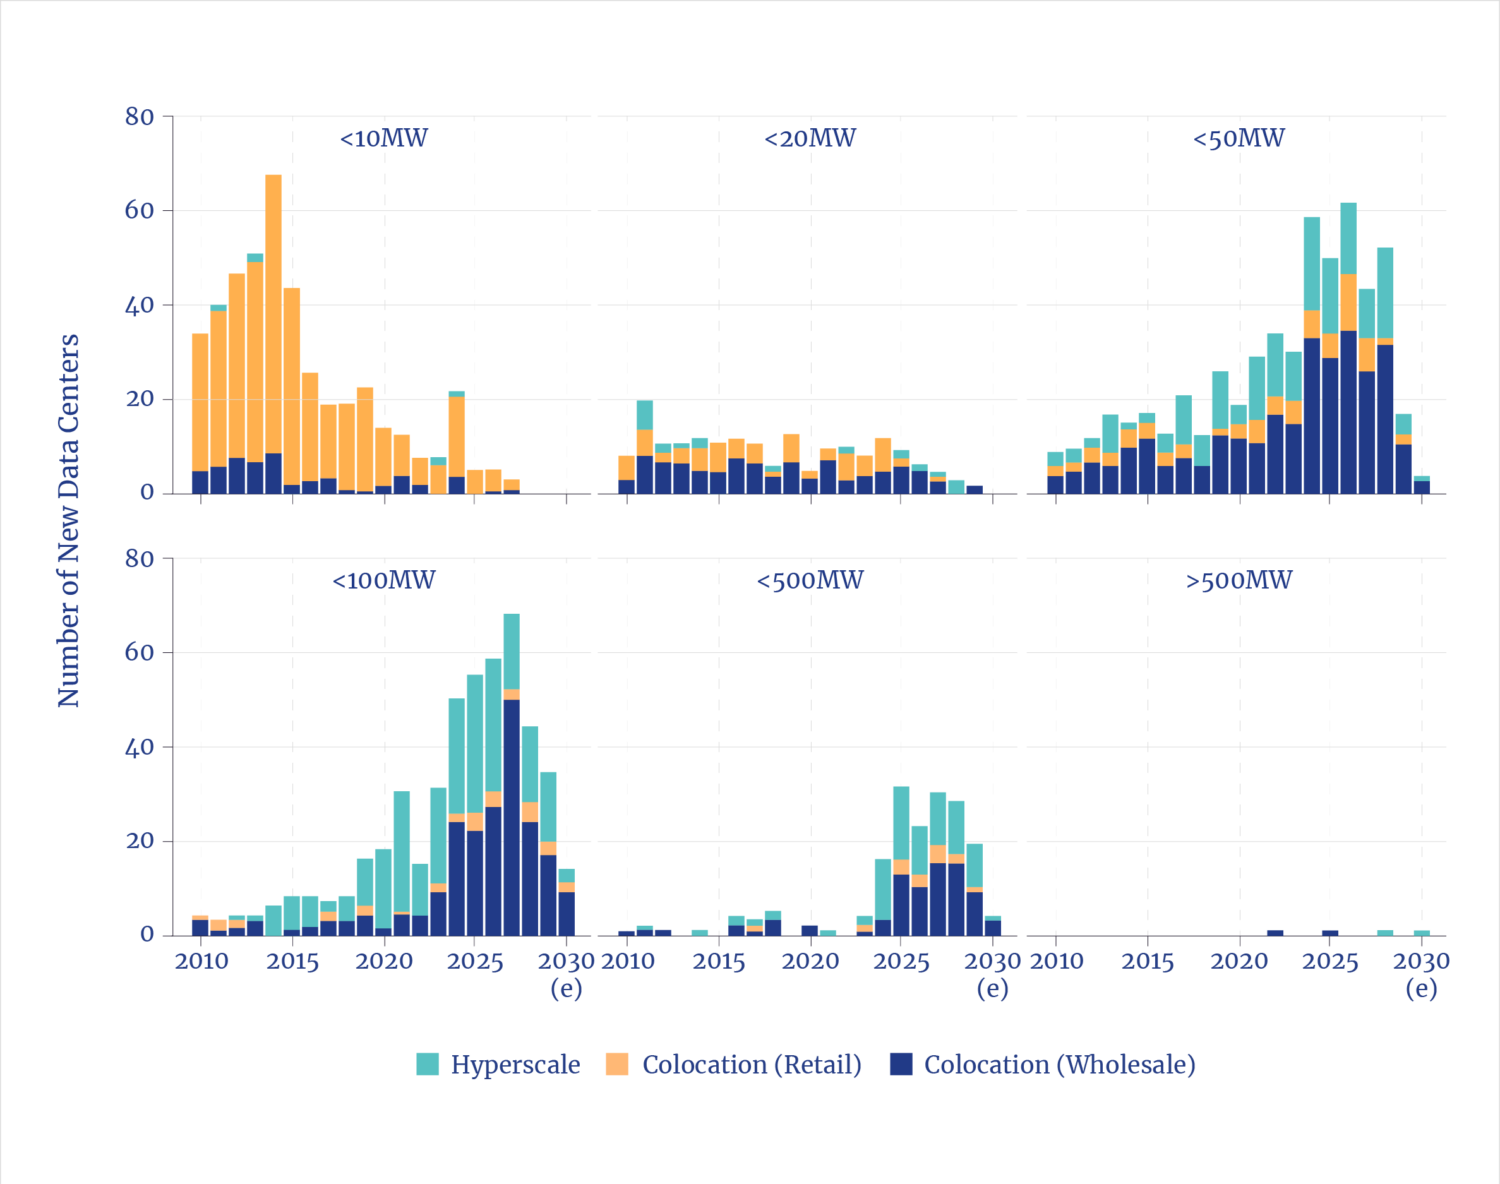
Adding to the challenges is the unprecedented scale of individual facilities. The scale comes from the need for hundreds of thousands of AI chips per data center to undertake the astonishingly complex tasks that are inherent to machine learning, i.e., learning useful things about the even more complex real world. Research from the University of Southern California shows that typical data centers built from 2010 to 2020 were each under 20 MW per facility.39 Now 50 MW to 100 MW is common, dozens are in the 500 MW range, and a handful are GW class.
The combined scale and velocity present challenges. Utility sector planners have been caught flat-footed in anticipating an end to the two-decade interregnum of nearly flat growth in electricity demand. The rate at which new data centers are built (two to three years) at the scale of demand per facility introduces engineering, construction, and permitting challenges (and, for utilities, the challenge of not increasing consumer costs), while ensuring that large, localized loads don’t compromise grid stability
For context: over the past 60 years, only 26 facilities individually greater than 300 MW were added to the nation’s grids, and 20 of those were pumped-storage hydroelectric plants (which consume and deliver power, a portent for data centers). The remaining included data centers, a chip factory, an LNG terminal and a steel mill. Over that long period, 15 other more than 300 MW facilities were built, but none were grid connected (a dozen of which were chemical refineries and three LNG terminals). Meanwhile, plans have been announced to build hundreds of data centers, each exceeding 300 MW.
2.3 Mid-term AI Digital Power Demand: Guesses?
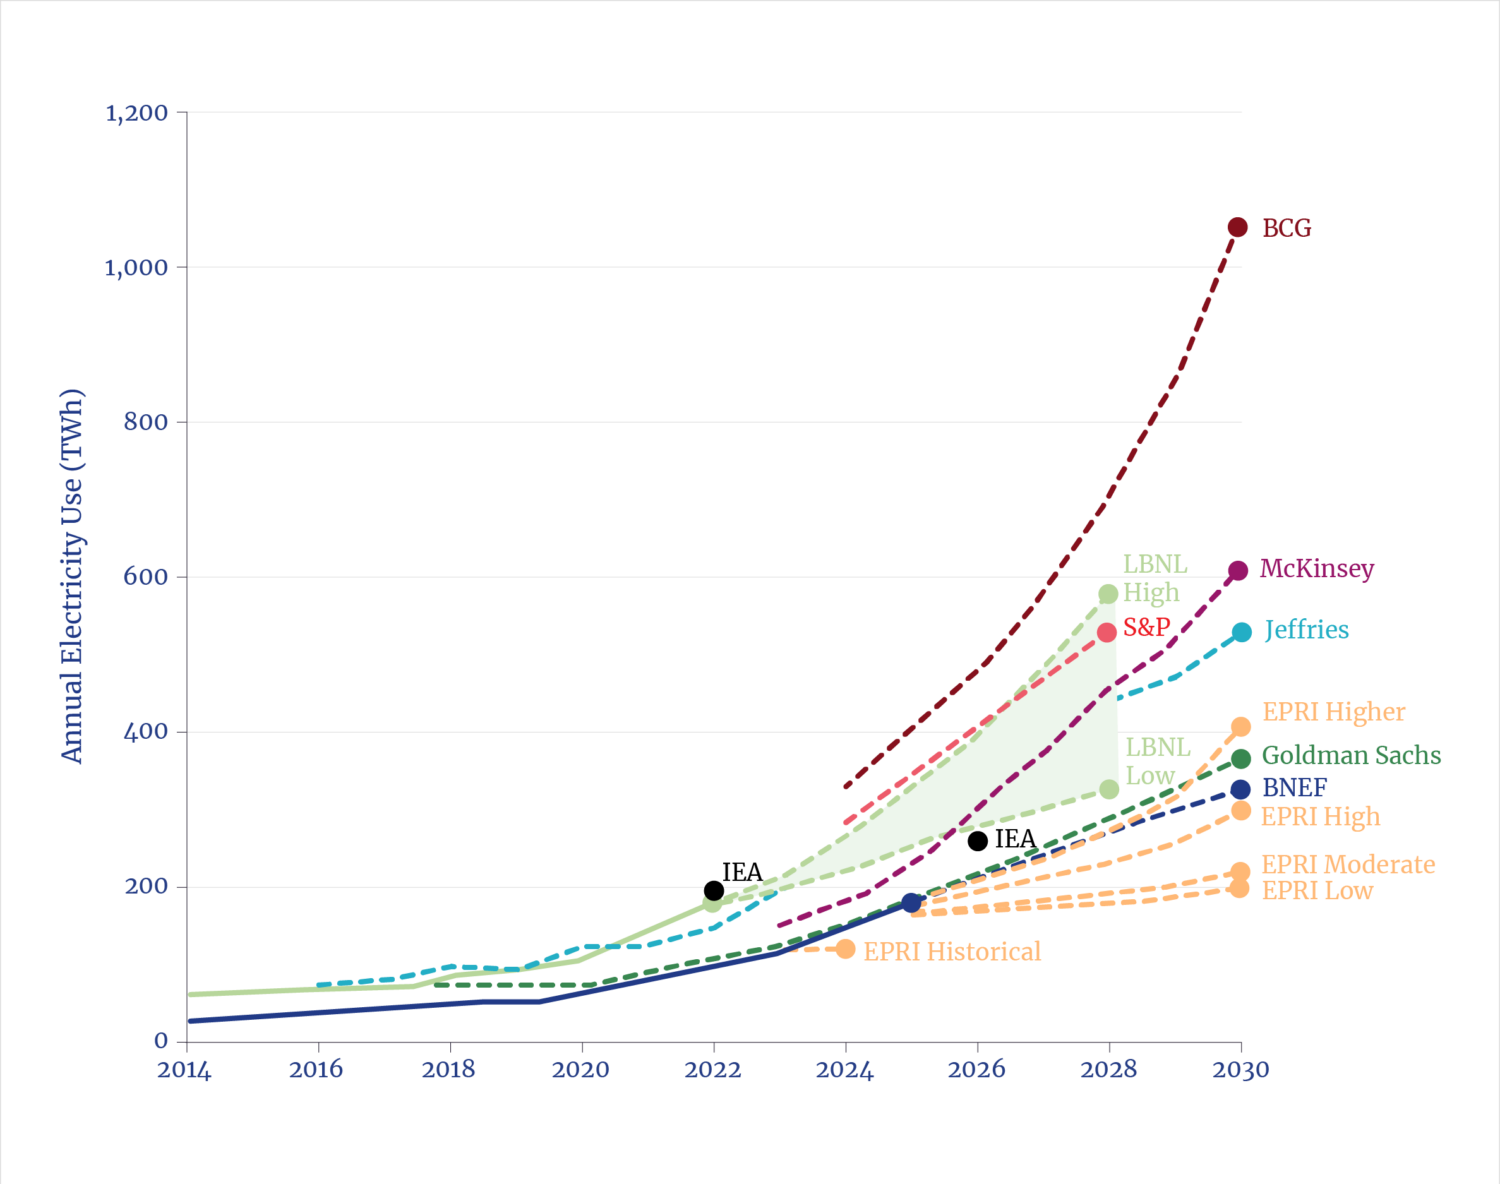
Policymakers, utility planners, investors, and vendors all have the same question: How much and how fast will data center demand escalate by 2030? Myriad forecasts and analyses are in circulation, including from organizations such as Goldman Sachs40, Brookfield Management41, DNV42, SemiAnalysis43, Lawrence Berkeley National Laboratory44, Rand45, Rystad Energy46, S&P Global47, Bain & Company48, Thunder Said Energy49, and of course the IEA50. A World Resources Institute analysis illustrated the fact the enormous three-fold variation in the range of 2030 forecasts for electricity demand from US data centers.51
Various Forecasts for U.S. Data Center Electricity Demand
It bears noting that many analyses express demand in GW (the load) and others in GWh or TWh, the annual electricity consumed. (The latter necessarily requires assumptions about capacity utilization.) Some forecasts consider only power for AI chips and may or may not include demand for conventional compute. (Very few include the networks and related electricity-using hardware.) Some analyses are U.S.-focused, others global, though all note that most of the growth is in the U.S.
Finally, forecasts differentiate between the two different features of AI: learning, i.e., the “AI factory” that develops the original capability to, say, read an X-ray, answer natural language questions, or discover a new drug; and inference, i.e., the use of AI chips (after training/learning) in data centers and distributed devices to perform tasks. Every analysis sees inference electricity demands overtaking the already soaring and continually rising demand for the learning phase.52
Probability of Various Data Center Demand Forecasts for 2030
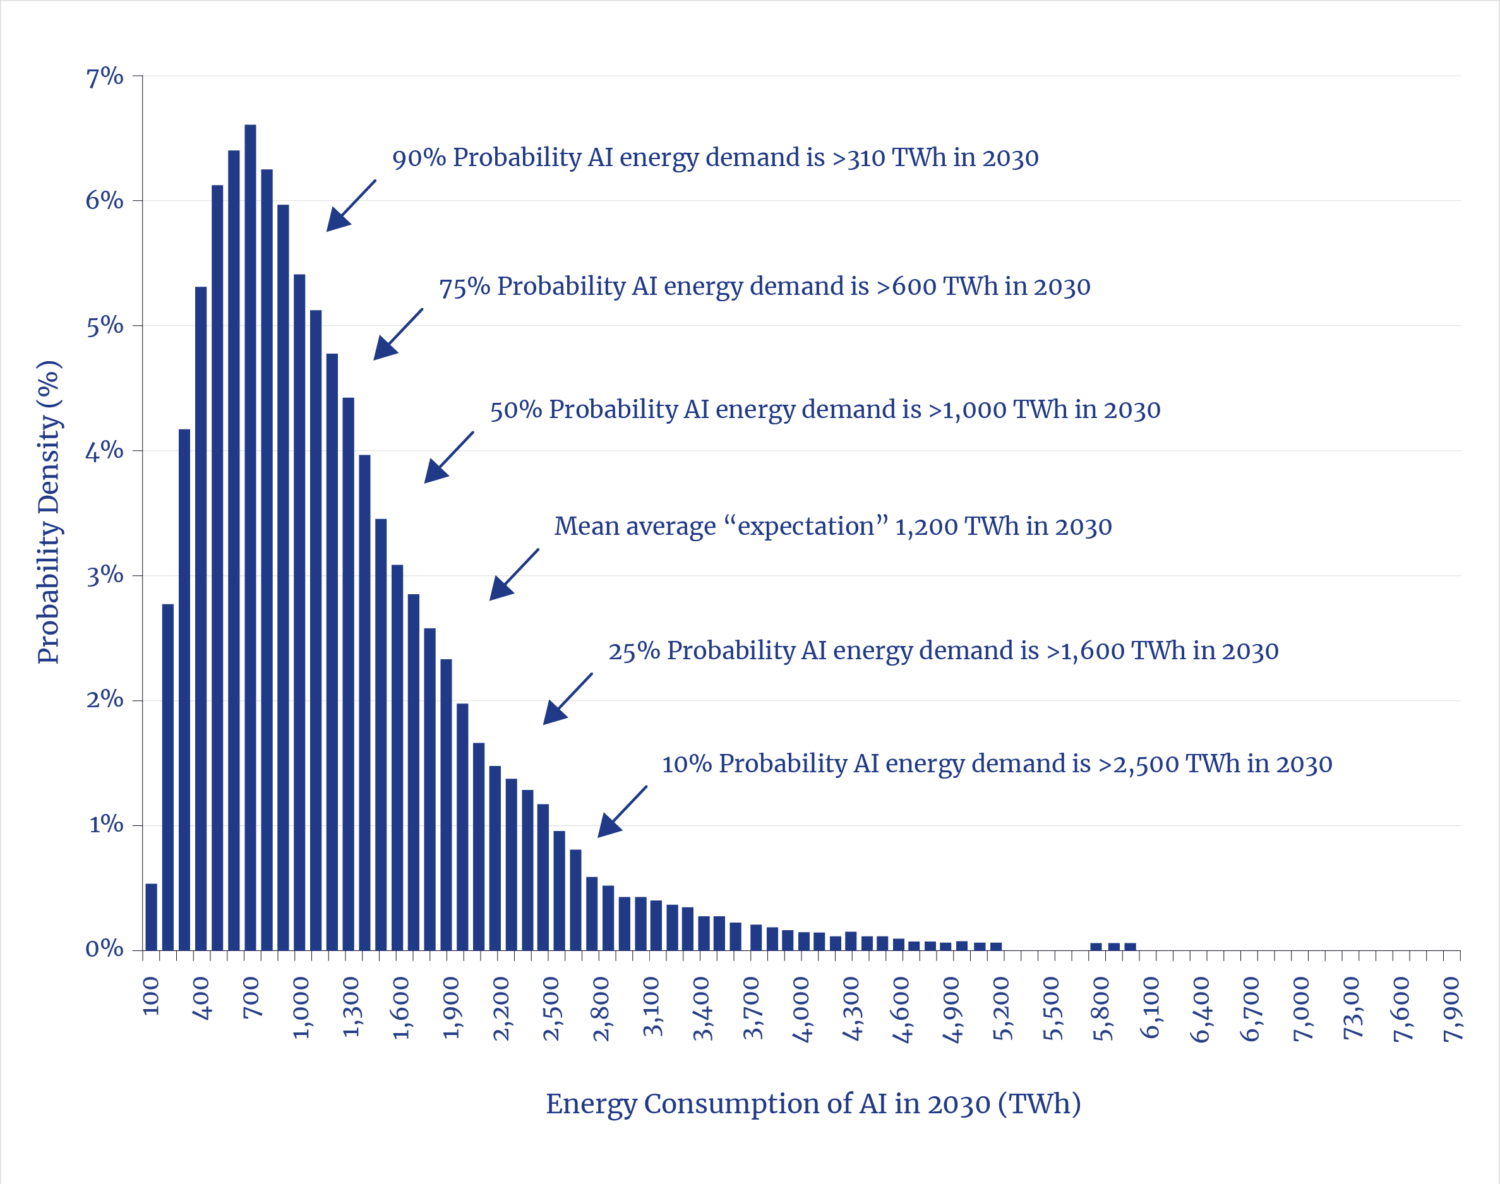
As more AI tools are created, the epicenter for electricity demand growth shifts to inference, both of which are far more energy-intensive than conventional compute. Both domains require guessing how many tools will be needed and how widely and often they will be used once created. Brookfield’s analysis, for example, sees 75% of AI demand in 2030 coming from inference.53
The approach taken by Thunder Said Energy analysts is useful in illuminating outcomes based on a confidence or the probabilities regarding likely future scenarios focused on the core AI demands. In that approach, we see that the 50% to 90% confidence range yields future global AI demand varying over threefold.54
2.4 U.S. AI Digital Power Demand: Best Guess
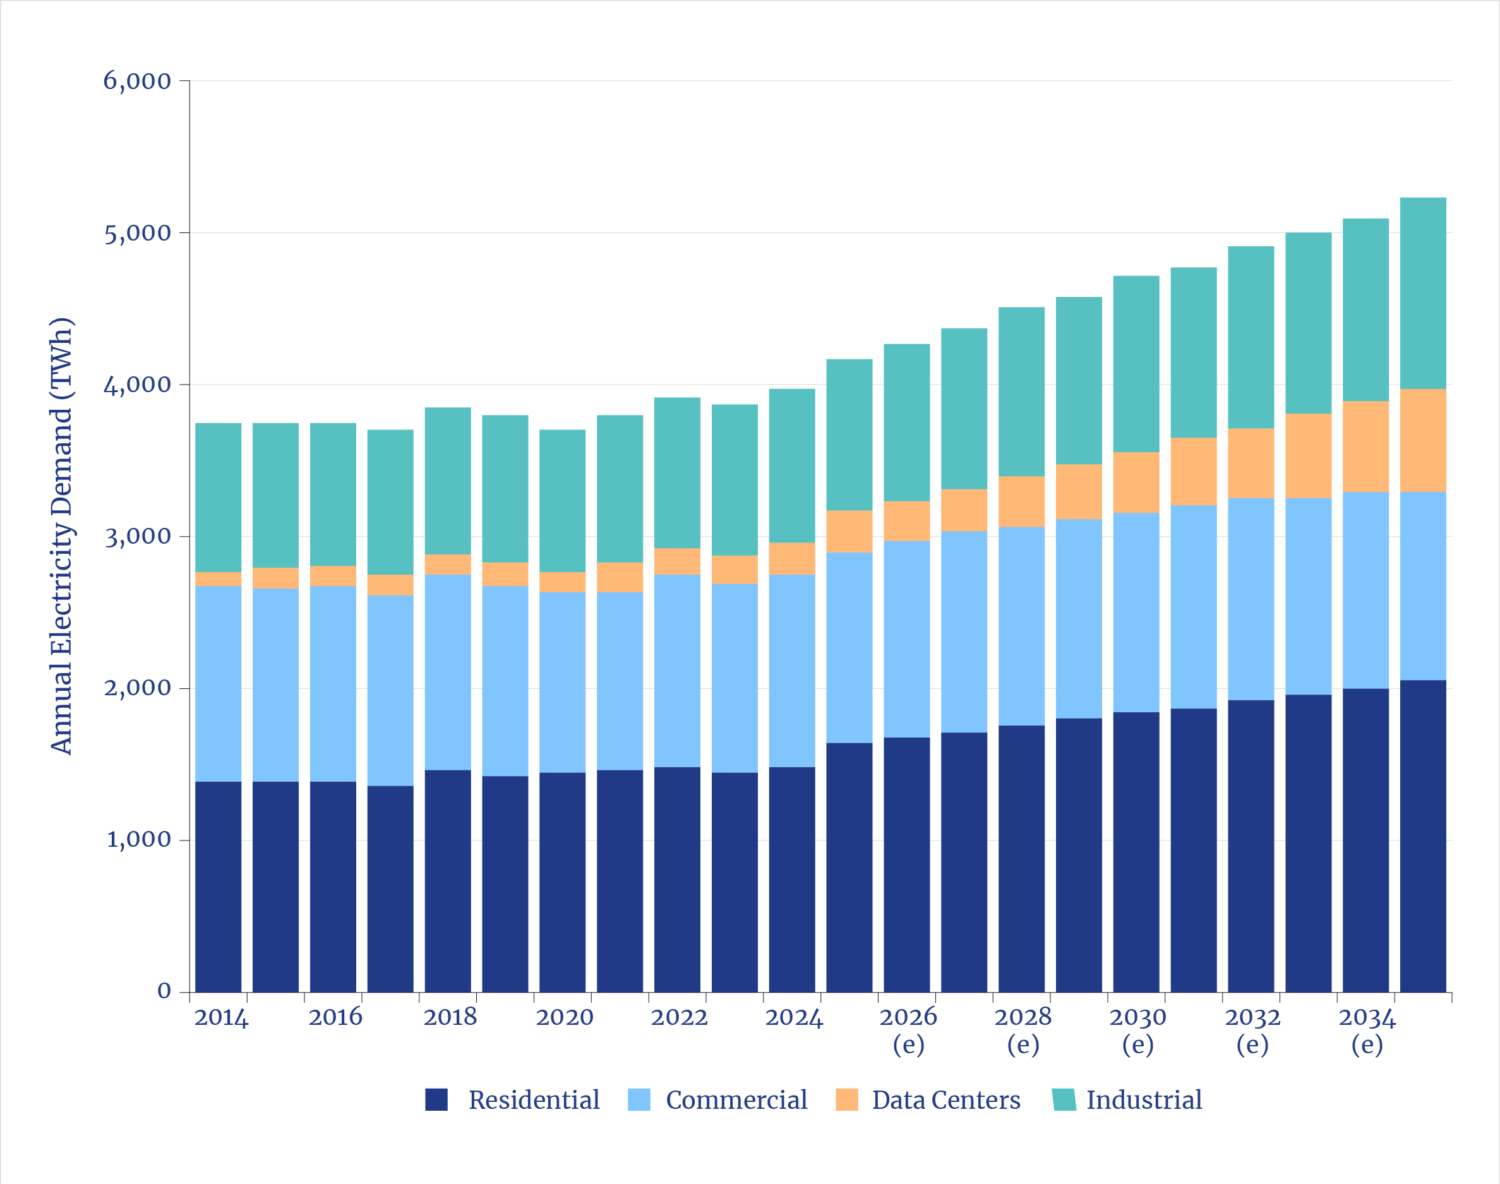
The context for estimating the adequacy of future electricity supply includes the reality that utilities face other new demands, each with uncertainties, from reshoring manufacturing to state policies to electrify building heating, and ongoing EV expansion (even absent subsidies or mandates). Most analysts see the combined growth in industrial demand and EVs as roughly matching rise demand from data centers. The latter, however, involves uniquely fast and large localized new loads, which present specific challenges for electric supply and grid stability.
U.S. Electricity Demand
The commercial real estate firm CBRE reports: “Power availability and infrastructure delivery timelines remained the most decisive factors shaping site selection . . . . Utilities are increasingly seeking contributions from developers and occupiers toward capital expenditures (CAPEX) for power generation and transmission infrastructure . . . . Data center development is shifting to new markets with faster power access . . .”55
One way to establish a minimum likely future U.S. data center electric demand would be to count only those under construction or with construction permits. Such a list, through mid-year 2025, finds over 75 GW of new capacity (over 1,000 preoperational facilities) expected to come online in the next five years.56 At expected utilization levels, 75 GW is about 550 TWh of new demand. (Note: Only ~50 TWh of additional demand would come from bitcoin mining.57)
Projected U.S. Data Center Electricity Demand for Projects with Permits
Some of the currently permitted projects will see delays, typically due to queues for accessing grid power. Some may be cancelled. Balancing that are the known unknowns regarding announced plans not yet permitted. One could reasonably assume, at a minimum that the two factors roughly balance, implying no less than about 75 GW of U.S. data center capacity added by 2030. Note that S&P’s forecast, for example, which includes announced plans awaiting implementation, projects about 80 GW.58
For context, the SemiAnalysis base case, anchored in a bottom-up, engineering model, sees global AI growth reaching 800 TWh by 2030. Since the U.S. has about half of current and likely future global data center capacity59, this implies ~400 TWh for the U.S.60 (The IEA offers a forecast of global growth of only about 500 TWh, implying ~250 TWh growth in the US.61)
A low-end assumption of about 550 GWh for data centers alone, combined with increased electricity needed for the telecom networks and for the fabs to build the hardware, would bring net new U.S. demand growth to about 1,000 TWh/year in the early 2030s—or roughly 15% to 20% of overall U.S. electricity demand.
2.5 U.S. AI Digital Power Demand: Geography
Based on a survey of existing, permitted plans, over three-fourths of the expected 75 GW of new data center demand that has already been permitted is taking place in about a dozen states, though nearly all have some activity. The top six states, in order, are Virginia, Texas, Oregon, Arizona, Georgia, and Ohio. California is number seven—despite being home to the world’s first data center, built by Exodus Communications in Santa Clara in 1998.
Locations of Data Center with Permits
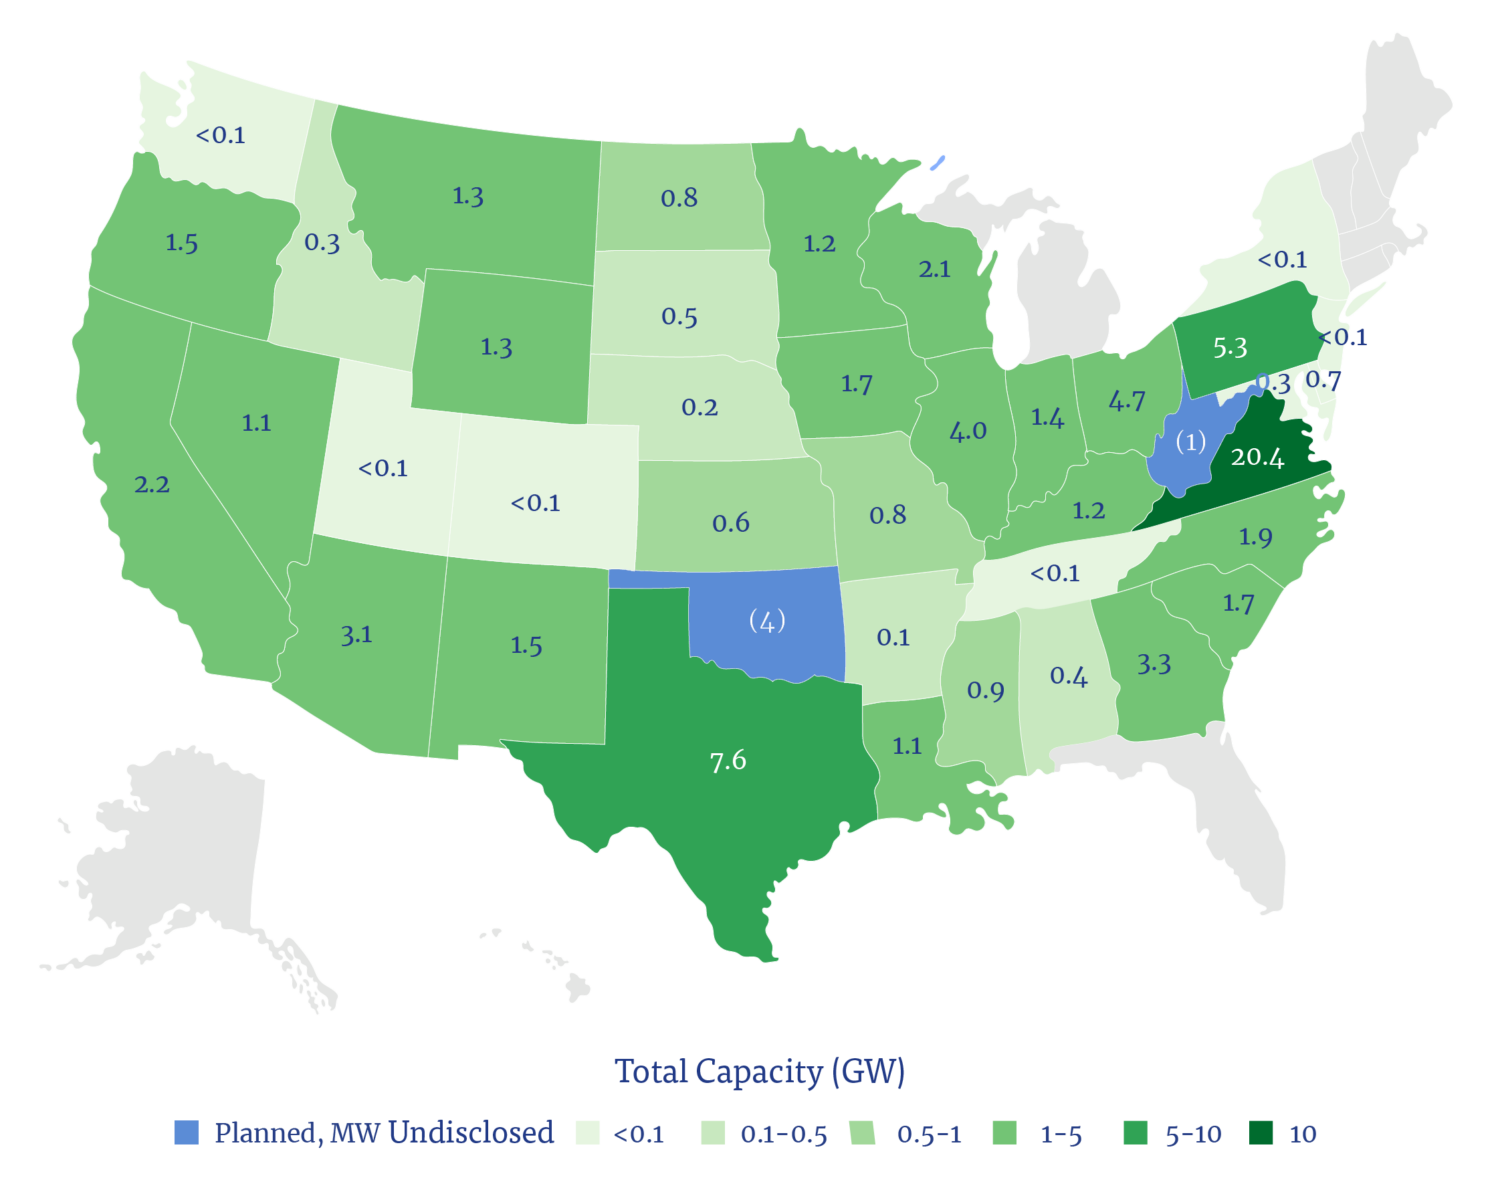
However, as the early players exhaust local grid capacities, the trends show new plans and applications increasingly chase regions with underlying energy resources that can accommodate the scale and velocity of demand. Thus, plans are increasingly found not only in Texas but also in other energy-rich states such as Louisiana, Oklahoma, Pennsylvania, and North Dakota. In addition, in those regions, many developers are increasingly turning to off-grid or private-grid power solutions.
Given the scale of demand expected, it is notable that most of the expected construction takes place in grid regions that the North American Electric Reliability Corporation (NERC) shows as being at “elevated risk” for foundational grid reliability. Numerous grid operators have already issued warnings about rapidly adding so much capacity to already strained grids.
Reliability Risk Areas & Location of Data Centers with Permits
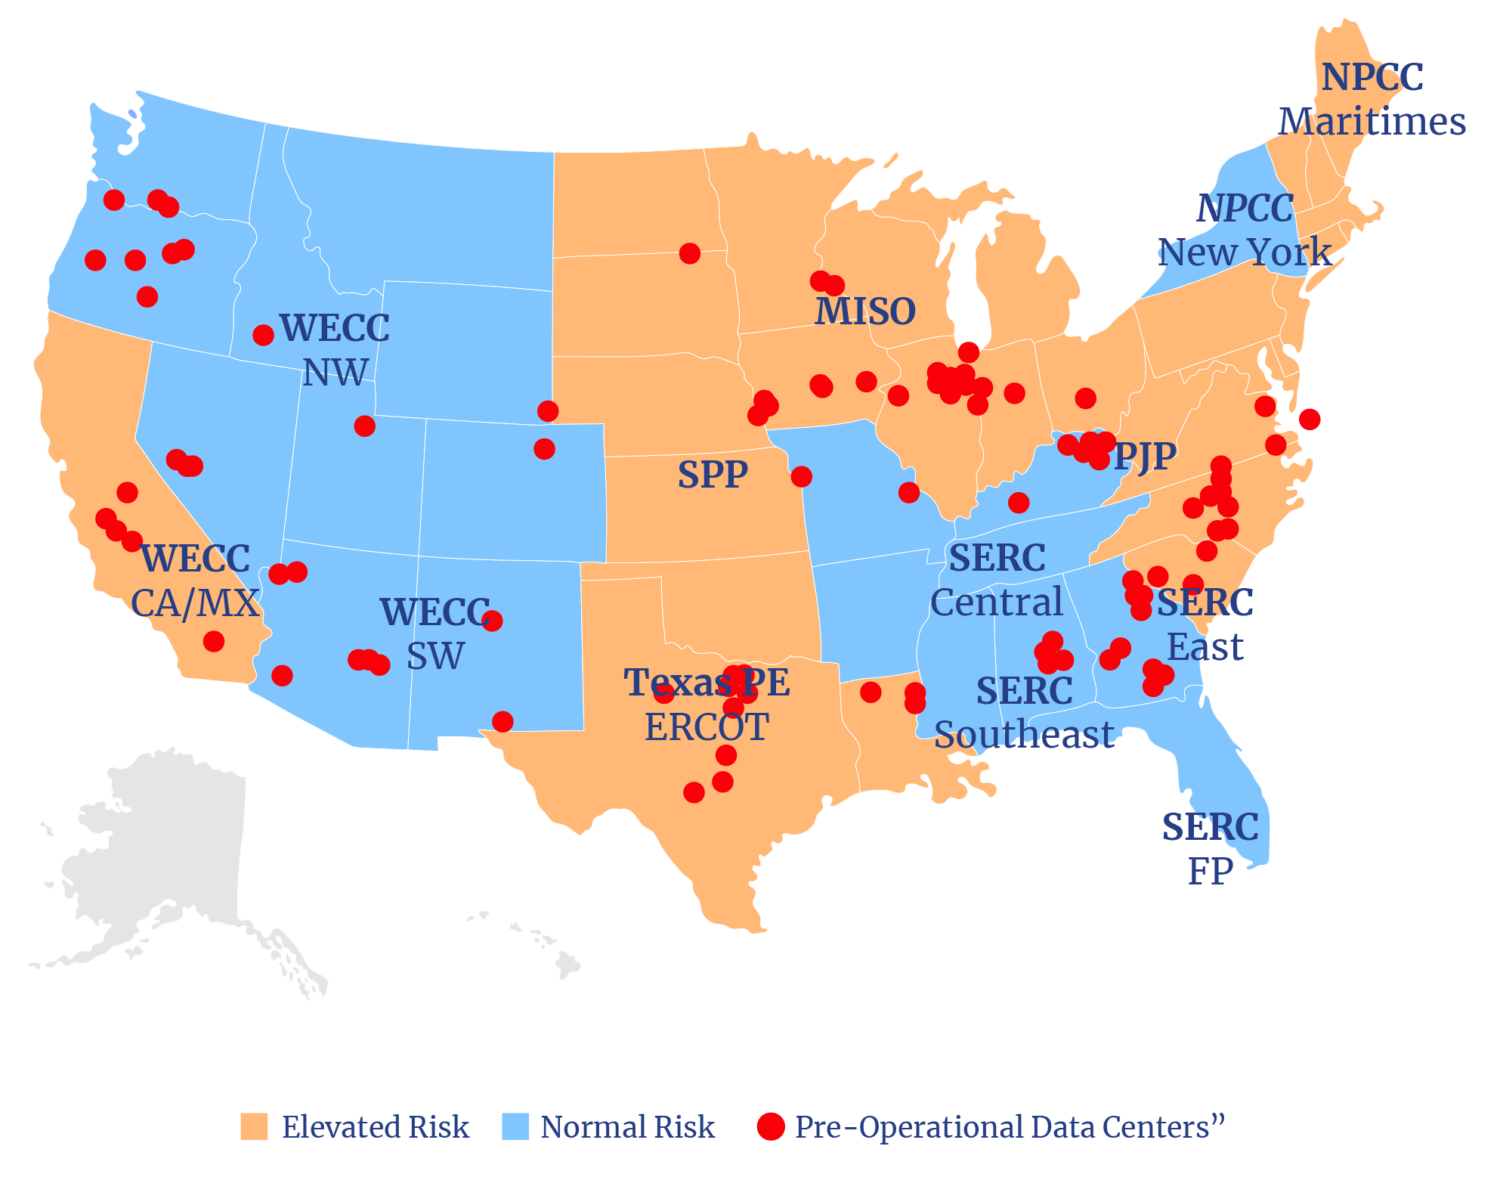
The U.S. has not experienced a widespread, non-weather-caused blackout since 2012, when 8 million lost power across the Northeast. Following the infamous 1965 Northeast blackout that put 30 million people in the dark, including all of New York City, there have been nine other major non–weather-related outages involving loss of power to 2 million or more people, with the most recent in 2011 in the Southwest.
Maintaining grid stability is a technically complex challenge involving an array of technologies and design features, including real-time monitoring and predictive analytics. (For that reason, the electric utility sector was one of the first industries to use computers at the dawn of the computer era 70 years ago.) The addition of just one gigawatt-scale data center—never mind dozens or hundreds of huge, isolated loads—introduces unique requirements for maintaining grid stability. The key issues in this regard are not whether such a solution is technically feasible but rather what needs to be done, how quickly the fixes can be implemented, and who will pay.
2.6 Efficiency, Digital Power Demands, and Jevons
The two biggest variables in forecasting future digital energy demands are guessing how many unanticipated new uses will emerge for AI tools and, on the other side of the equation, estimating how much more efficient the underlying AI hardware will become. There is no doubt that far greater efficiency gains are coming rapidly to all relevant compute technologies: GPUs, CPUs, memory chips, and information transport, as well as power management and cooling. But invoking efficiency as a reason to expect a moderation of overall AI energy use gets it backward.
Trend in Computer Chip Energy Efficiency

History shows that efficiency gains have led, overall, to increased—not decreased—energy use. Aircraft, for example, are three times more energy efficient than the first commercial passenger jets. That efficiency didn’t save fuel. Instead, it propelled a fourfold rise in overall aviation energy use since then.62
The underlying efficiency of each logic operation in silicon has improved by 100,000-fold over the past 20 years alone. And the engineering roadmap—not the forecast, but what engineers are planning to deploy—offers the same gain over the next 20 years.63
The radical improvement in energy efficiency of silicon logic is the core reason that computers have proliferated and that overall computer ecosystem energy demand has risen. Consider that a single data center today, if it operated at circa-1980 efficiency, would require as much power as the entire U.S. grid. But because of efficiency gains, thousands of data centers now collectively consume as much electricity as Japan.
Increasing Energy Efficiency Induces More Energy Demand
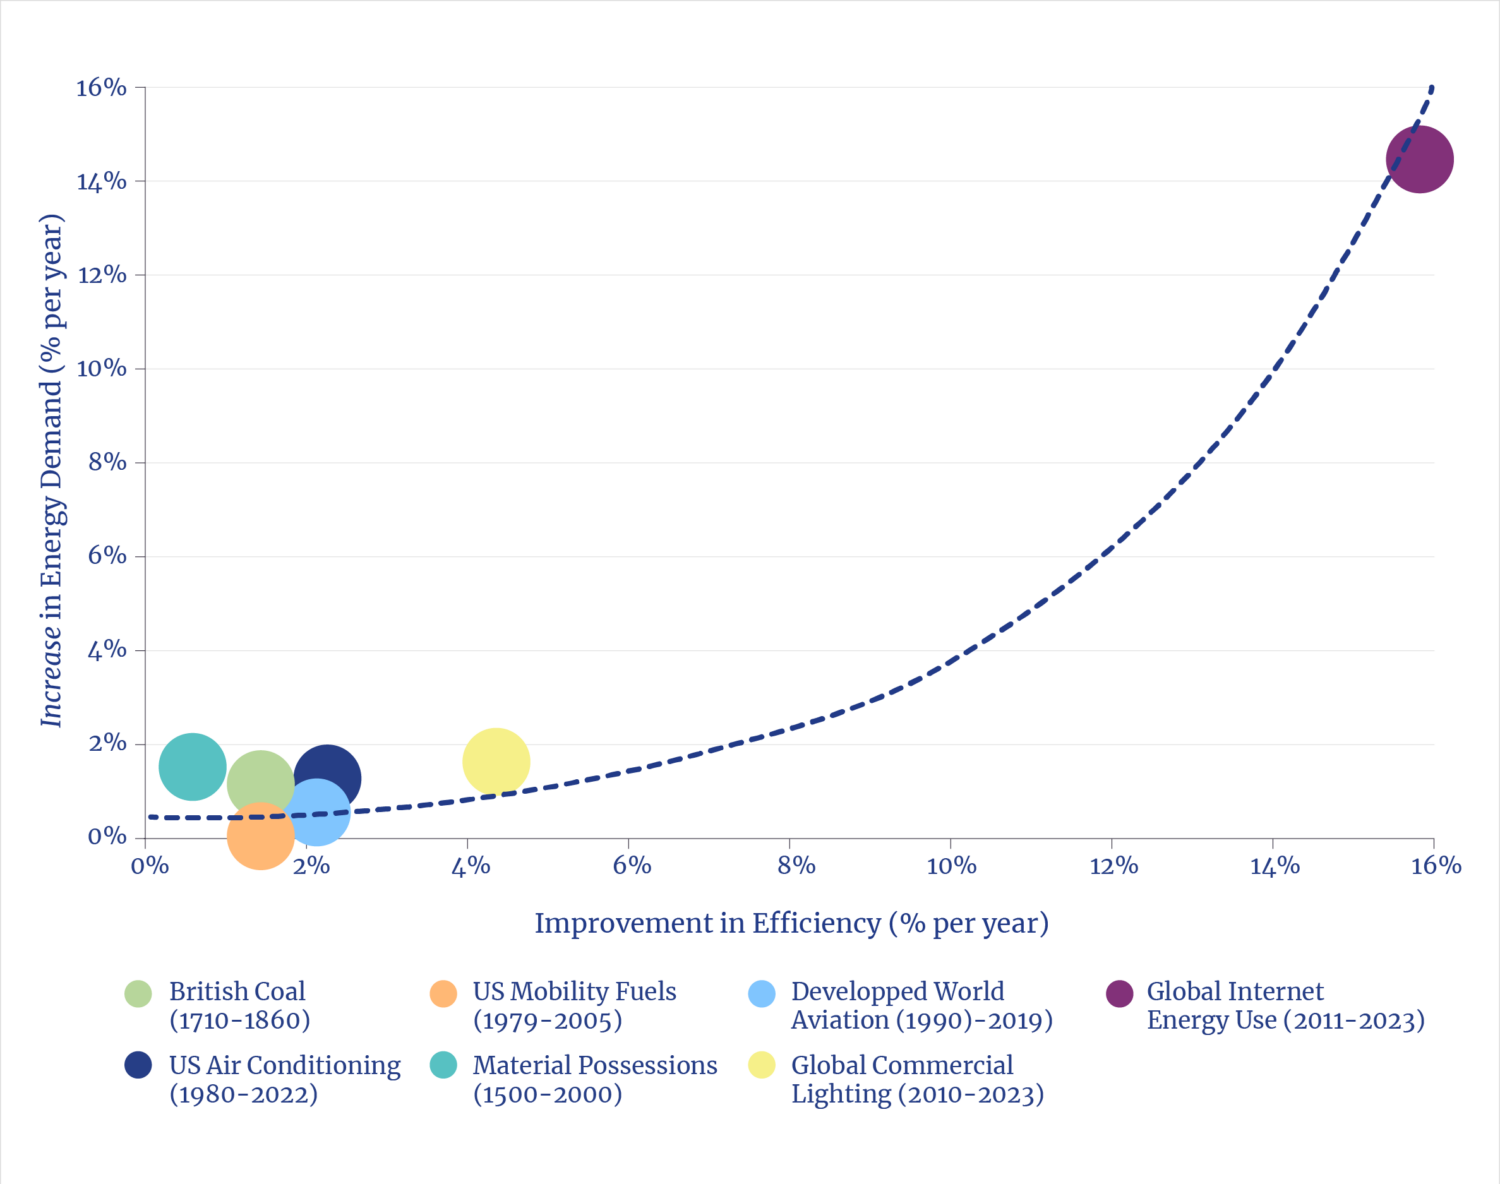
Most analysts recognize this phenomenon as the Jevons Paradox, named after British economist William Stanley Jevons. He codified the reality in a seminal paper in 1865. Jevons, however, knew it was not a paradox. He wrote: “It is wholly a confusion of ideas to suppose that the [efficient] use of fuel is equivalent to a diminished consumption . . . new modes of [efficiency] will lead to an increase of consumption.”64 Some modern economists call this a rebound effect, but that misses the point.65 The pursuit of efficiency is to increase demand.
Put differently, improved efficiency democratizes the benefits from a machine or a process. As long as people and businesses want more of the benefits offered, declining costs from efficiency stimulate demand. As the analysts at Thunder Said Energy have illustrated, the demand-inducing effect of more efficiency appears to be amplified in digital domains.66
2.7 AI Efficiency: Feeding the Beast
Over the past decade, engineers have delivered a roughly thousandfold gain in the energy efficiency of AI hardware, the various GPU chips, and similar types of silicon (e.g., Google’s Tensor Processing Unit). This efficiency is what has enabled an inflection in the exponential curve of computer power available for machine learning for AI training.
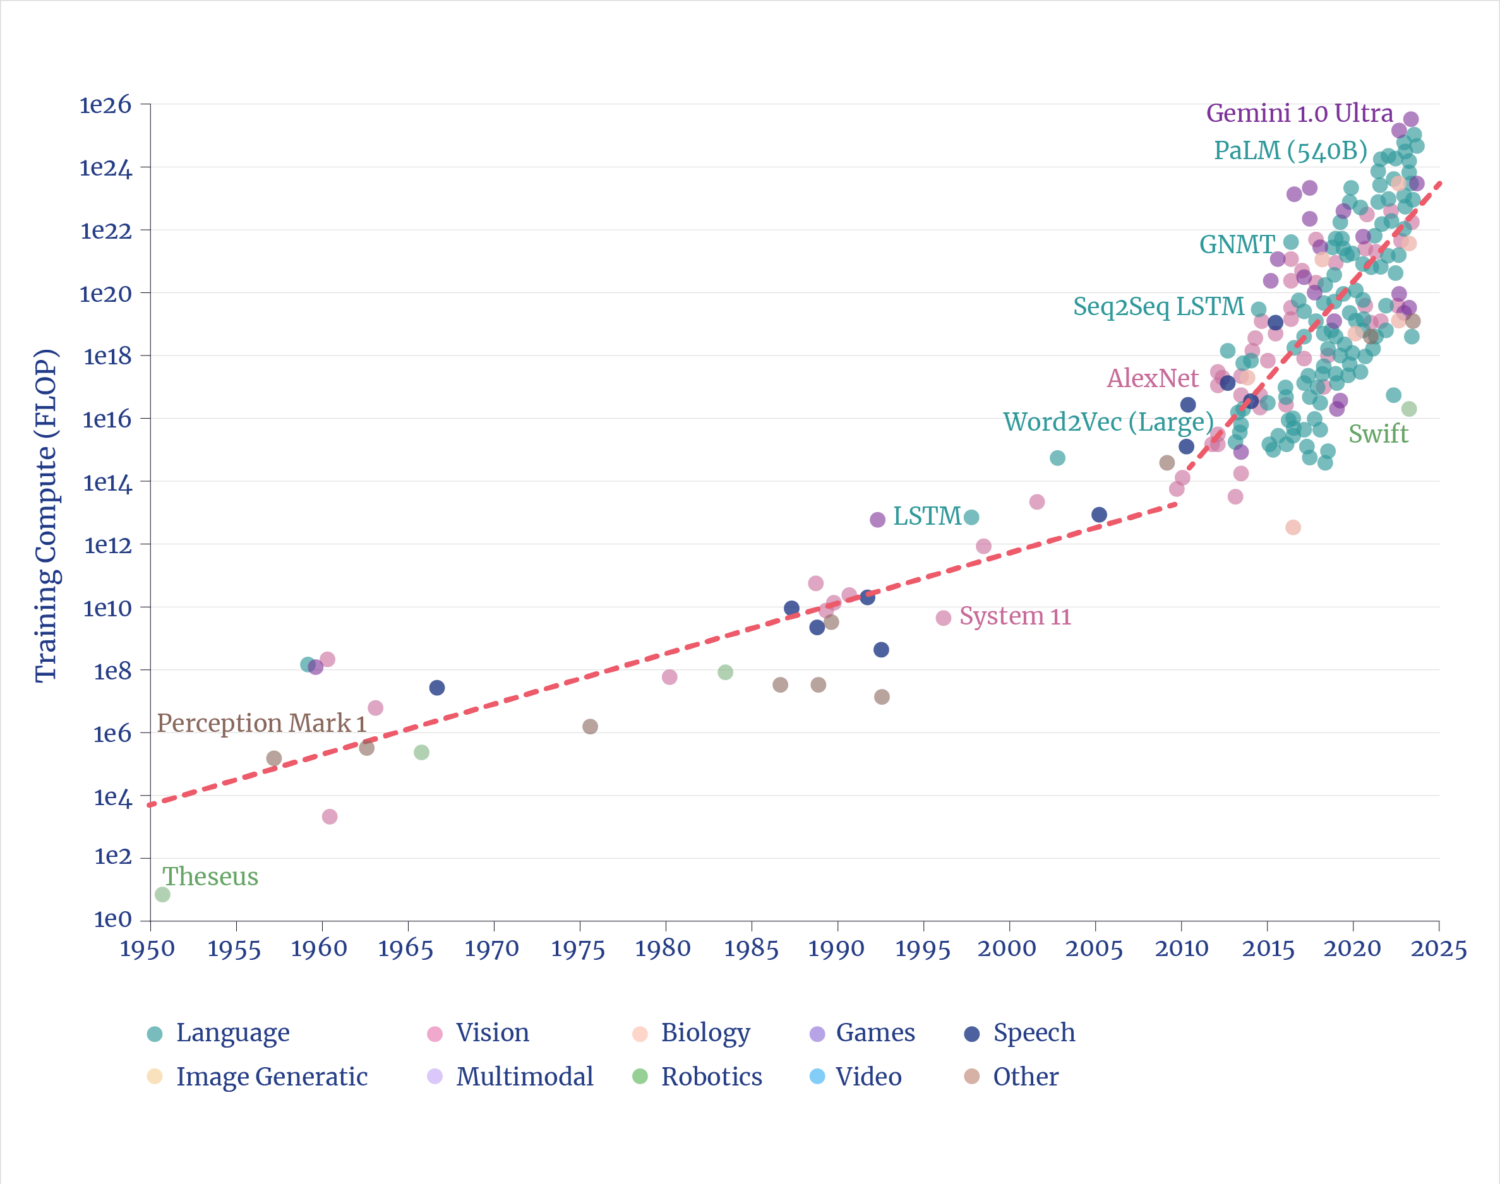
The ever-more powerful, more efficient, and less expensive AI (compute power available per dollar is doubling every three years67) has driven an astronomical increase in the scale of computer power available for machine learning. Training compute power increased a millionfold over the 50 years from 1960 to 2010.
Over the 15 years since 2010, training compute power available has increased roughly one trillionfold.
The arithmetical intersection of those two trends—huge gains in energy efficiency but an astronomical rise in computer chips used—yields an unsurprising outcome. The energy needed to train AI models has grown one thousandfold over the past half-dozen years.68
What’s next? More efficiency. Computer history shows that as engineers harvest efficiency gains and push limits, new means for efficiency are found. Innovators have already deployed better techniques for learning (different logic, new math) and means for curating data to avoid brute-force data crunching. Since the primary fuel for AI software is a massive quantity of data, techniques to select, pre-qualify, meter-as-needed, and move data save enormous amounts of energy. Samsung researchers, for example, recently published a new technique to run a large language model (LLM) that increases learning speed twelvefold and cuts energy use.69
Energy Efficiency of AI Hardware
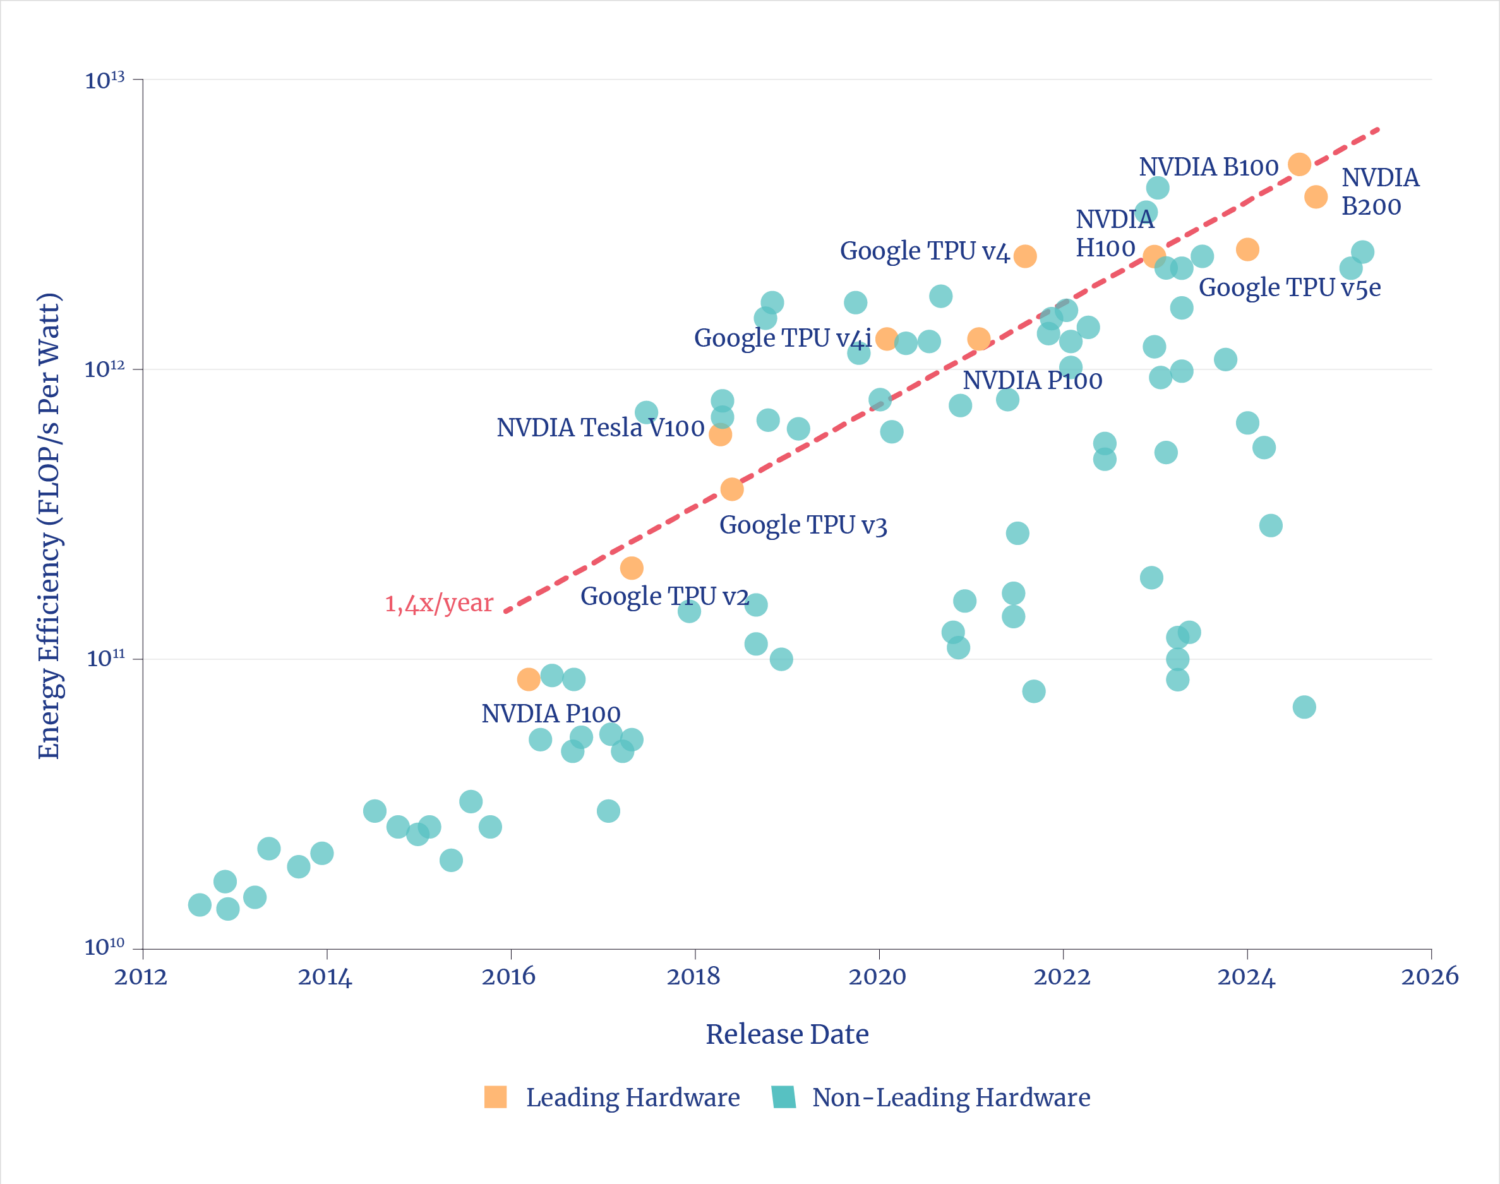
Reports are that the latest GPT-5 LLM model uses less compute power than the early GPT-4.5.70 If so, it is a very good sign for the accelerating democratization of AI. One should expect the proliferation of ever-more efficient, cheaper, MW-class LLMs that are today’s state of the art, while the handful of frontier models will continue at the leading edge at GW scale. The history of compute won’t just rhyme—it will repeat.
Compute Power of AI Systems
The other domain of efficiency gain is upstream in the grids that fuel data centers. Recent analyses propose that AI-driven analytics (a kind of virtuous circle) can harvest efficiencies by flexibly adjusting the power-consuming tasks inside the data center itself to minimize the need for new power plants to meet peak loads.71 However, the theoretical models for such techniques are based on the assumption of, at most, reducing gross demand by only 20%, i.e., meaningful but not consequential.
3. FUELING AI
3.1 Dealing with Realities
AI is not the biggest contributor to rising global electricity needs, as the IEA’s Energy and AI report correctly pointed out.72 However, AI creates a new class of demand forecasters had ignored—one that is unique in terms of quantity and velocity. Individual facilities each have city-scale power demands and are being brought online in only two or three years. For the United States, AI is one of the biggest (and in context of the entire digital ecosystem, potentially the biggest) new source of power demand.
It is not clear, nor is it possible to know, whether the U.S. will need as little as 100 GW or more than 200 GW of additional electric power capacity by 2030, with about half that for digital ecosystems. However, as recently as a few years ago, such demands were clearly not anticipated—nor can they be accommodated—by a business-as-usual approach that evolved during the flat-growth, two-decade interregnum.
U.S. Electric Utility Capacity Additions
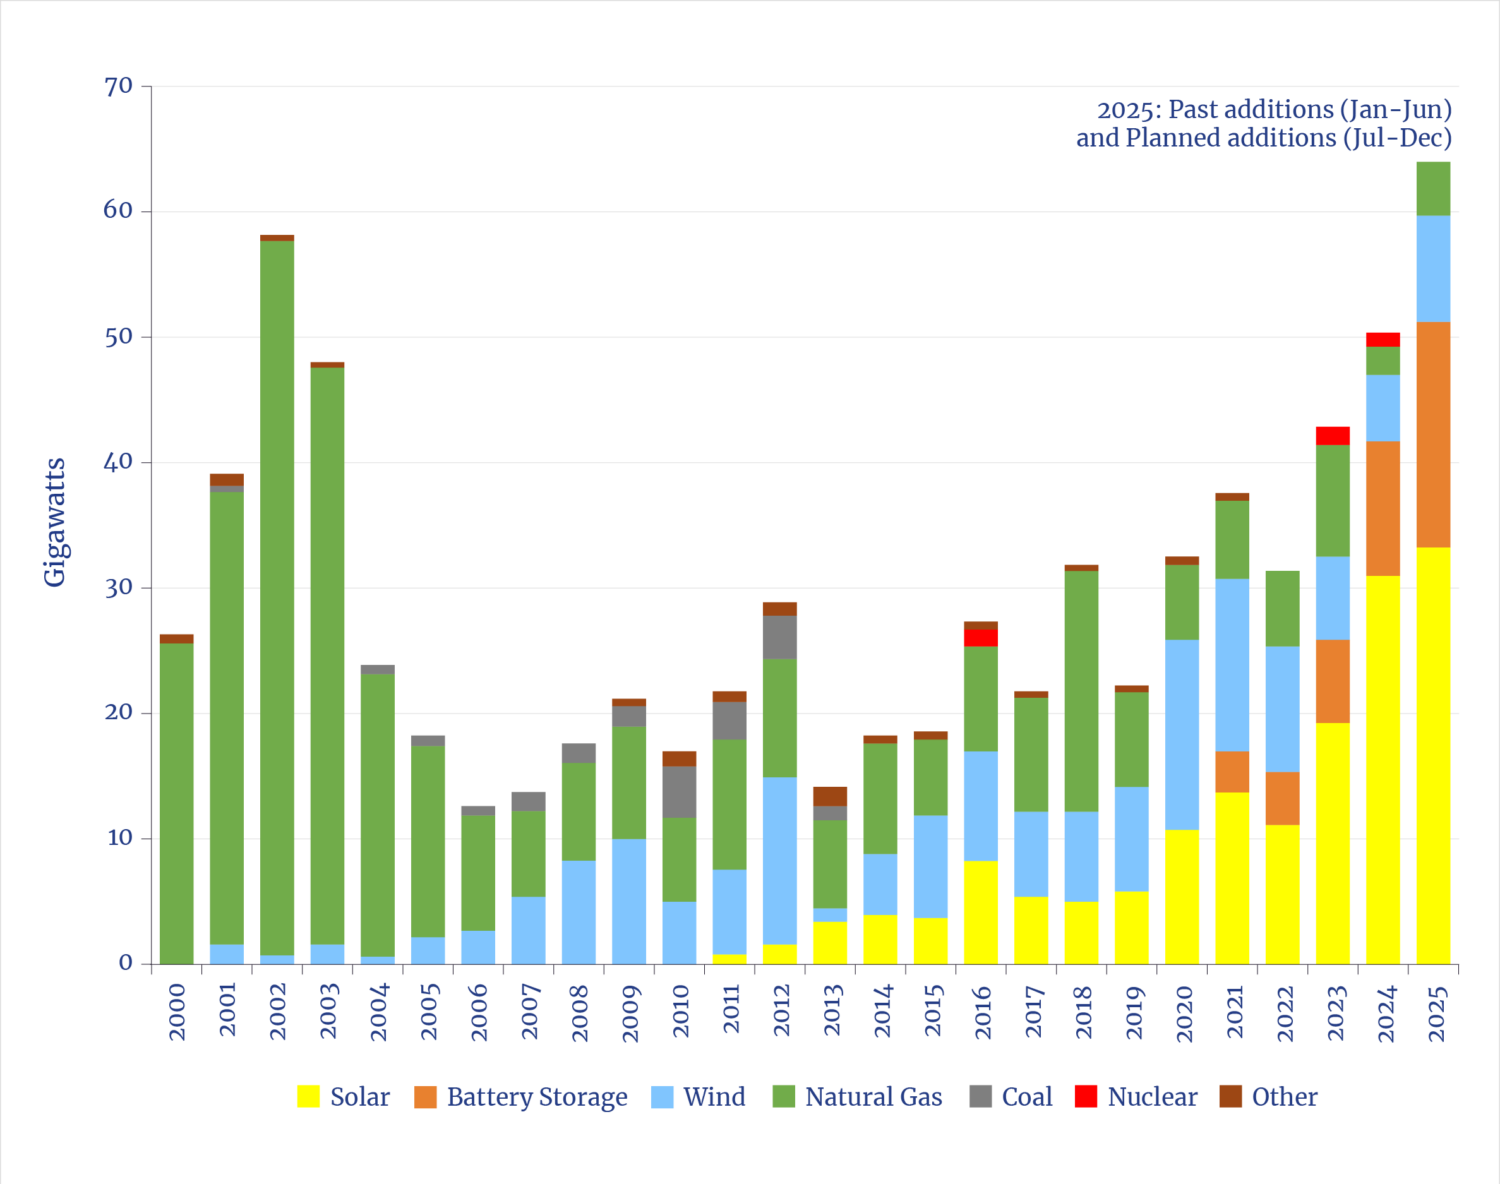
History shows that the U.S. electricity system added capacity at a rate of 30 GW to 50 GW per year two decades ago. While it may appear from EIA data, and media accounts, that the nation is well positioned for new demands because of a roughly equivalent additions to grids now coming from solar and wind capacity.73 However, as is now widely recognized, ~35 GW of solar capacity (the amount to be added in 2025) has an electricity-producing capability equal to less than 10 GW of conventional power.74 Regardless of how much additional solar capacity is yet added (another ~40 GW of solar is under construction75), planners should keep in mind that the electricity value of the capacity should be derated by 75% because that’s the amount of time such assets produce nothing over the course of a year.
Even adding new wind capacity to solar, total annual grid additions in 2025 for electricity production will be below the lowest level of the past two decades. Grid-scale batteries, also included in EIA reporting, are self-evidently not sources of energy—even if they are useful for time-shifting, stabilizing, and peak-shaving (all relevant, but again, not sources of energy).
Policymakers now face the need to consider how to ensure that the market demand for AI infrastructure can be met. Whether that happens will depend mainly on one factor, i.e., whether sufficient power is available, both where and when (soon) it’s needed.
Average Annual U.S. Electric Power Interruptions
Options for meeting the challenge come at a time of low political tolerance for solutions that increase consumer costs or decrease grid reliability. Meanwhile, trends show that there is a slowly rising rate and duration of power outages76, along with warnings from NERC that current utility plans will increase risks of outage across wide swaths of the nation.
3.2 Options Anchored in the Art of the Possible
Solutions and constraints for providing sufficient electricity for new data centers, each with city-scale loads, involve two distinct domains: what engineers can build and what policymakers will allow. In both cases, the options are different in the near term compared to the longer term.
While policies and regulations are consequential—and realities point to the need for policy changes—gauging what should be done starts with knowing what can be done. It is simplistic, but clarifying, to note that policymakers can add or remove inducements or impediments but cannot change the laws of physics or underlying engineering realities of what can be built in the usefully foreseeable future.
Constraints fall into two distinct, overlapping time periods: what can be done quickly at scale (i.e., in the next half-dozen years) and what needs to be done now to ensure growth can continue over the longer term within the planning horizons of businesses. We’re focused here on the near-term realities because of the importance of capturing the moment for a new fast-moving industrial ecosystem (Of course, policies and programs need to be put in place now for the longer term so that the possibility of continued growth does not catch policy-focused forecasters flat-footed again.)
Engineers and constructors have, over recent history, demonstrated the ability to rapidly build hundreds of TWh of electricity-generating capacity, when and where needed, while maintaining high reliability. Whether this can happen again depends on policymakers and politicians allowing the implementation of technical choices that can simultaneously meet new demands without compromising regional grid reliability.
One immediate option is to ensure that existing plans to retire some 100 GW of conventional generating capacity are either postponed or canceled. This would both take the pressure off the need for new capacity and help ensure grid reliability.78
U.S. Transmission Line Additions
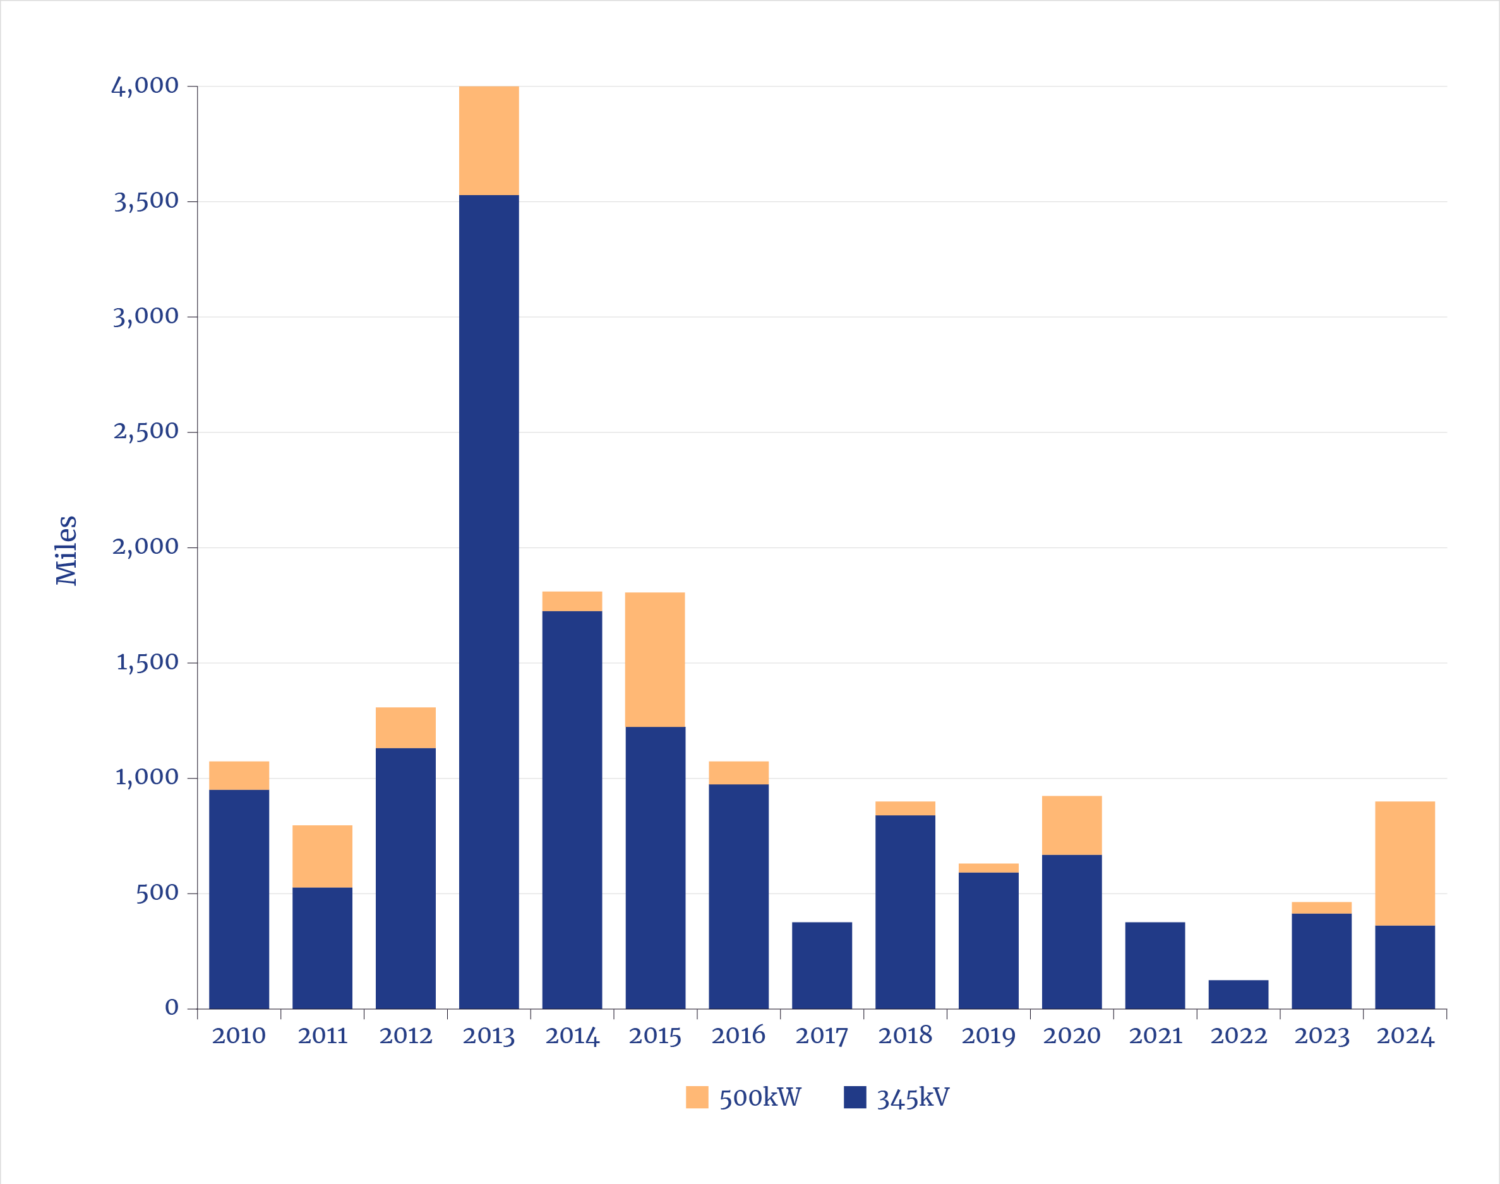
The other two near-term options are to build more transmission to connect remotely located solar facilities (along with more batteries to stabilize that power) and build more natural gas pipelines.
Relevant to these two options: the construction of electric transmission lines has been in decline for a decade79, while natural gas pipeline expansion has continued apace80. Ignoring permitting, the time to construct 500 miles of energy transport takes about two to four years for an electric transmission line81, but 12 to 18 months for a natural gas pipeline.82
U.S. Natural Gas Pipeline Additions
3.3 The Natural Gas (Turbine) Option
Near-term options don’t include nuclear energy, other than the refurbishment and return to service of a small number of retired plants. While the recent $80 billion agreement between Westinghouse and the U.S. Department of Commerce83 is a sign of revitalization, gigawatt-scales of nuclear capacity will not appear in the next half-dozen years, even if construction started tomorrow.84 Similarly, while many—likely dozens—of different first-of-a-kind next-generation small reactors will be built over that period, there will not be gigawatt-scale capabilities.85
Near-term options do include some greater use of coal, primarily in increasing utilization of underused plants, or delaying or canceling previously planned retirements.86 In the first half of 2025, U.S. coal-fired generation was 15% higher than in the same period of 2024.87 The odds are that coal generation will not shrink in the near term and may even continue to slightly expand, not just because of administration policies and executive orders but also due to frontline realities for utilities.
Orders for Utility-Scale Natural Gas Turbines
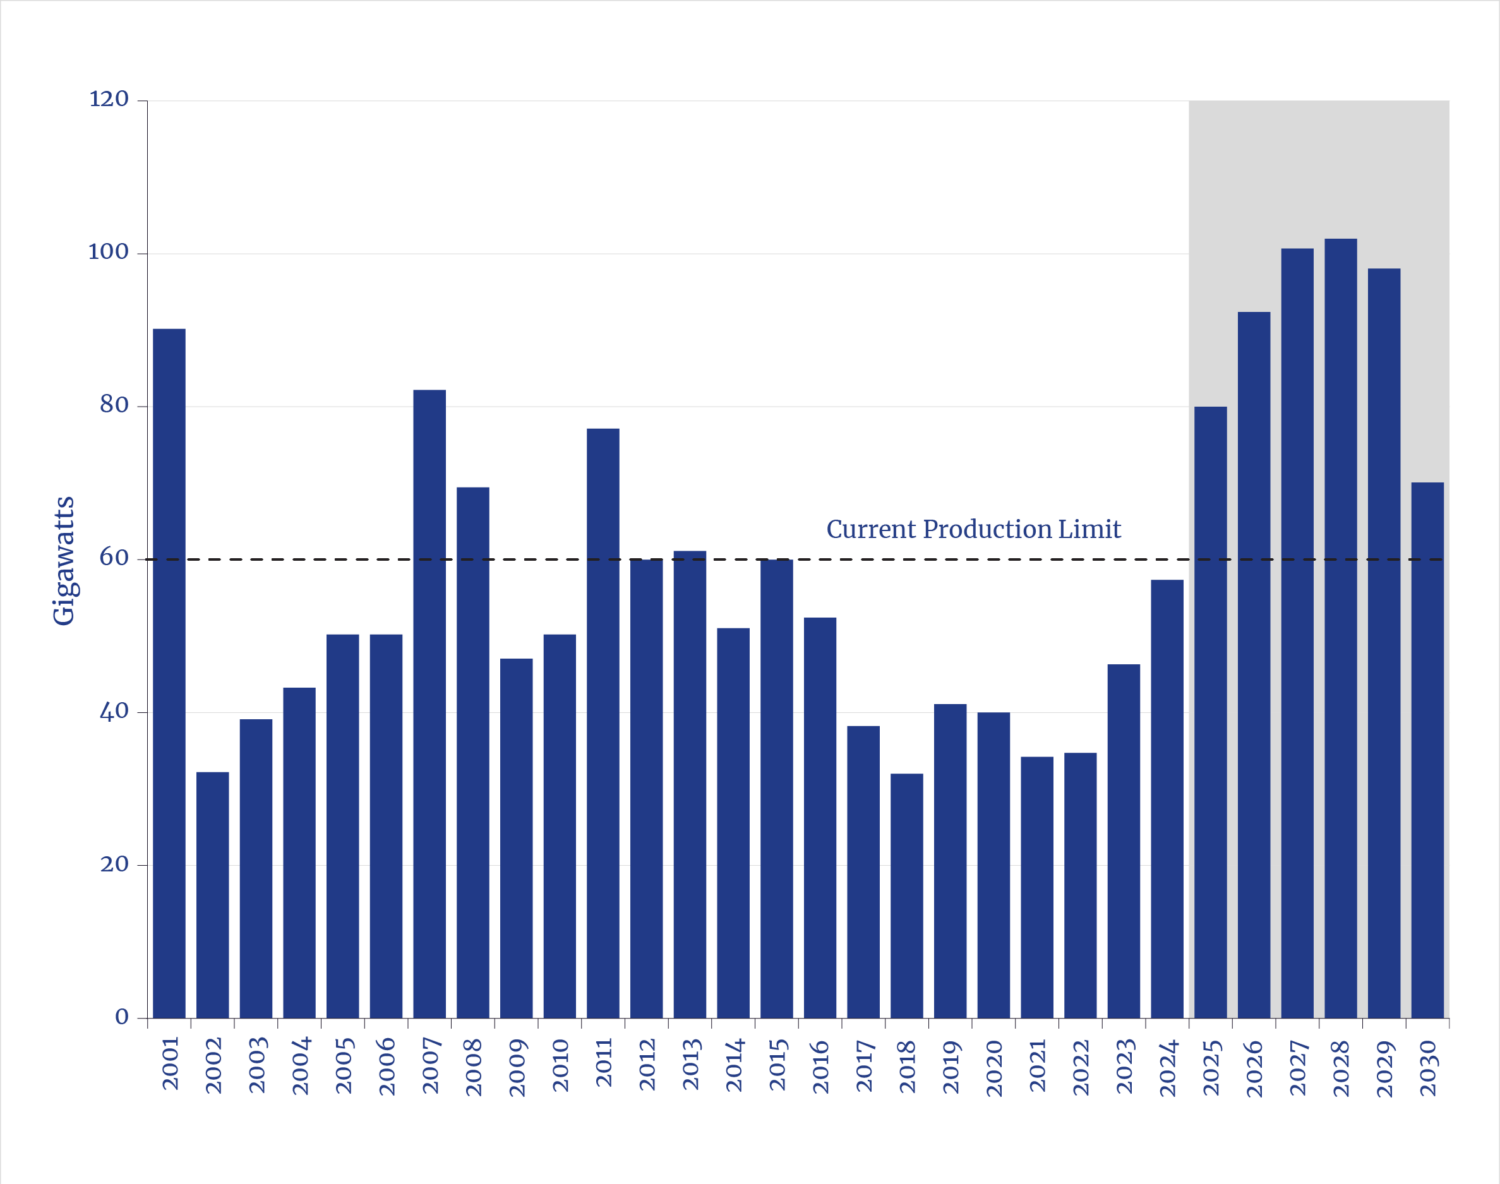
However, based on decisions visible thus far at dozens of projects under construction—e.g., Meta’s 1.5 GW project in Louisiana using natural gas turbines and Cat reciprocating engines88 —and visible in vendor order books, natural gas generation is the primary source of new electricity planned for near future data centers. Natural gas turbines orders now exceed the manufacturing capacity of the top gas turbine builders to 2031.89
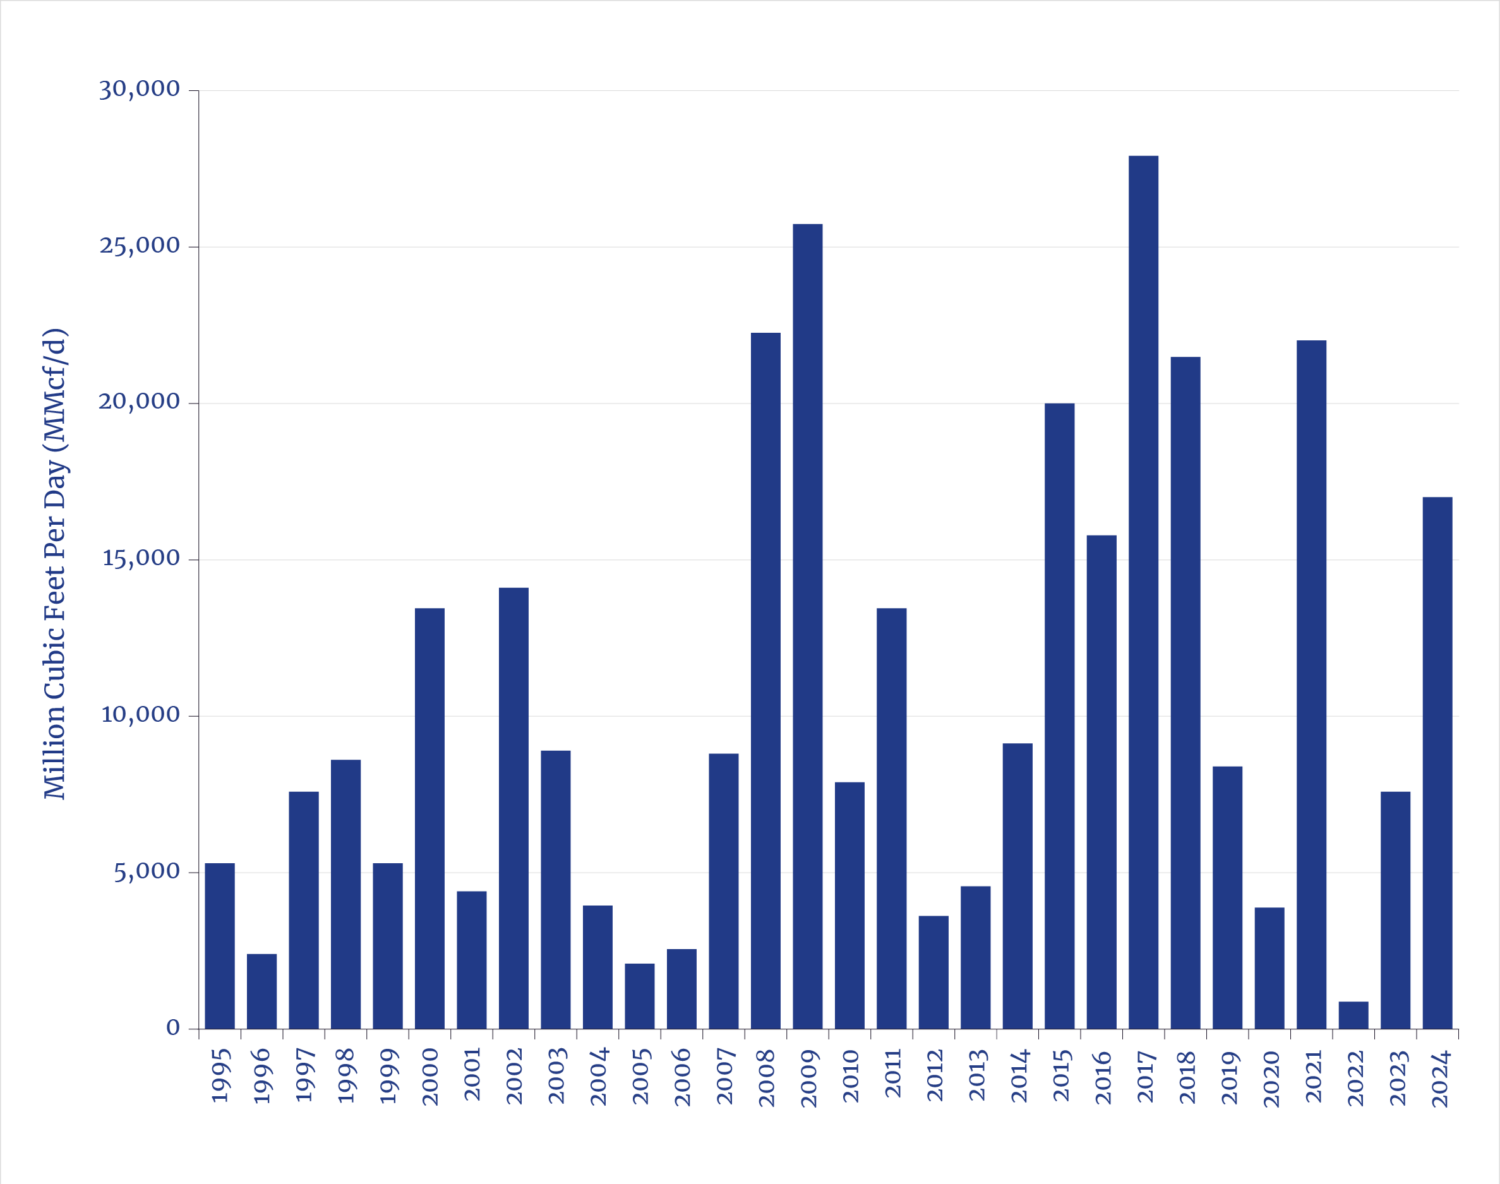
For illustration, assuming the low end of additional data center capacity at 55 GW and that it is entirely supplied with natural gas, roughly 10 billion cubic feet per day (bcf/d) of additional gas would be required by 2030. For context, the U.S. industry increased gas production and delivery by about 15 bcf/d since 2017 for LNG export.90
U.S. Natural Gas Production
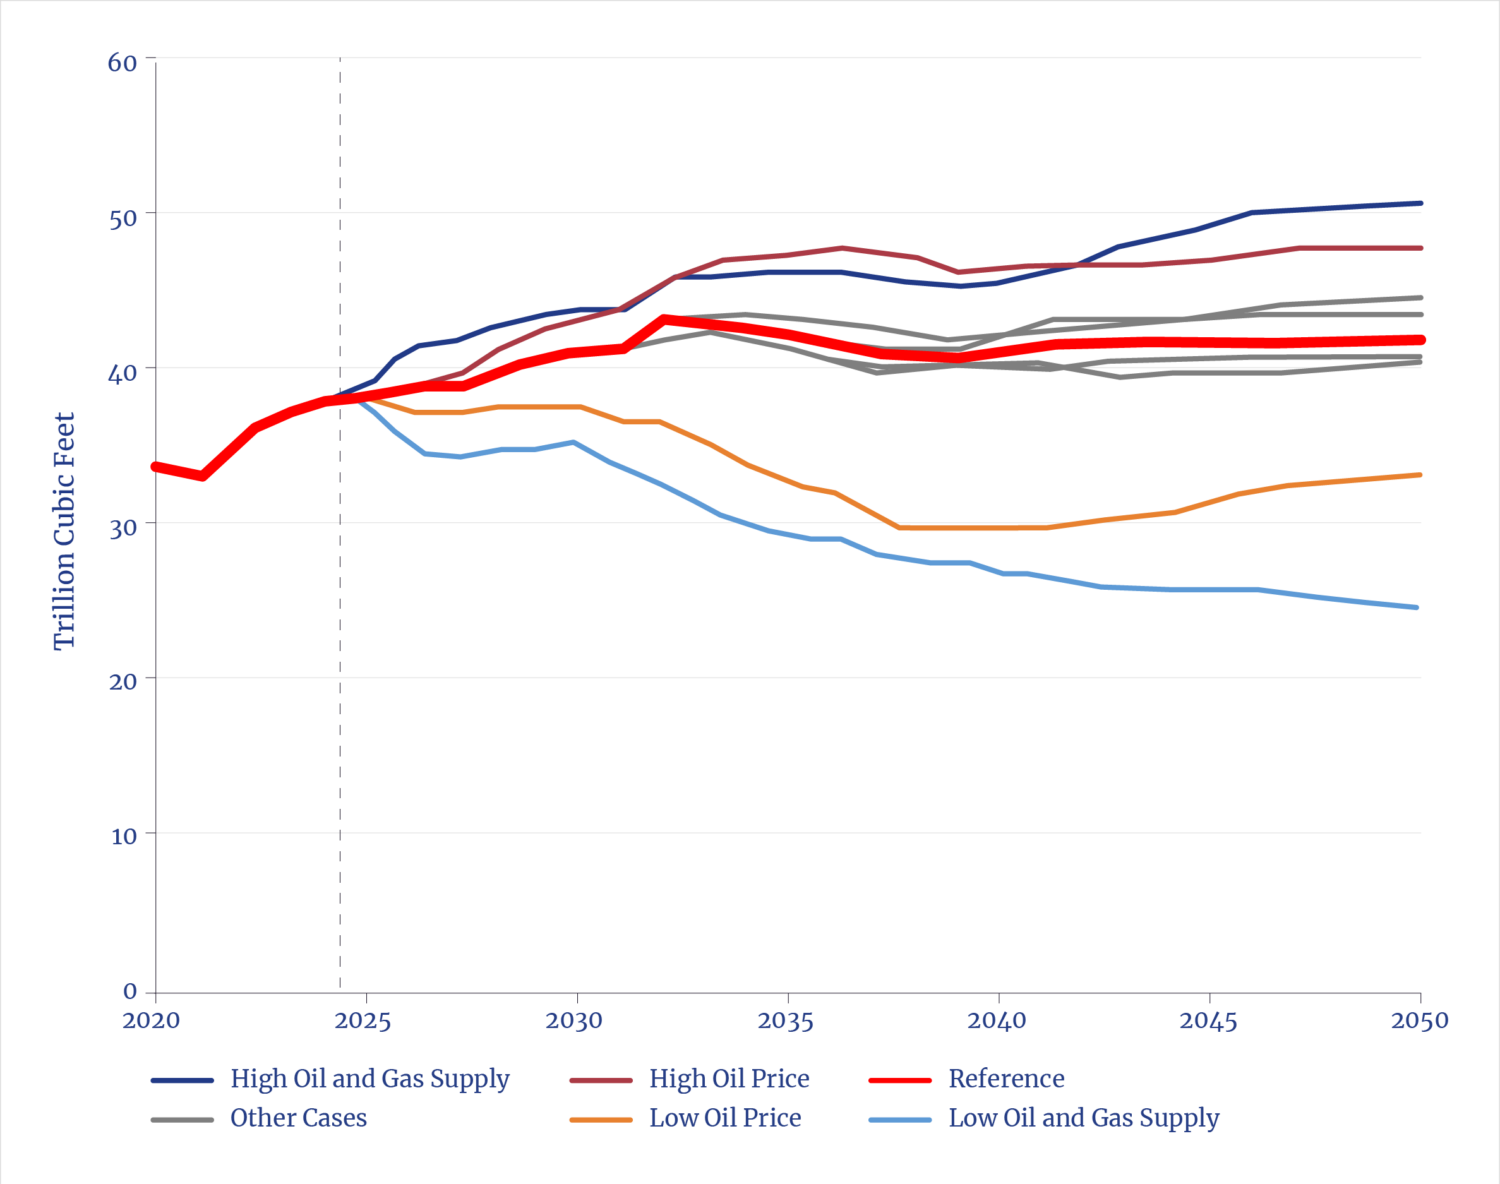
However, contemporaneous with data center expansion, another 15 bcf/d of natural gas will be needed to feed the export capacity for the new LNG terminals now under construction.91 That combination, along with expected new natural gas demands for reshored industries, implies a roughly 20% hike in overall demand for U.S. natural gas by 2030.
Recent history shows that pipeline capacity can be expanded at a rate comfortably within such ranges, assuming a reasonable permitting environment. While the production capabilities in the gas shale fields can meet such an increase in demand, it would likely occur only under the EIA high-price scenario. Meanwhile, the constraints on near-term availability of combined-cycle gas turbines do raise questions about whether other options will be needed and whether the implied demand for natural gas will in fact occur.
3.4 The Natural Gas (Engine) Option
While all the major combined-cycle turbine producers have announced plans to increase production capacity, it will take years to expand factories both abroad and in the U.S.; therefore, such plans do not significantly impact availabilities for near-term projects.92 In order to supply power in the next several years while awaiting bridging—the multiyear delivery time frames for combined cycle turbines—developers have already turned to greater use of simple cycle turbines and even big reciprocating engines (recips), which can also burn natural gas.
Both simple cycle turbines and recips can be fabricated quickly at scale. The world added roughly 500 GW of simple cycle turbines over the past decade.93 Similarly, global annual production of power-producing large reciprocating engines is about 100 GW/year, a class of generation commonly used in industries, especially remote off-grid locations, etc.94
Recips are increasingly showing up in project designs, for example at the 2-GW Meta project in Louisiana, and the new 2.3 GW-Oracle project in Texas.95 Typical of such designs, a group of 2-MW to 10-MW engine-generators is pooled to quickly produce hundreds of megawatts of capacity. This past summer, Caterpillar announced its participation in a 5-GW data center project in Utah that will use a fleet of its 2.7-MW class recips.96
Additions of U.S. Grid-Scale Reciprocating Engines
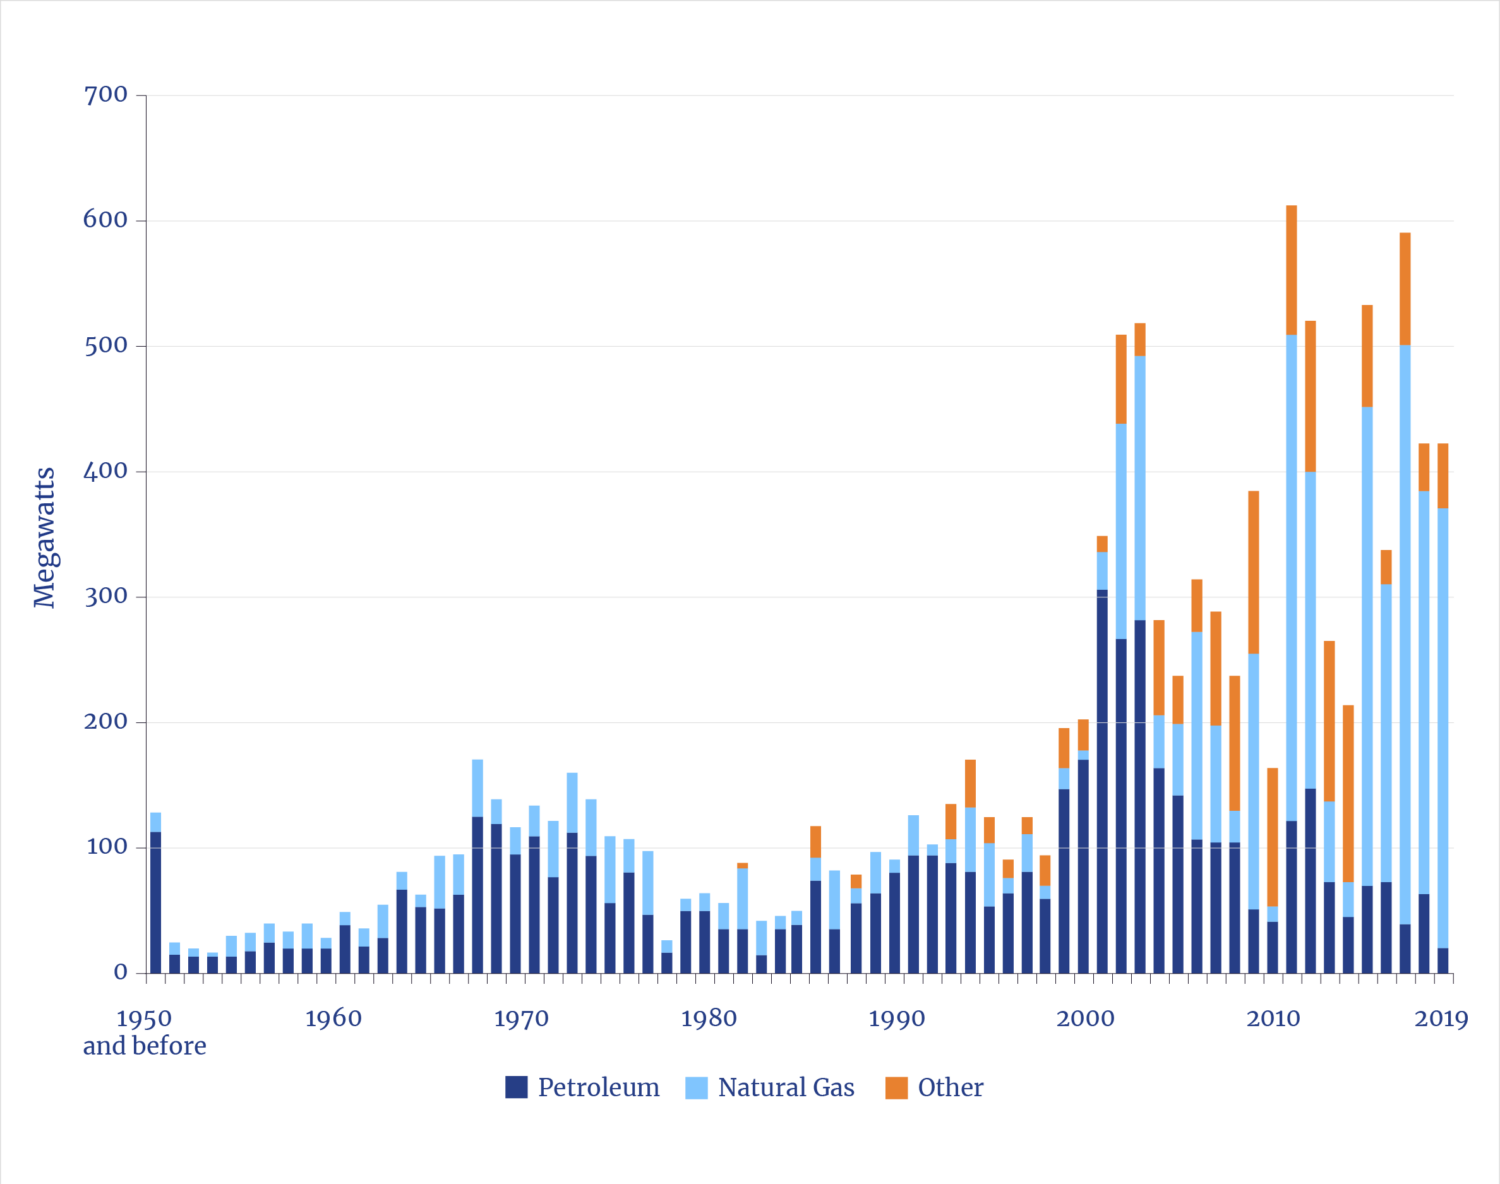
The use of grid-scale recips is not new. Contemporaneously with large additions of (episodic) wind generation starting around 2000, many utilities began to add recips to help manage power variability and fill gaps. Recips can be started extremely quickly to offset the unexpected, rapid loss of power from wind or solar generation. The average size of utility-class recip engines increased from a few MW to 10 MW, and the total capacity added through 2020 (the most recent data) totaled approximately 3 GW.97
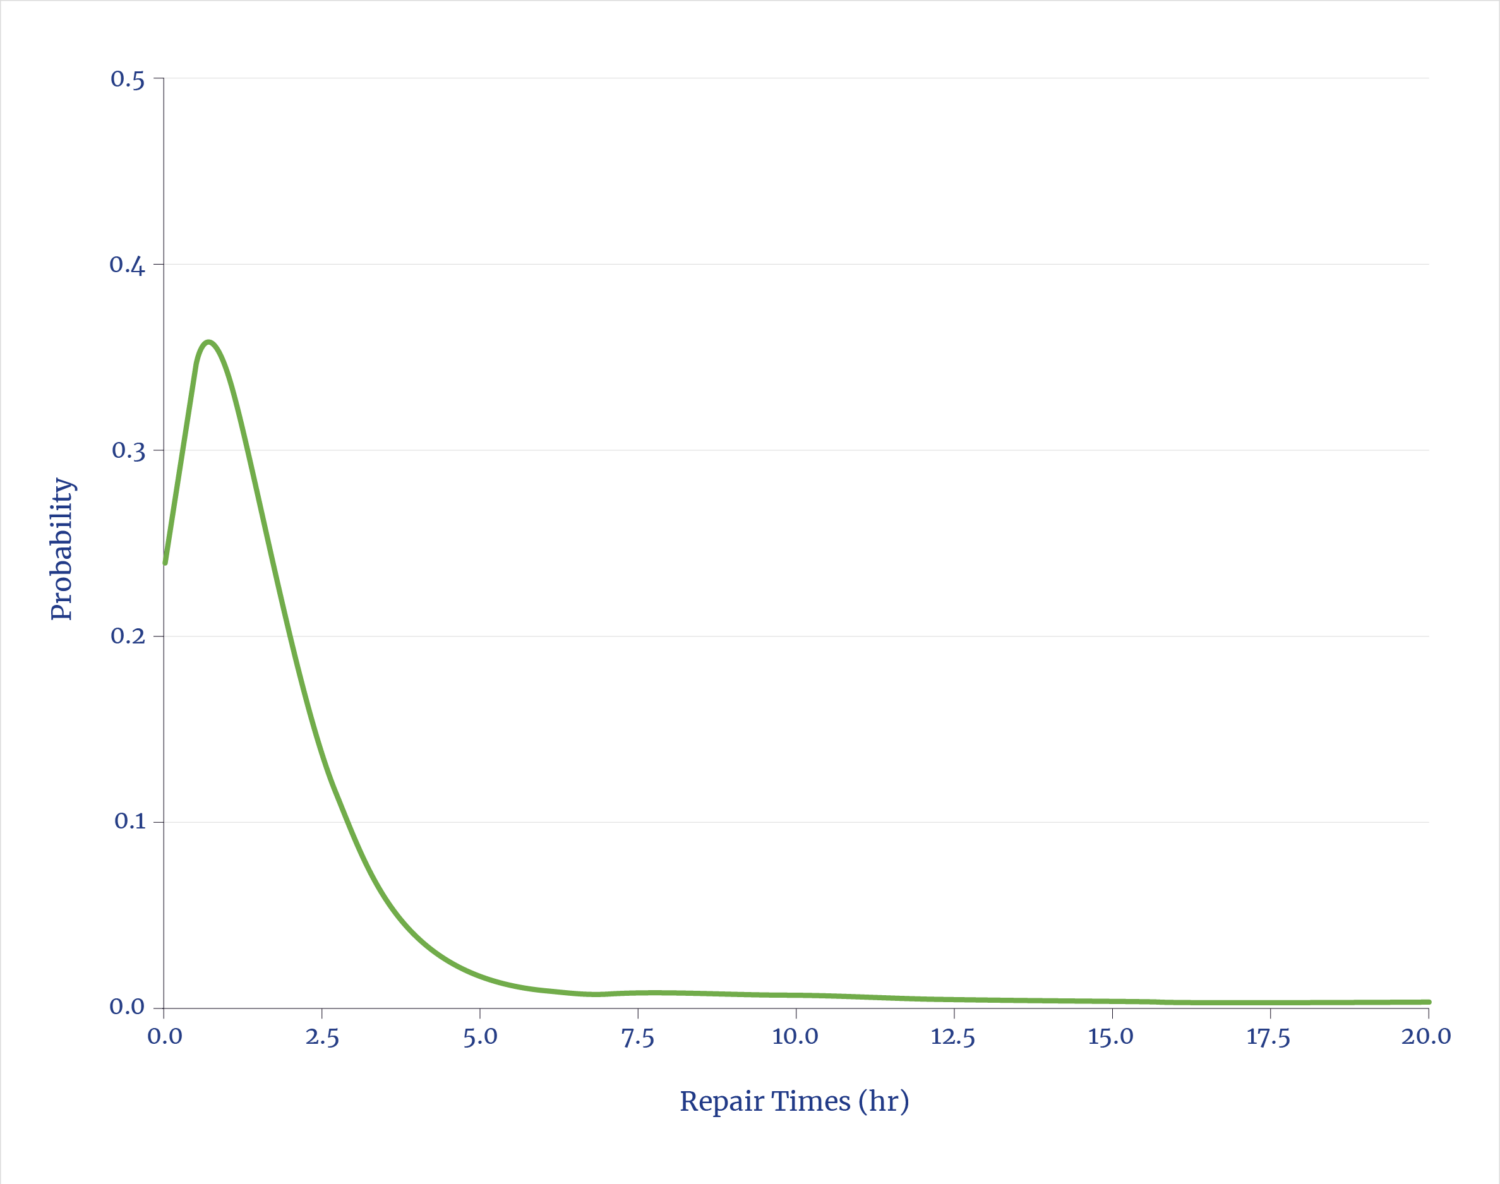
Simple cycle turbines and recips can have somewhat higher emissions, which can complicate permitting. They are also less thermally efficient, with implications for greater gas demand per MW, but the waste heat can be used for absorption cooling and thus reduce stress on local water supplies to cool data centers. Notably, the massive global use of large recips offers substantial data on reliability. Similar engines on thousands of ships exhibit high reliability and show typical repair times following failures of under a few hours.98
Repair Time for Large (Ship) Reciprocating Engines
Fuel cells powered by natural gas offer another option, comparable in scale to recips. Bloom Energy has developed a solution specifically for data centers and has announced projects exceeding 1 GW.99
3.5 The Solar (Battery) Option
The fact that GW-scale data centers are city-scale loads introduces both challenges and opportunities for future power options. The challenge of integrating such large loads without compromising reliability is, for all practical purposes, unprecedented in electric utility history. Such demands also present an opportunity for the absorption of the large queue of solar facilities awaiting grid interconnection—provided, of course, that sufficient transmission lines are built, a domain with nearly intractable time delays and backlogs. In addition, balancing systems (especially batteries and critical power management hardware) along with backup generation are needed to deal with the inherent episodic nature of solar.
Dominion Energy in Virginia, the state that is home to the world’s largest concentration of data centers, has forecast that it expects a doubling in overall system electricity demand from data centers. The state has filed plans to roughly double its existing 10 GW of combined solar and wind capacity. It bears noting that even with such substantial solar/wind resources, 40% of Dominion’s electricity delivered is supplied by natural gas and 30% from nuclear; under 5% came from the existing solar/wind assets.100 The future picture will look similar.
At the national level, as analysts and advocates frequently observe, the lack of additional transmission capacity is a primary impediment to harvesting (or expanding) solar generation.101 In theory, a data center operator could locate in a sunny region and build a private, off-grid, solar-plus-battery array. Thus far no such construction has been announced, though hybrid options (solar, battery, generators) are coming and viable.
Existing and Proposed Electricity Transmission

Generally ignored in the solar calculus is the fact that solar and wind intermittency requires far more per-watt use of ancillary electric equipment and power control systems to ensure delivery and grid stability. 102(The inadequacy of such grid management hardware and balancing controls was the proximate cause of the massive 2025 Iberian power outage.)
For context: a stand-alone 1-GW private grid in a favorable, sunny location would require about a $6 billion solar-plus-battery facility to nominally match grid-scale reliability.103 Building instead recips and/or simple-cycle turbines instead would yield the same reliable power for much less than $1billion. That contrast explains the interest in grid-integrated solar, and future small, on-site nuclear power plants.
Electrical Equipment Content for U.S. Power Generation Additions

3.6 Power Management: A Tale of Two Curves
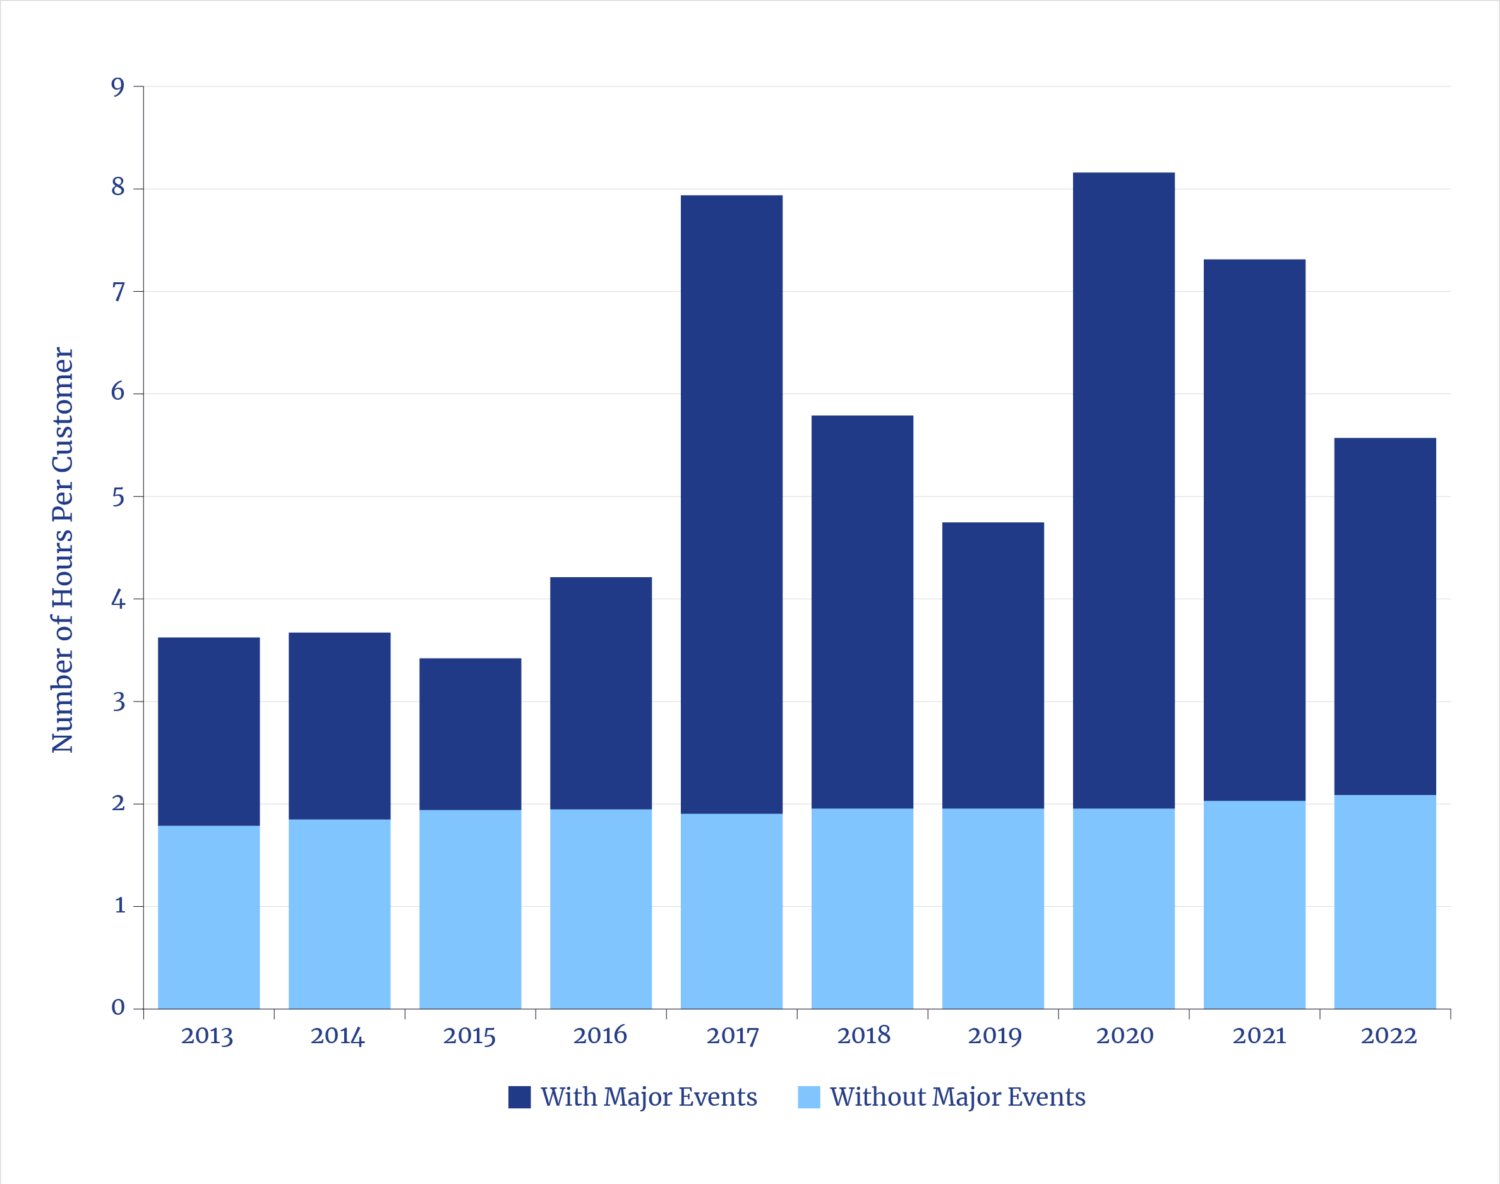
The electric utility industry has long known that two curves drive the challenges in supplying electricity 24-7. The market’s power demands can vary as much as twofold every day, known as the daily load curve. Averaged over the year, only a small share of total hours of generation is thus used to meet peak demands, which is known as the load duration curve.
It is an old idea that assets and money can be saved by minimizing the number of power plants and the size of transmission systems if demand variations can be better managed. Modern sophisticated techniques and technologies to create demand-side management (DSM) programs trace their origins to the oil crises of 1973–74 and 1979. (Oil supplied about 15% of U.S. electricity generation at that time; less than 1% today.)
Power Management: A Tale of Two Curves
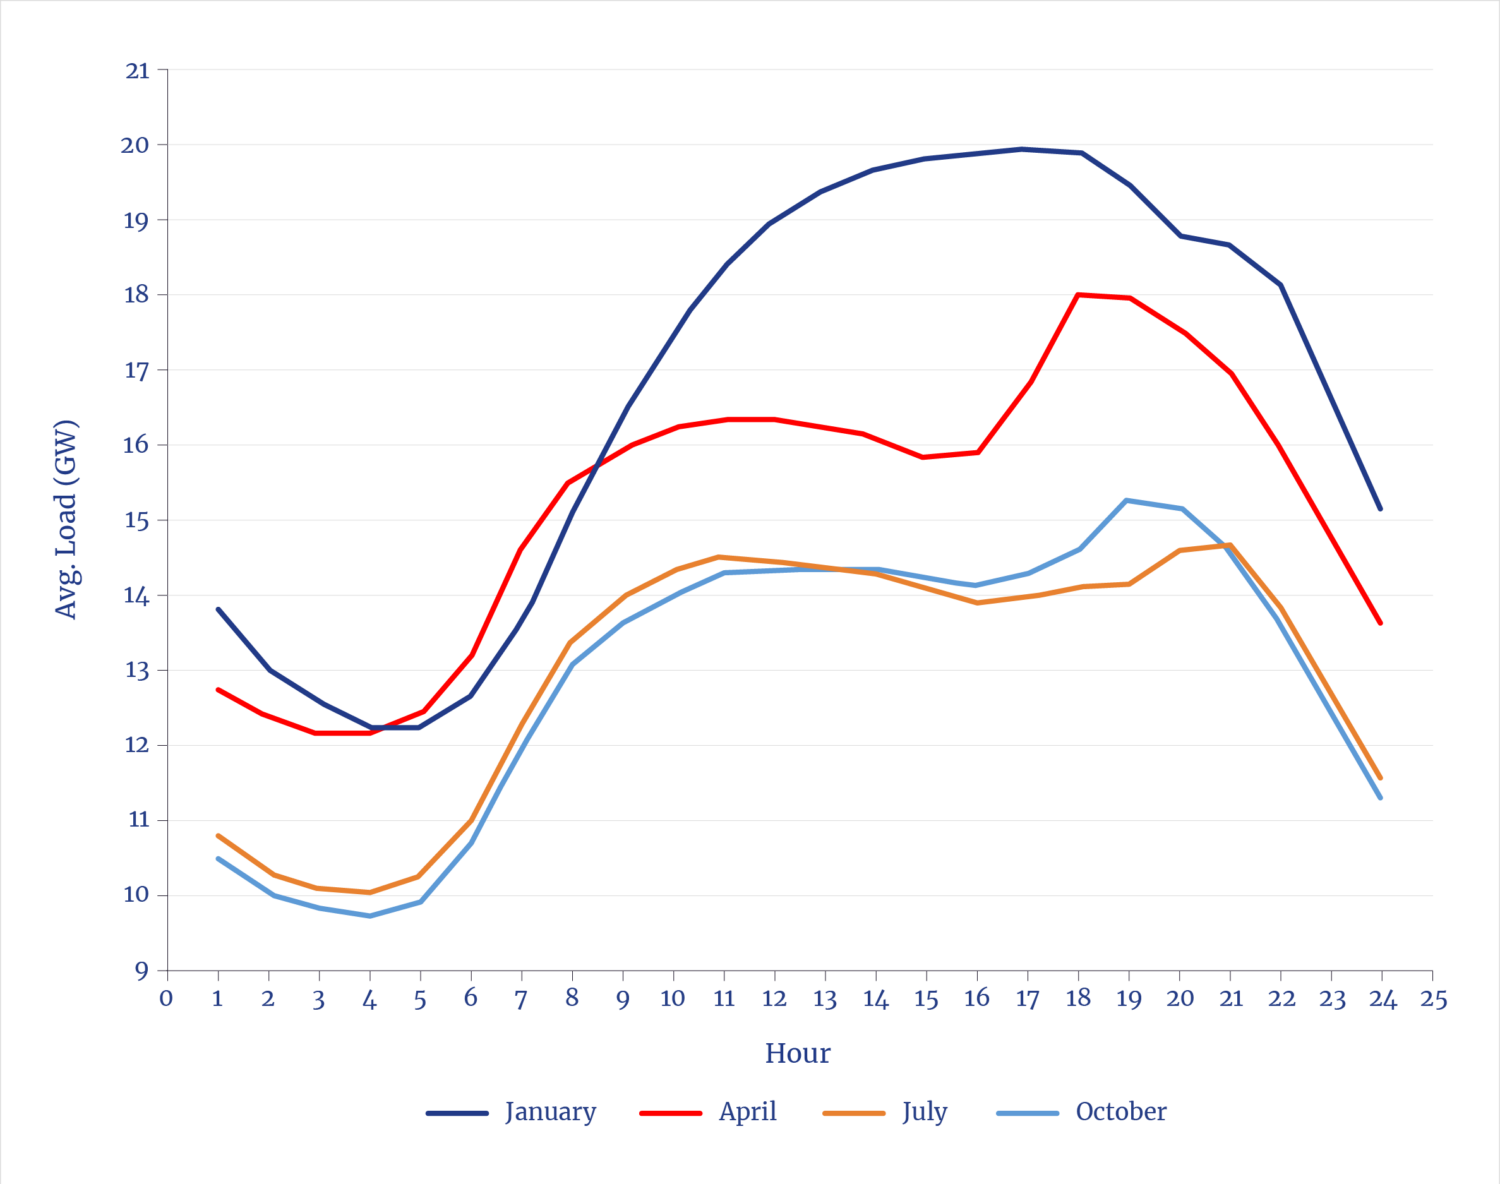
The idea of DSM is simple: a combination of financial incentives and technologies can persuade, or mandate, customers to use less at peaks and shift uses to the valleys. Large industrials have long been offered rate discounts in exchange for as-needed load shedding. Most consumers today are charged time-of-use rates, which penalize use during peaks. While such techniques don’t change the amount of energy used, they do shift when it’s used and thereby reduce the size and number of assets needed.
There is nothing novel about current proposals to improve DSM. What is novel is the nature of data centers as a new class of load. The challenge to have data centers operate flexibly is unchanged—certain activities are not flexible, and many require extraordinary spending (or mandates) to shift behavior. However, there is truth to the claim that superior sensors and monitoring, combined with AI-driven analytics, can improve DSM. Google, for example, has implemented techniques that can reduce data center power use by up to 25% at peak times.104 The Electric Power Research Institute (EPRI) has launched a multi-industry initiative to develop new DSM technologies.105 There are certainly some significant new options made possible by next-generation power electronics combined with AI-enabled grid-to-chip strategies.106 It is, however, déjà vu all over again for longtime observers of utilities.
Annual Load Duration Curves
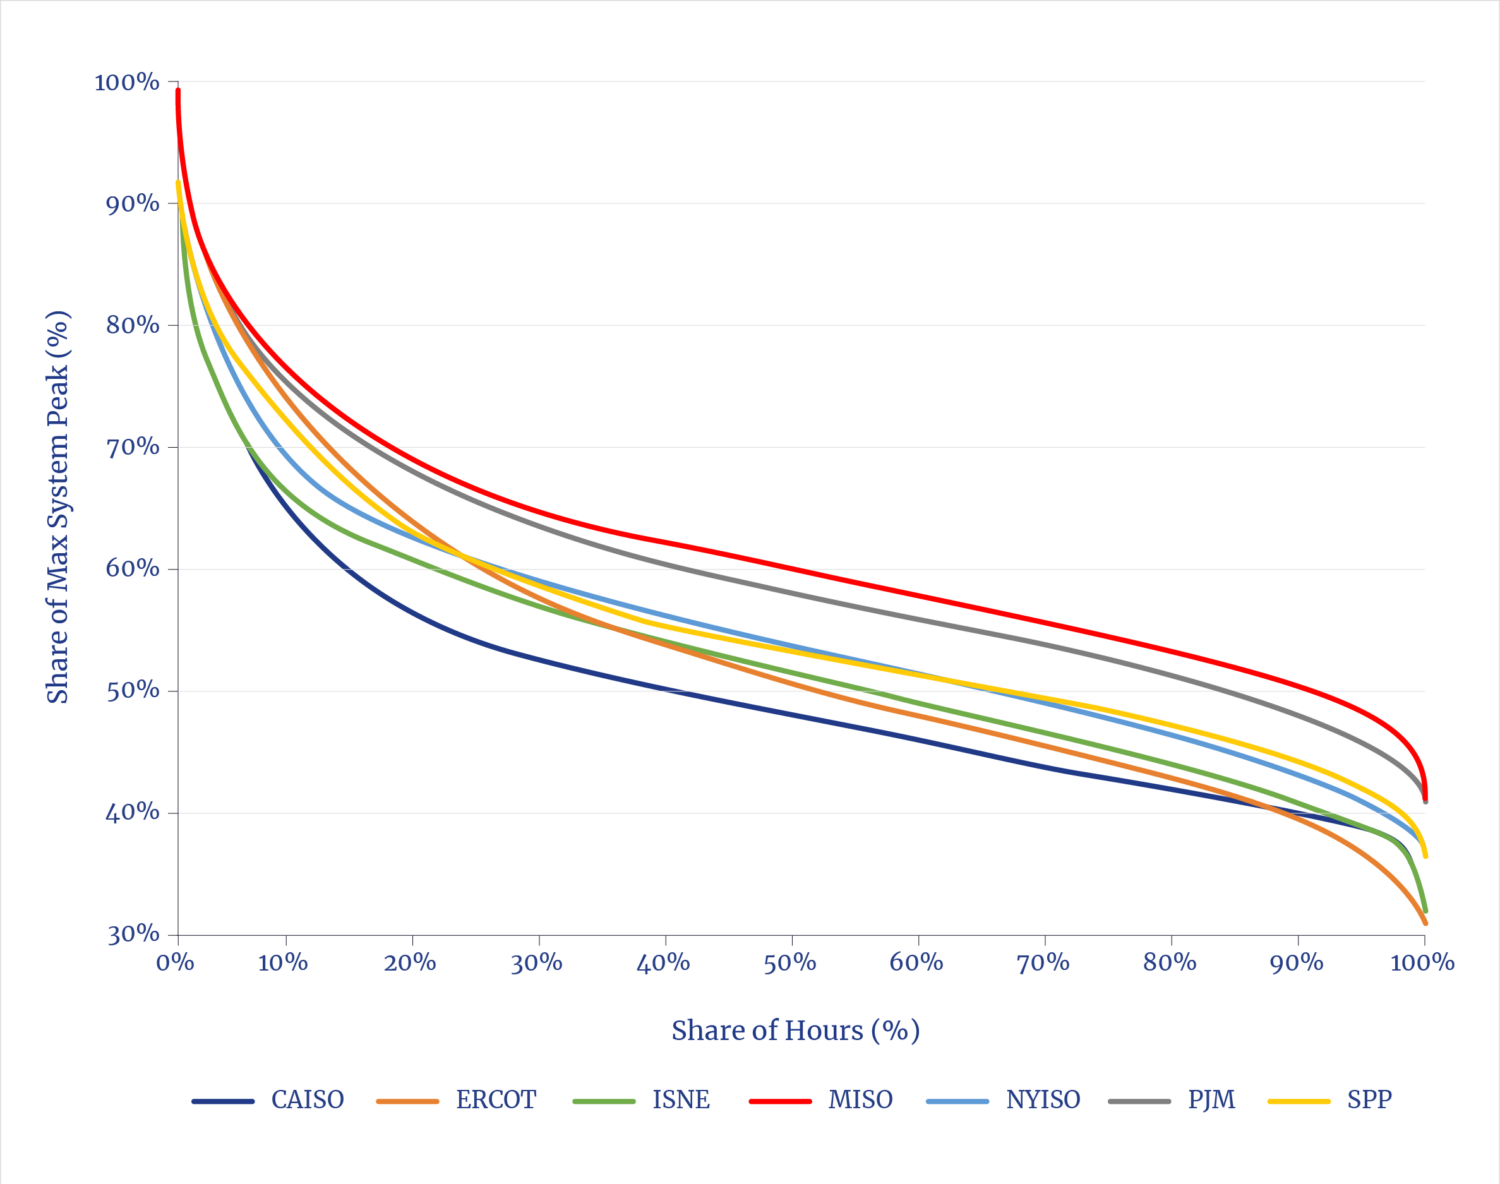
Echoing studies from earlier eras, analysts today rediscover that, in theory, enormous amounts of capacity can be unlocked through superior management. One such recent, widely cited analysis noted in its conclusion that there were “other considerations,” including “ensuring adequate transmission capacity” (earlier noted as very challenging), having “ramp-feasible reserves” (i.e., conventional power plants or massive battery arrays), and an assumption that “new loads do not change current demand patterns” (but they will).107
3.7 The Labor Challenge
Data centers not only compete for the same energy as the broader market—for such things as new factories and LNG exports—but also for the labor force that is also needed to construct all the new facilities, as well as homes and offices.
The construction of most infrastructures involves similar activities and skills, regardless of whether it entails a chip manufacturing plant, a shipyard, highways, houses, pipelines, power plants, or data centers. All such construction involves the need for similar people with comparable skills, from heavy equipment and vehicle operators to electricians, plumbers, welders, and carpenters. Roughly every $1 billion of construction requires 5,000 to 10,000 construction workers.108
Survey: Difficulties in Finding Energy Employees
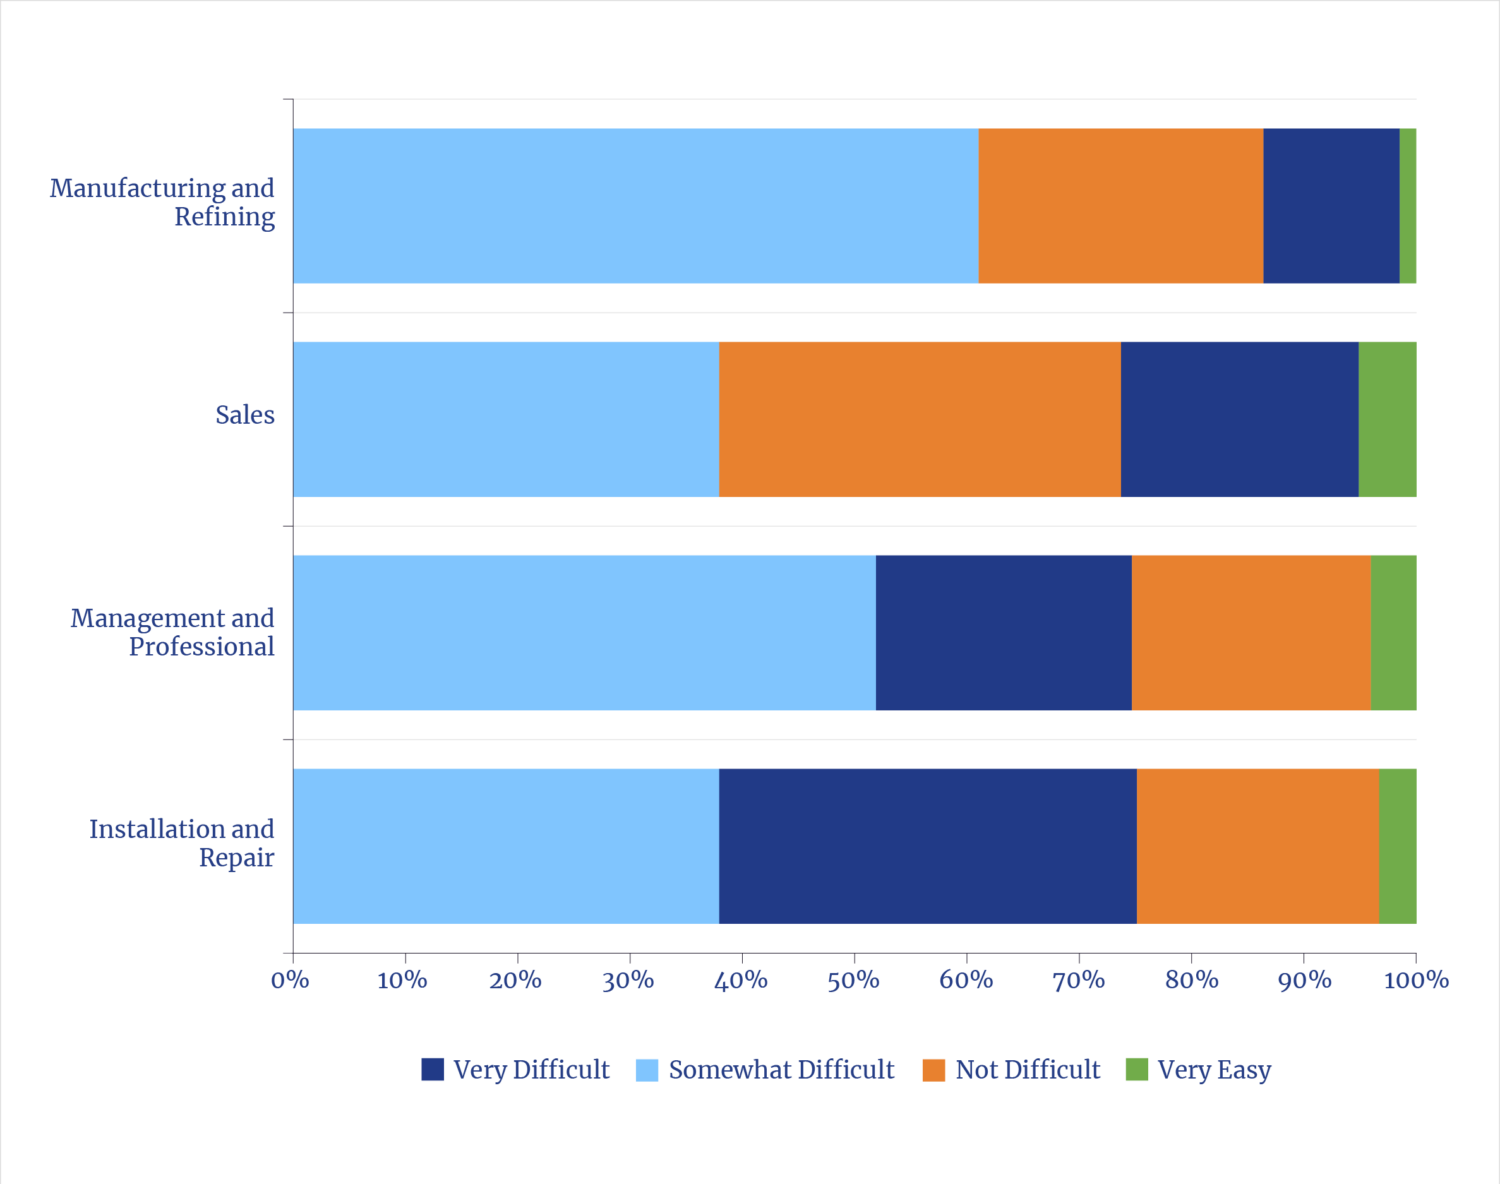
The estimated $500 billion in data center construction will not only induce demand for more energy, but also for more people working in the upstream energy-related industries. To meet the labor demand will be challenging. The rate of data center construction implies the need for at least 250,000 people in the skilled trades (assuming the current $50 billion/year build rate). This will come at a time when the energy-supply industries will need additional skilled labor.
Industrial automation is a long-standing solution for amplifying labor. The new demands for labor will likely accelerate the use of emerging options for such things as semi-automated and fully automated construction machines, including robotrucks (the latter have long been used at mine sites). The effect will be to free up people in that limited labor pool to do work on other difficult-to-automate tasks.
Employment in the Energy Production Sector
The only other option for expanding the skilled workforce is to encourage those currently in it to stay longer, to convince more young people to enter the skilled trades, and to train them more rapidly. Trends suggest this has begun. Shop classes are returning to many high schools and apprenticeships are growing. 109At the same time, some of the same technologies that are creating the demand to build AI data centers are also offering superior means for training in the skilled trades. Construction equipment industries are increasingly using training simulators based on virtual reality (VR) and augmented reality (AR), which appear to lead to significant improvement in outcomes.110
Endnotes
- Joel Mokyr, “The Past and the Future of Innovation: Some Lessons from Economic History.” Explorations in Economic History 69 (July 2018): 13–26.
- Joel Mokyr, The Lever of Riches: Technological Creativity and Economic Progress (Oxford University Press, 1992).
- John Horgan, “Profile of Claude Shannon, Inventor of Information Theory,” Scientific American blog network, July 26, 2017.
- Dermot Turing, Prof: Alan Turing Decoded (Stroud, Gloucestershire: The History Press, 2016).
- Andrew Nusca, “This Man Is Leading an AI Revolution in Silicon Valley—And He’s Just Getting Started,” Fortune, Nov. 16, 2017.
- Marius Hobbhahn and Tamay Besiroglu, “Predicting GPU Performance,” Epoch AI, December 1, 2022.
- The White House, “Winning the Race: America’s AI Action Plan,” July 2025.
- ABC, “Nonresidential Construction Spending Contracts in 6 of Past 7 Months,” August 1, 2025.
- Christopher Beam, “‘I Believe It’s a Bubble’: What Some Smart People Are Saying About AI,” Bloomberg, October 9, 2025.
- Gyana Swain, “Black Rock’s 40B Data Center Deal Opens a New Infrastructure Battle for CIOs,” CIO, October 16, 2025.
- McKinsey & Company, “The Cost of Compute: A $7 Trillion Race to Scale Data Centers,” April 28, 2025.
- Felix Richter, “AWS Stays Ahead as Cloud Market Accelerates.” Statista, November 4, 2025.
- John D. Wilson, Zach Zimmerman, and Rob Gramlich, “Strategic Industries Surging: Driving US Power Demand,” Grid Strategies, December 2024.
- Vahid Karaahmetovic, “How Much Does a GW of Data Center Capacity Actually Cost?” Investing.com, November 1, 2025. [Note: this is a comparison of the primary energy to produce a kWh of electricity and the equivalent energy in gasoline consumption]
- Steve Preston, letter to the editor, Wall Street Journal, October 5, 2025.
- Justin Fox. “The AI Spending Boom Is Massive But Not Unprecedented.” Silicon Valley Capital Partners, October 8, 2025. Rui M. Pereira, William J. Hausman, and Alfredo Marvão, “Railroads and Economic Growth in the Antebellum United States,” Department of Economics, College of William and Mary, Working Paper #53, December 2014.
- Robert Armstrong and Hakyung Kim, “Does GDP Growth Minus AI Capex Equal Zero?” Financial Times, October 1, 2025.
- https://www2.census.gov/library/publications/decennial/1920/bulletins/manufacturing/manufactures-us.pdfLowell. J. Chawner, “Capital Expenditures for Manufacturing Plant and Equipment—1915 to1940,” St. Louis Fed, Survey of Current Business, vol. 21, no. 3, March 1941:9–16; U.S. Department of Commerce, National Bureau of Economic Research, Macrohistory Database: New Manufacturing Capital Expenditures (Series Q10096USQ144NNBR), 1940; U.S. Bureau of the Census, Census of Manufactures: 1919 (2022); United States Bureau of the Census, Materials Used in Manufactures: 1929; U.S. Bureau of Mines, Petroleum Refinery Statistics: 1930, Bulletin 367, 1931; U.S. Bureau of the Census, Historical Statistics of the United States, 1789–1945, (1949); Engineering News-Record, Construction Cost Index History (1908–2005) (McGraw-Hill, 2005); U.S. Bureau of the Census, Census of Manufactures: 1939 (1942); Louis Johnston and Samuel H. Williamson, “What Was the U.S. GDP Then?” MeasuringWorth, 2025. We reconstructed annual U.S. spending on chemical, pharmaceutical, fertilizer, and petroleum refinery plant construction from 1900–1930, expressed in constant 1915 dollars as a share of GDP. Data were back cast to early Census benchmarks and the series was calibrated so that 1930 equaled about 4.4 % of GDP, consistent with the 1939 Census benchmark.
- “The Cost of Compute: A $7 Trillion Race to Scale Data Centers,” McKinsey Quarterly, April 28, 2025.
- Robert M. Solow, Lecture to the Memory of Alfred Nobel, December8, 1987.
- Thomas Ladenburg, “The Industrial Revolution,” in Digital History, University of Houston, 2007; Brian Potter, “The Blast Furnace: 800 Years of Technology Improvement,” Construction Physics, February 23, 2027.
- Greg Bensinger, “Exclusive: Amazon Targets as Many as 30,000 Corporate Job Cuts, Sources Say,” Reuters, October 27, 2025; Kevin Carter, “UPS Tops Q1 Estimates, Announces 20,000 Employees Being Laid Off This Year,” Investopedia, April 29, 2025.
- Andrew Betz, “CBO’s Economic Forecast: Understanding Productivity Growth,” NABE Foundation’s 22nd Annual Economic Measurement Seminar, Congressional Budget Office, 14 July 14, 2025.
- Greg Ip, “Behind Job Weakness Are Hints of a Productivity Revival. Is AI the Reason?” Wall Street Journal, October 3, 2025.
- Stanford University, Artificial Intelligence Index Report, 2025, 263
- Rockwell Automation, State of Smart Manufacturing, 2025.
- file:///C|/Users/lehqu/OneDrive – Texas Public Policy Foundation/Reports/Mills HAMM – AI/Annette Zimmerman et al., “Emerging Tech Impact Radar: Generative AI,” Gartner, February 14, 2025.Annette Zimmerman et al., “Emerging Tech Impact Radar: Generative AI,” Gartner, February 14, 2025.
- McKinsey & Company, “The State of AI in Early 2024: Gen AI Adoption Spikes and Shows No Signs of Slowing.” McKinsey & Company, May 29, 2024
- Andreas Exarheas, “‘We Need More Energy’, NVIDIA Boss Says,” Rigzone, October 10, 2025.
- Winning the AI Race: Strengthening U.S. Capabilities in Computing and Innovation: Hearing Before the Committee on Commerce, Science, and Transportation, United States Senate, 119th Congress, 2025, United States, Congress, Senate, Committee on Commerce, Science, and Transportation, Hearing, May 8, 2025, p. 47.
- George Kamiya,“Mobile Net Zero 2025: State of the Industry on Climate Action,” GSMA.com, June 2025.
- Ericsson, Mobility Report, June 2025.
- Lionel Sujay Vailshery, “Edge Computing Market Value Worldwide 2019–2028,” Statista, June 26, 2025.
- Julia Christina Hess and Anna Semenova, “Semiconductor Emission Explorer: Tracking Greenhouse Gas Emissions from Chip Production (2015–2023),” Interface, March 17, 2025; Zachary Skidmore, “IEA: Data Center Energy Consumption Set to Double by 2030 to 945TWh,” Data Center Dynamics, April 11, 2025.
- Ege Erdil and Tamay Besiroglu, “Explosive Growth from AI Automation: A Review of the Evidence and Implications,” arXivLabs, 2024.
- David B. Agus, “AI and the Fountain of Youth,” Wall Street Journal, October 8, 2025.
- CBRE, North America Data Center Trends H1 2025, September 8, 2025.
- Ibid.
- Shon Hiatt and Angela Ryu, Data Center Energy Demand: Who, Where, and How Growth is Emerging, Zage Business of Energy Initiative Energy Brief, University of Southern California, Marshall School of Business, September 24, 2025. Note: Data includes to-be-published update.
- Goldman Sachs, “How AI Is Transforming Data Centers and Ramping Up Power Demand,” August 29, 2025.
- Sebastian Moss, “Brookfield: Next Decade Will See 75GW of AI Data Centers Built, Total AI Infrastructure Spend to Pass $7 Trillion GPU Installed Base to Hit 45 Million by 2034,” DCD, August 8, 2025.
- DNV, Energy Transition Outlook 2025.
- Dylan Patel, Daniel Nishball, and Jeremie Eliahou Ontiveros, “AI Datacenter Energy Dilemma—Race for AI Datacenter Space: Gigawatt Dreams and Matroyshka Brains Limited by Datacenters Not Chips,” SemiAnalysis, March 13, 2024.
- “2024 United States Data Center Energy Usage Report,” LBNL-2001637, December 2024.
- Konstantin F. Pilz, Yusuf Mahmood, and Lennart Heim, “AI’s Power Requirements Under Exponential Growth,” RAND, January 28, 2025.
- Rystad Energy, “Data Centers Reshape U.S. Power Sector,” February 25, 2025.
- Garrett Hering and Susan Dlin, “Data Center Grid-Power Demand to Rise 22% in 2025, Nearly Triple by 2030,” S&P Global, October 14, 2025.
- Padraic Brick et al., “AI Data Center Forecast: From Scramble to Strategy,” Bain & Company, October 2025.
- Thunder Said Energy, “Energy Intensity of AI: Chomping at the Bit?” April 18, 2024.
- IEA Energy and AI, 2025, https://www.iea.org/reports/energy-and-ai
- World Resources Institute, “Powering the US Data Center Boom: Why Forecasting Can Be So Tricky,” September 17, 2025.
- Andrew Obin, “Removing ‘Grid’ Lock 3.0: Updated Deep Dive on US Grid and Power Gen Drivers,” Equity Americas Industrials/Multi-Industry, BofA Securities, June 11, 2025.
- Sebastian Moss, “Brookfield: Next Decade Will See 75GW of AI Data Centers Built, Total AI Infrastructure Spend to Pass $7 Trillion,” DCD, August 8, 2025.
- Thunder Said Energy, “Energy Intensity of AI.”
- CBRE, North America Data Center Trends H1 2025, September 8, 2025.
- Shon Hiatt and Angela Ryu, Data Center Energy Demand: Who, Where, and How Growth is Emerging, Zage Business of Energy Initiative Energy Brief, University of Southern California, Marshall School of Business, September 24, 2025. Note: Data includes to-be-published update.
- “2024 United States Data Center Energy Usage Report,” Berkeley Lab, LBNL-2001637, December 2024.
- Garrett Hering and Susan Dlin, “Data Center Grid-Power Demand to Rise 22% in 2025, Nearly Triple by 2030,” S&P Global, October 14, 2025.
- Padraic Brick et al., “AI Data Center Forecast: From Scramble to Strategy,” Bain & Company, October 2025.
- Dylan Patel, Daniel Nishball, and Jeremie Eliahou Ontiveros, “AI Datacenter Energy Dilemma–Race for AI Datacenter Space: Gigawatt Dreams and Matroyshka Brains Limited by Datacenters Not Chips,” SemiAnalysis, March 13, 2024.
- Davide D’Ambrosio et al., Energy and AI, International Energy Agency (EIA), April 10, 2025
- Alice Larkin, Kevin Anderson, and Paul Peeters, “Air Transport, Climate Change and Tourism,” Tourism and Hospitality Planning & Development 6, no. 1 (April 2009): 7–20.
- Mark Liu and H.-S. Philip Wong, “How We’ll Reach a Trillion Transistor GPU: Advances in Semiconductors Are Feeding the AI Boom,” IEEE Spectrum, March 28, 2024.
- William Stanley Jevons, The Coal Question, Macmillan and Co., 1865.
- Ted Nordhaus, “The Energy Rebound Battle,” Issues in Science and Technology, Vol. XXXIII, 4, Summer 2017
- Thunder Said Energy, Energy Intensity of AI: Chomping at the Bit, April 18, 2024.
- Marius Hobbhahn and Tamay Besiroglu, “Trends in GPU Price-Performance,” EPOCH AI, June 27, 2022.
- Thunder Said Energy, “Chomping at the Bit.”
- Alexia Jolicoeur-Martineau, “Less is More: Recursive Reasoning with Tiny Networks,” arxiv, October 6, 2025.
- Thunder Said, AI training energy: breaking the power laws?, October 9, 2025.
- Christopher R. Knittel, Juan Ramon L. Senga, and Shen Wang, “Flexible Data Centers and the Grid: Lower Costs, Higher Emissions?” National Bureau of Economic Research, Working Paper 34065, July 2025.
- D’Ambrosio et al, “Energy and AI,” IEA, April 10, 2025.
- “U.S. Developers Report Half of New Electric Generating Capacity Will Come From Solar,” EIA, Today in Energy, August 20, 2025.
- Jonathan Lesser, The U.S. Energy Information Administration Needs to Fix How It Reports Renewable Power Capacity, National Center for Energy Analytics, July 23, 2025.
- Kassia Micek and Susan Dlin, “U.S. Renewables Tracker: 8.753 GW of Clean Energy Capacity Added in Q2,” Commodity Insights, S&P Global, October 1, 2025.
- Church, “U.S. Coal Exports Declined 11% in the First Half of 2025 Due to Reduced Exports to China,” Today in Energy, EIA, October 31, 2025.
- Ethan Howland, “NERC President Warns of ‘Five-Alarm Fire’ for Grid Reliability,” Utility Dive, Oct 22, 2025.
- U.S. Dept. of Energy, Resource Adequacy Report: Evaluating the Reliability and Security of the United States Electric Grid, July 2025.
- Nathan Shreve et al., “Fewer New Miles: Strategic Industries Held Back by Slow Pace of Transmission,” Americans for a Clean Energy Grid, July 2025.
- “The Least U.S. Interstate Natural Gas Pipeline Capacity on Record Added in 2022,” EIA, Today in Energy, March 2, 2023; “Natural Gas Pipeline Project Completions Increase U.S. Takeaway Capacity in 2024,” EIA, Today in Energy, March 17, 2025.
- U.S. Department of Energy, Grid Deployment Office, “Long-Term U.S. Transmission Planning Scenarios,” National Transmission Planning Study, Section 2.3.1 and Appendix A.
- Arbo, “Benchmarking Interstate Pipeline Timelines,” Arbo blog, May 6, 2025.
- Thomas C. Ryan et al, “U.S. Government Announces Historic 80 Billion Nuclear Partnership with Westinghouse Electric Company, Cameco Corporation, and Brookfield Asset Management to Construct AP1000 Reactor Fleet,” K&L Gates, October 30, 2025.
- World Nuclear Association, Global Nuclear Industry Performance, September 1, 2025.
- OECD, The NEA Small Modular Reactor Dashboard: Third Edition, September 11, 2025.
- Zachary Skidmore, “Southern Company to Extend Life of Three Coal Plants Due to Data Center Energy Demand,” DCD, February 22, 2025, and Tsvetana Paraskova, “Coal Creeps Back as Gas Gets Pricey,” Oil Price, March 26, 2025.
- Electricity, Coal, and Renewables, Short-Term Energy Outlook, EIA, October 7, 2025.
- Dylan Patel et al., “Meta Superintelligence–Leadership Compute, Talent, and Data,” SemiAnalysis, July 11, 2025.
- Stephen Stapczynski, Akshat Rathi, and Josh Saul, “AI-Driven Demand for Gas Turbines Risks a New Energy Crunch,” Bloomberg Green, October 1, 2025.
- “North America’s LNG Export Capacity Could More than Double by 2029,” Today in Energy, EIA, October 16, 2025. Each GW uses ~150 million cubic feet per day in an efficient combined-cycle turbine, ~ 250 for low cost, more available simple-cycle turbines.
- “North America’s LNG Export Capacity Could More than Double by 2029,” Today in Energy, EIA, October 16, 2025.
- Diana DiGangi, “Gas Turbine Manufacturers Expand Capacity, but Order Backlog Could Prove Stubborn,” Utility Dive, September 5, 2025.
- Thunder Said Energy, “Global Gas Turbines by Region and Over Time,” 2025.
- Global Market Insights, Reciprocating Power Generating Engine Market Size—By Fuel Type, By Rated Power, by Application, by End Use, Analysis, Share, Growth Forecast, 2025—2034, May 2025. The $50B global market for power generation recips @ ~$500/kW implies ~100 GW/year.
- Zachary Skidmore, “VoltaGrid to Supply Oracle with 2.3GW of Natural Gas Power for AI Data Centers,” DCD, October16, 2025.
- Joule, Caterpillar, and Wheeler Announce an Agreement to Power America’s Growing Data Center Energy Needs, Caterpillar.com, August 7, 2025.
- “Natural Gas-Fired Reciprocating Engines Are Being Deployed More to Balance Renewables,” EIA, Today in Energy, February19, 2019.
- Spencer August Dugan and Ingrid Bouwer Utne, “Statistical Analysis of Vessel Loss of Command Frequency,” Maritime Transport Research 6 (June 2024).
- Zachary Skidmore, “Bloom Energy signs $5bn partnership with Brookfield to deploy fuel cell tech at AI data centers,” DCD, October 13, 2025.
- Zachary Skidmore, “Dominion Energy Outlines Long-Term Strategy for Virginia’s Power Infrastructure,” DCD, October 18, 2024.
- Will Gorman et al, “Grid Connection Barriers to Renewable Energy Deployment in the United States,” Joule, February 19, 2025.
- Andrew Obin, “Removing ‘Grid’ Lock 3.0: Updated Deep Dive on US Grid and Power Gen Drivers,” Equity Americas Industrials/Multi-Industry, BofA Securities, June 11, 2025.
- Vignesh Ramasam et al., U.S. Solar Photovoltaic System and Energy Storage Cost Benchmarks, with Minimum Sustainable Price Analysis: Q1 2023, National Renewable Energy Laboratory, 2023. This calculation is based on $2,100/kW, which includes $1,400/kW for solar and $750/kW for four-hour ESS/ battery. For stand-alone solar, a 30% CF requires triple the array to store for non-sun periods, giving an effective cost of ~$4,500/kW. Adding a minimum of 12-hour storage for off-grid reliability results in an effective ESS cost of ~$2,000/kW, yields ~$6 billion cost for 1-GW off-grid reliable solar facility.
- Michael Terrell, “How We’re Making Data Centers More Flexible to Benefit Power Grids,” Inside Google, August 4, 2025.
- Lisa Martine Jenkins and Maeve Allsup, “Can a New Coalition Turn Data Centers into Grid Assets?” Latitude Media, October 31, 2024
- Zachary Skidmore, “Eaton Launches Solution to Detect Energy Demand Spikes from AI Computing Infrastructure,” DCD, September 15, 2025.
- Tyler H. Norris et al, Rethinking Load Growth: Assessing the Potential for Integration of Large Flexible Loads in US Power Systems, Nicholas Institute for Energy, Environment & Sustainability, Duke University, 2025.
- “ABC, “Construction Industry Must Attract 439,000 Workers in 2025,” January 24, 2025.
- “Apprentices by State Dashboard,” Apprenticeship.gov, U.S. Department of Labor.
- “NCCER–Transfr VR Training Pilot Shows Measurable Improvement in Student Outcomes,” Transfr, accessed November 7, 2025.