What Energy Transition? A Kaya Analysis of Global Carbon Dioxide Emissions
The Issue
Mark P. Mills
Since the 1992 United Nations Framework Convention on Climate Change (UNFCCC), the UN has hosted 29 Conference of the Parties (COP) meetings in various locations worldwide. COP 30, a gathering of thousands of representatives from nearly 200 countries, will take place November 10–21, 2025, in Belém, Brazil.. Thus far, trillions of dollars have been spent, mainly by Western nations, on the goal of “decarbonizing:” reducing global carbon dioxide (CO2) emissions in pursuit of an “energy transition” away from using hydrocarbon fuels—oil, natural gas, and coal.
COP 30 will serve as a useful benchmark to assess progress in that regard. The data indicate an enormous global expansion in solar and wind-generating capacity, electric car sales, and investments in renewable energy sources. But none of those developments has led to either a global “energy transition” away from fossil fuels or a reduction in CO2 emissions. Since 1992, overall global energy and hydrocarbon consumption have increased by more than 75% each. Brazil has followed the same trend of increasing total energy use and hydrocarbon consumption. Thus, global CO2 emissions have continued to rise, although some countries, notably in Europe, have seen a modest decline. (Much of the latter decline has been achieved by a shift in the locus of energy-intensive industries, i.e., deindustrialization.)
Whether an energy transition is even feasible remains a topic of debate. (Elsewhere, we documented that the world has never experienced a “transition” leading to the reduction in, never mind the elimination of, the use of any energy source.1) The International Energy Agency (IEA) asserts that national policies, if not national statutes and subsidies, point to a “direction of travel” that influences “the overall policy landscape, private sector decision-making,” promising that an energy transition will indeed occur and achieve a radical reduction in CO2 emissions.
Rather than consider only the top-line data noted above, we asked Stephen Eule, an NCEA Visiting Fellow, to examine the trends over the past several decades through the lens of the core factors central to the global transition/decarbonization goal. Those factors boil down to the role of growing populations and economies, which increase energy use and emissions, versus the role of greater energy efficiencies and the rising use of non-hydrocarbon energy sources, which decrease energy use and emissions. These four overarching factors (see The Reality) constitute the Kaya Identity. As Eule illustrates, the Kaya trends are instructive.
The Reality
Stephen D. Eule
The Kaya Identity2 was created by the Japanese economist Yoichi Kaya to measure CO2 emissions from energy use, based on changes over time to four elements: (1) population, (2) economic output, (3) energy intensity,3 and (4) the carbon intensity of the energy supply.4 Changes in CO2 emissions were calculated for each of the four Kaya elements from 1990 through 2024 using the IEA’s database of greenhouse gas emissions indicators.5 These data were then cumulated for each year after 1990, revealing the emissions trend for each Kaya element over time.6 Of the four Kaya elements, the energy supply’s measure of carbon intensity is the single most relevant metric for measuring the underlying status of any energy transition.
When viewing the bar charts that follow, keep in mind that bars above the “0” axis measure cumulative increases in emissions attributed to those Kaya elements, while bars below the “0” axis represent cumulative decreases in emissions attributed to those Kaya elements. These bars do not represent actual emissions but rather the change in emissions that would be expected from changes in each Kaya element, independent of changes in the other three Kaya elements. Total changes in actual emissions since 1990 are the sum of these bars, which is depicted as a black line.
Global Trends
In general, growing populations and GDP typically increase emissions, while greater energy intensity, characterized by greater efficiency and the shift towards service-oriented sectors in the economy, typically decreases emissions.7 The energy supply’s carbon intensity—that is, the transition from higher-emitting to lower-emitting sources of energy or vice versa—tends to be much less predictable.
Figure 1 plots the cumulative changes in global CO2 emissions since 1990, during which CO2 emissions increased by just over 14 gigatons, or 71%, to 34 gigatons. Population and GDP growth were the primary drivers of increased emissions. Improvements in energy intensity did almost all the heavy lifting in offsetting rising emissions from population and GDP growth. For every ton of CO2 that was reduced by transitioning to lower-carbon energy, 12.4 tons were reduced by lowering the economy’s energy intensity.
Figure 1: World: Cumulative Contribution of Kaya Elements to CO2 Emissions from Energy: 1990-2024
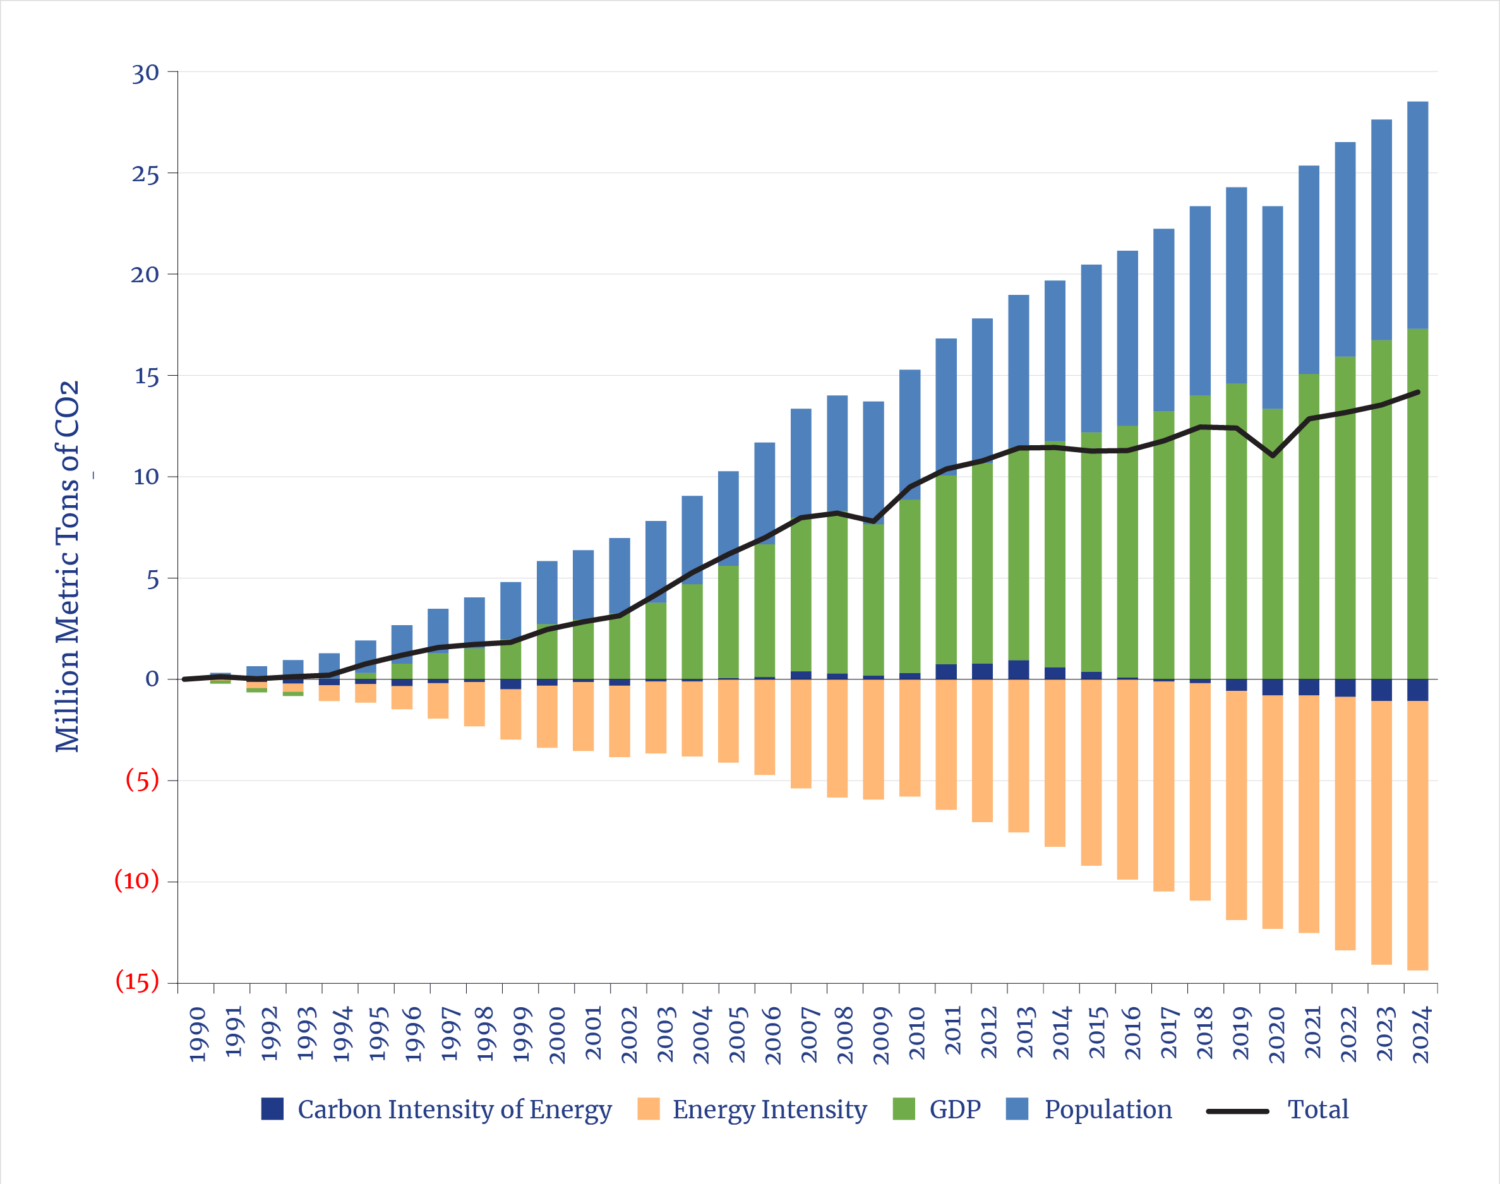
In other words, more than three decades after the UNFCCC was signed, the energy transition’s global contribution to slowing the overall increase in CO2 emissions was inconsequential. Indeed, the amount of carbon emitted per unit of energy produced was just 3% lower in 2024 than in 1990.8 These data establish that there has been no discernible global energy transition to date.
Annex I vs. Non-Annex I Countries
The Annex I—Non-Annex I bifurcation in the UNFCCC provides a reasonable framework for assessing emissions trends in developed and developing countries.9
Since 1990, Annex I CO2 emissions have declined by about 2.6 gigatons, or 19% (figure 2). Examining the individual Kaya elements in isolation, the data indicate that for Annex I, GDP growth has been the primary factor driving upward pressure on emissions, with population growth a distant second. This finding is entirely consistent with the findings of the Intergovernmental Panel on Climate Change, which noted that while “[t]echnological change might allow for radically lower emissions in the future, . . . history suggests that the most important global driver of emissions is economic growth.”10
Figure 2: Annex I: Cumulative Contribution of Kaya Elements to CO2 Emissions from Energy: 1990-2024
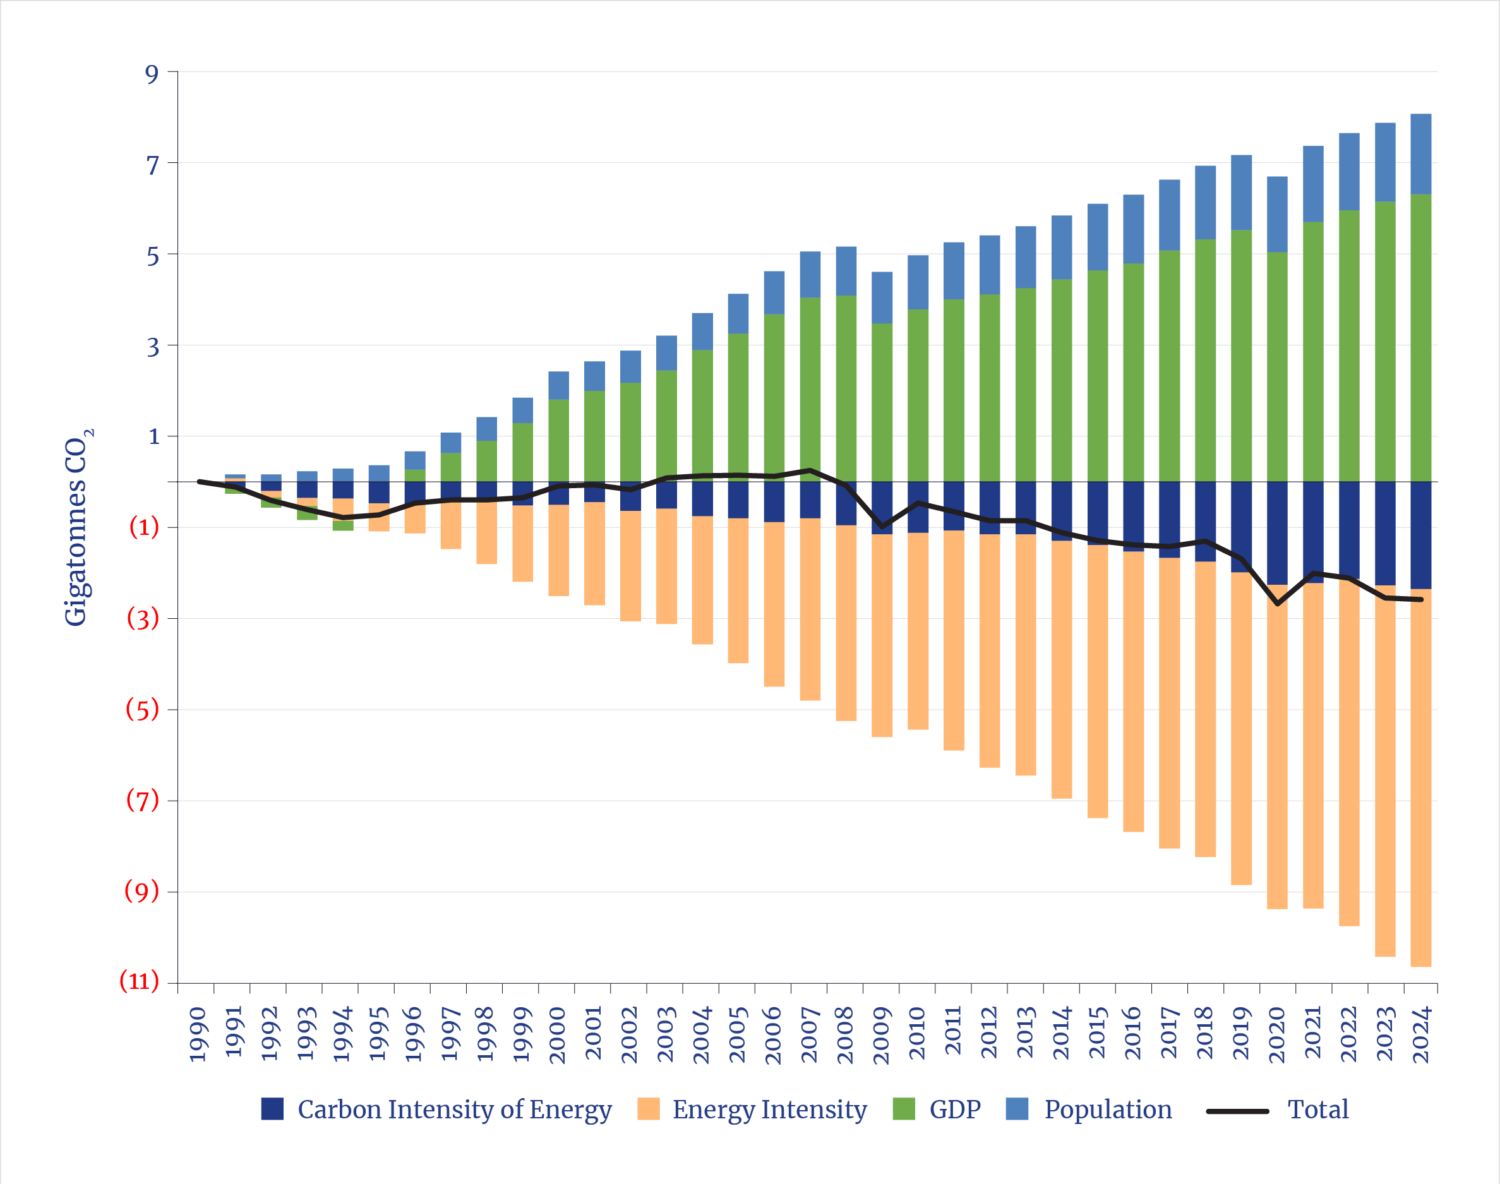
Decarbonization of the energy supply is more pronounced in Annex I countries than globally. Even so, cumulative changes in emissions stemming from changes in energy intensity since 1990 were still 3.5 times more than from decarbonization.
Instead of a full-scale energy transition, the evidence suggests that we are seeing an economic transition characterized by: (1) greater energy efficiency; (2) a natural restructuring of economies, whereby less energy-intensive service industries capture a larger share of GDP; and (3) in some regions, “carbon leakage” to developing economies.
Policy-driven carbon leakage in Europe has raised very real concerns about the deindustrialization of the continent, leading the EU to impose a carbon border-adjustment mechanism. Carbon tariffs are designed to lock in high domestic energy and regulatory costs by imposing those costs on imported goods with higher-carbon intensities.
Despite official claims in Europe (and elsewhere) that renewable technologies compete with hydrocarbons, the EU’s carbon tariff is an admission that its desired energy transition will be costly. The Draghi report on European competitiveness11 notes that EU industries face electricity prices that are two to three times higher and natural gas prices that are four to five times higher than in the United States. Recent data for Europe suggest that, far from accelerating, the energy transition has stalled.
In the United States, record natural gas production from the Shale Revolution has had a remarkable impact on the energy mix. Decarbonization has largely resulted from the substitution of natural gas for coal in the power sector.
Japan’s decision to shut down all its nuclear facilities and build coal and gas plants after the 2011 Fukushima Daiichi accident reversed some of the decarbonization that occurred in the 1990s. After a nearly four-year process, Japan began restarting its nuclear power plants in August 2015. Extending the Kaya analysis back to 1975 shows sustained decarbonization from the buildout of nuclear reactors, particularly in France, Germany, Japan, and the United States. After a wave of nuclear shutdowns demanded by environmental campaigners, Europe is (belatedly) rediscovering the advantages of nuclear power, although too late for power stations that have already closed or will close due to business decisions.12
The situation in the Non-Annex I countries, where most of the world’s CO2 emissions occur, is quite different (figure 3). Increasing emissions from population growth alone have been more than enough to offset decreasing CO2 emissions from declining energy intensity. The combination of emissions from surging economic growth and an increasing reliance on hydrocarbons for energy has produced an additional 17 gigatons of CO2 emissions in 2024, compared with 1990.
Figure 3: Non-Annex: Cumulative Contribution of Kaya Elements to CO2 Emissions from Energy: 1990-2024
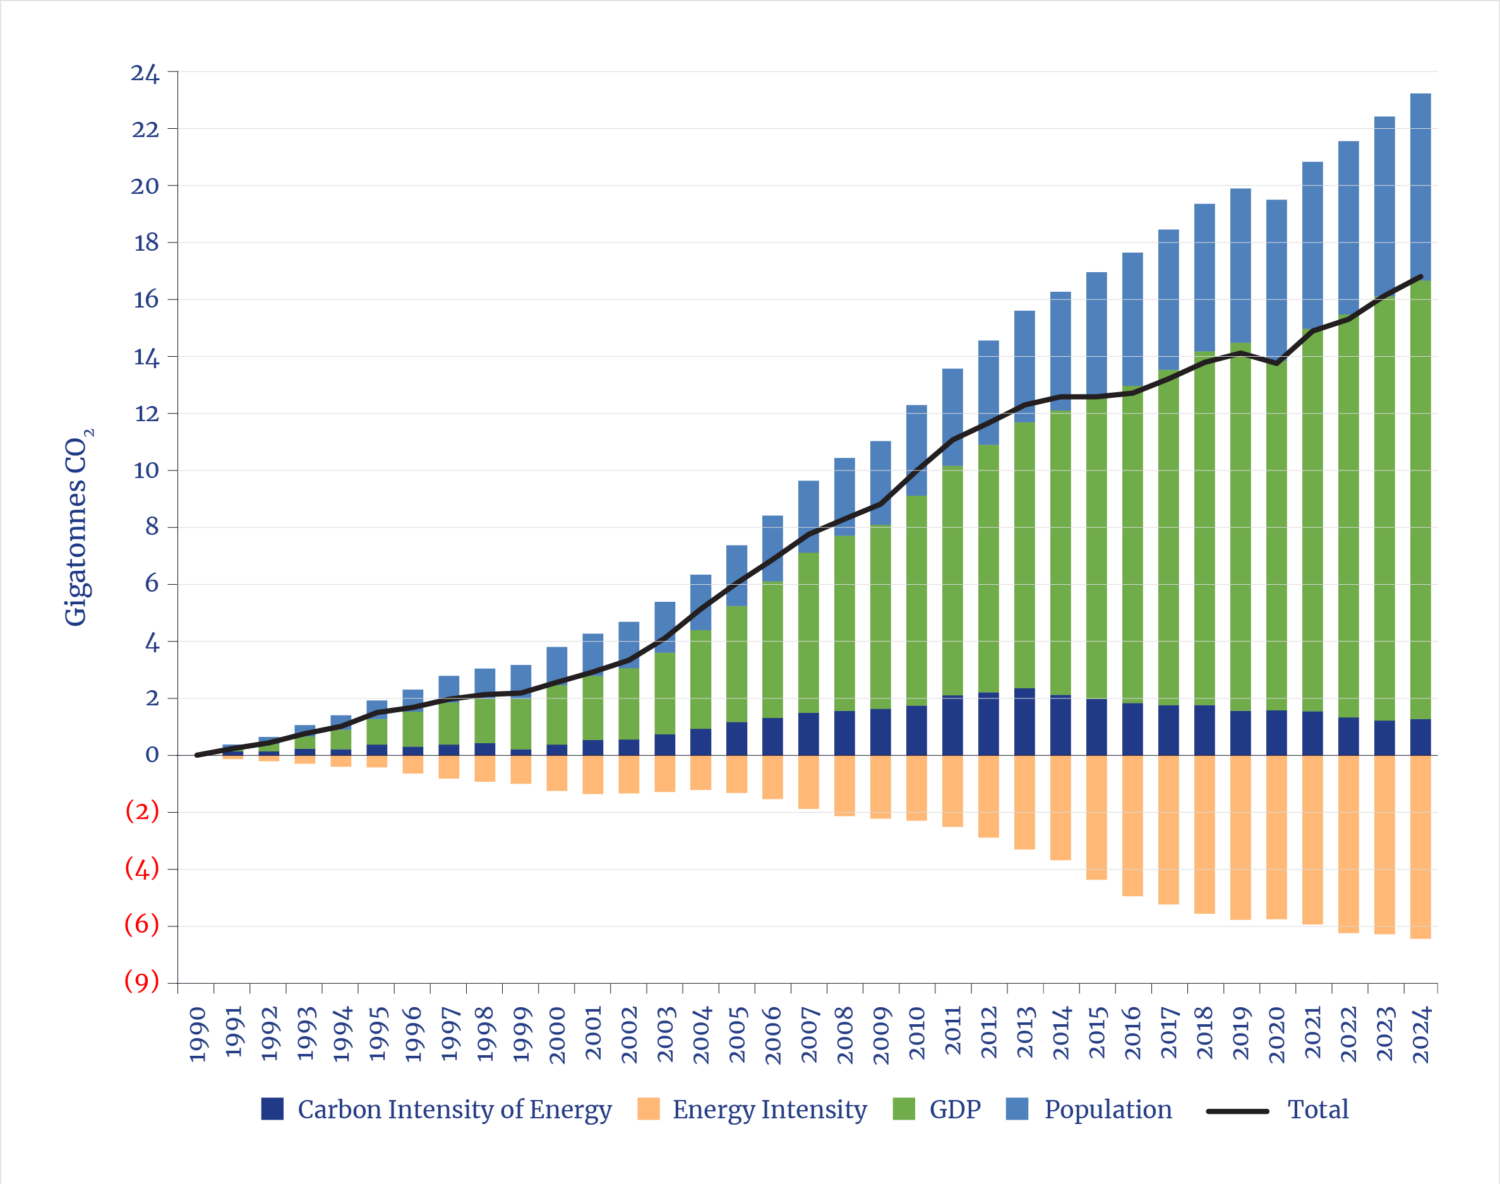
Economic growth and industrialization powered by hydrocarbons have been and will remain a priority for developing countries well into the future. Developing and emerging economies will not sacrifice economic growth to tackle CO2 emissions in any appreciable way, let alone achieve net zero by 2050. Reflecting on India’s energy challenges, Raj Kumar Singh, the former Minister of Power and Minister of New and Renewable Energy, pointed out that “you have 800 million people who don’t have access to electricity. You can’t say that they have to go to net zero, they have the right to develop, they want to build skyscrapers and have a higher standard of living; you can’t stop it.13 The energy ministers of nearly all developing countries would agree with him.
Net Zero by 2050
That reality has not stopped the IEA from exploring—some would say, cheerleading—net-zero emissions scenarios in its influential World Energy Outlook reports(WEO).14 Rates of change consistent with the IEA’s World Energy Outlook 2024 Net Zero by 2050 Scenario were used to project population, GDP, energy use, and CO2 emissions from 2025 to 2050. The contributions of the Kaya elements, calculated from these data, are shown in figure 4.
Figure 4: Net Zero: Cumulative Contributions of Kaya Elements to CO2 Emissions from Energy: 1990-2050
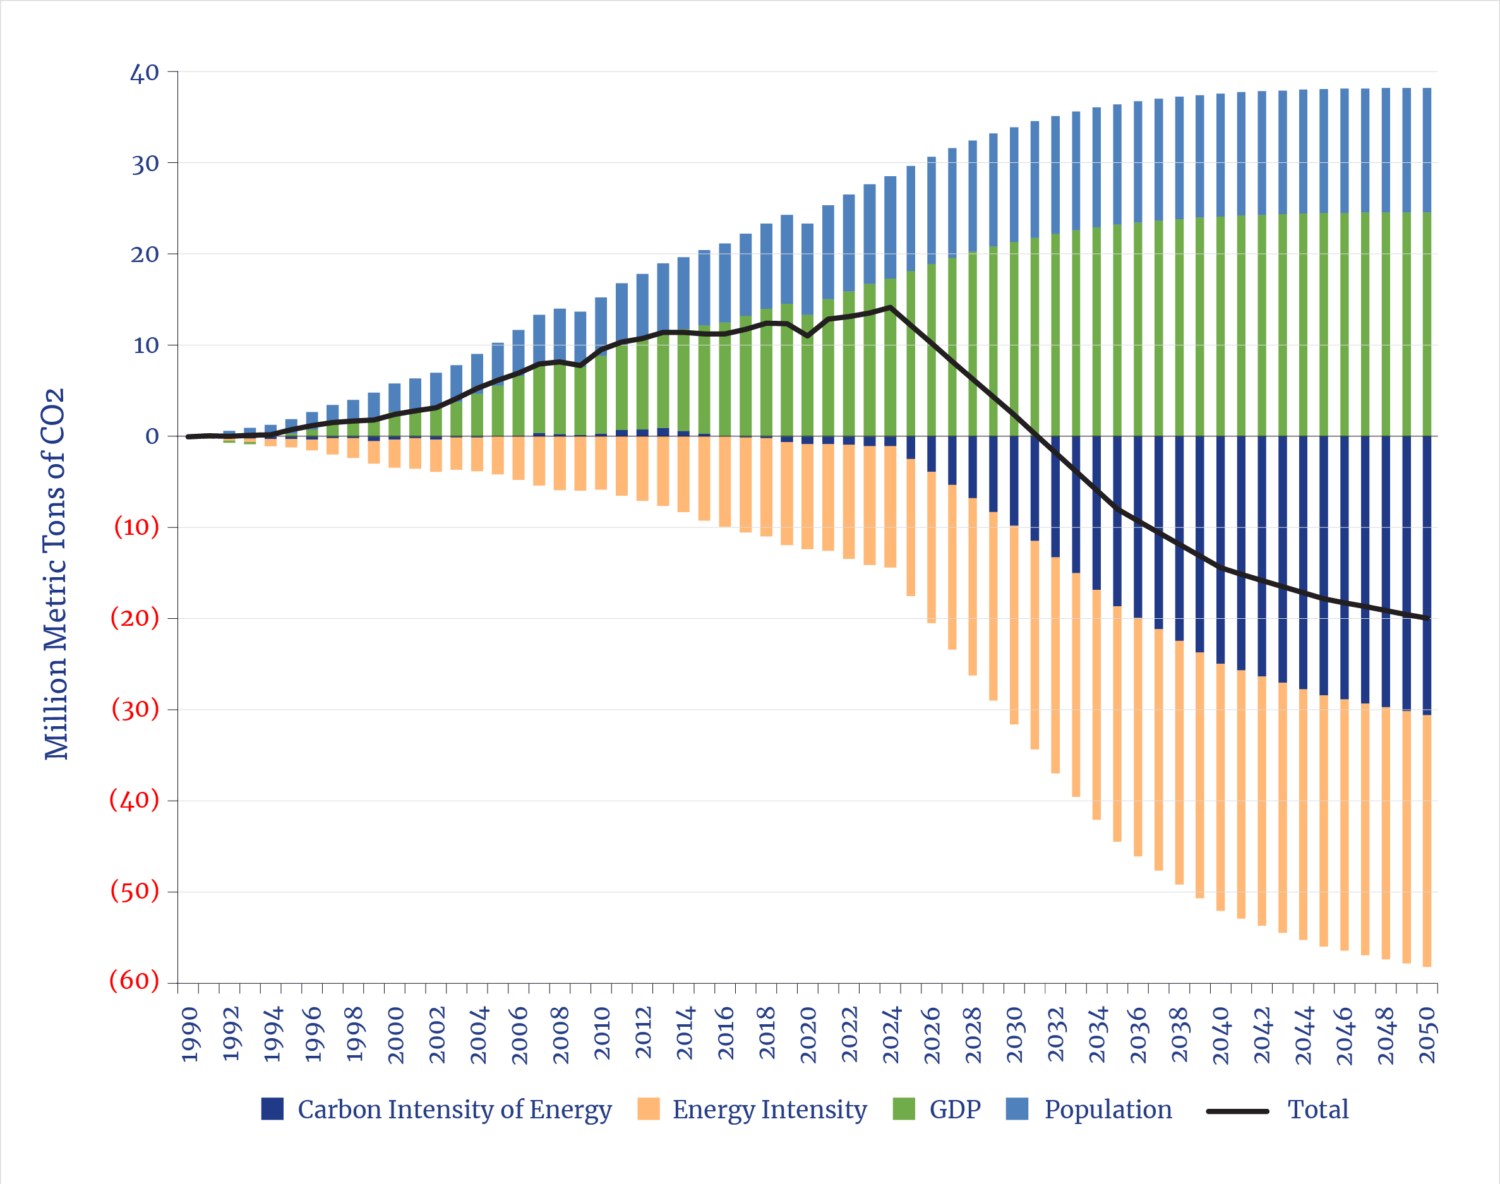
This represents a radical departure from historical trends. To put this in perspective, from 1990 to 2024, annual emissions reductions attributed to changes in energy intensity were on average 359 million metric tons of CO2 (MMTCO2) larger than reductions attributed to decarbonization. Under this net-zero scenario, annual reductions from decarbonization would have to exceed those from energy intensity by an average of 681 MMTCO2 until 2050, a swing of more than a gigaton.
All of this is supposed to take place while the world’s population climbs by a fifth (mostly in developing countries), GDP doubles, and energy-thirsty artificial intelligence and data centers send electricity demand soaring. There is nothing in the record since the UNFCCC was signed to justify such optimism, even with the IEA’s imprimatur. When juxtaposed with historical reality, the net-zero scenario bears no resemblance to any reasonable energy future.
Perspectives
Mark P. Mills
An air of unreality hangs over discussions on climate change, especially within the UNFCCC and the IEA. In 2015, Christiana Figueres, UNFCCC’s executive secretary, said that meeting climate goals required changing “the economic development model that has been reigning for at least 150 years, since the Industrial Revolution.”15 Touting an energy transition that has not materialized in any meaningful way and advocating goals, such as net zero by 2050, which cannot possibly be met, creates unreasonable expectations about what developed and especially developing countries can achieve. In a recent essay, Bill Gates rejected this “doomsday outlook,” writing, “Our chief goal should be to prevent suffering, particularly for those in the toughest conditions who live in the world’s poorest countries.”16
The global transition of energy systems has barely made a dent in emissions, and there is no way to ramp up the transition to meet fanciful emission targets. It is no wonder why. The economic and energy systems, which climate advocates want to discard, are the same systems that have unleashed an unprecedented human flourishing. The developing world especially understands that affordable, available, and scalable energy is not the problem; rather it is the solution to their problems. At some point, the reality of the global landscape of energy abundance must intrude, even in institutions as insular as the UNFCCC and the IEA.
Endnotes
- Mark P. Mills, “We’ll Never Have an Energy Transition,” City Journal, March 19, 2025. .
- The Kaya Identity is expressed as CO2 Emissions from Energy = Population x Per Capita GDP x Energy Intensity x Carbon Intensity of Energy.
- Measured as energy consumption per unit of economic output.
- Measured as CO2 emissions per unit of energy consumed.
- Greenhouse Gas Emissions from Energy, “CO2 emissions indicators,” International Energy Agency (IEA), August 2025.
- This analysis concerns itself with CO2 emissions from fuel combustion. It does not consider fugitive emissions, which are unintentional leaks such as a methane from a natural gas pipeline. Although the EIA reports fugitive-emissions data, these are not included in this analysis because the relationship to the decarbonization of the energy supply is indirect. Also, the analysis does not include emissions from international marine and aviation bunkers.
- There are, of course, exceptions. For example, energy intensity typically increases in newly industrialized developing countries. Some countries, such as those in the former Eastern Bloc, experienced large declines in GDP, while other countries, such as Japan, have declining populations.
- In 1990, 0.055 thousand metric tons of CO2 per petajoule in were emitted, versus 0.053 thousand metric tons of CO2 per petajoule in 2024.
- Annex I Parties include countries that were members of the Organisation for Economic Co-operation and Development in 1992 (plus some countries that subsequently joined the European Union), as well as countries with economies in transition (Russia, Belarus, Ukraine, and the former Eastern Bloc). All other countries are considered Non-Annex I.
- Assessment Report 5 Climate Change 2014: Mitigation of Climate Change, IPCC Working GroupIII, 2014.
- The Future of European Competitiveness: Report by Mario Draghi, European Commission, September 9, 2024.
- See, for example: Matthew M. Dalton, . “After Years of Protests, Environmentalists Are Fighting to Save Nuclear Plants,” Wall Street Journal, October 9, 2025.
- , Tilak K. Doshi and Jitendra Roychoudhury, “India’s Net Zero Pledge: What Does It Really Mean?” RealClear Energy, November 20, 2021.
- World Energy Outlook 2024, IEA, October 16, 2024. https://www.iea.org/reports/world-energy-outlook-2024.
- Bjorn Lomborg, “Gambling the World Economy on Climate,” Wall Street Journal, November 16, 2015.
- Bill Gates, “Three Tough Truths about Climate,” Gates Notes, October 28, 2025.