The Role of Energy in U.S. National Security
Listen to the Report
Letter from the Executive Director:
A Project to Create the Index of Leading Energy IndicatorsTM
With this report, NCEA introduces its new project—the Index of Leading Energy Indicators. The Leading Energy Indicators will serve as a unique and eventually interactive tool to help assess the state and future of the nation’s energy supply system.
The U.S. Energy Security Index (ESI), the first of four planned components of the Leading Energy Indicators, addresses a critical question: Will current plans for the U.S. energy system improve or degrade national security?
Indexes are commonly used as proxies for measuring the state and direction of change for complex systems influenced by various qualitative and quantitative factors. For instance, the gross domestic product (GDP) offers a single number that is widely used to measure the nation’s economic activity. Even though economists acknowledge that the GDP is neither perfect nor comprehensive in capturing all economic nuances, it remains useful—particularly for tracking the direction and rate of changes. Similarly, several institutions offer indexes to track leading economic indicators. NCEA believes that it is possible to create a comparable approach for tracking the direction of change in the nation’s energy system.
NCEA offers the first security index that calculates U.S. geopolitical risk levels in both historical and present-day contexts, framing a leading indicator based on existing plans and focusing exclusively on security factors. Similar efforts by other organizations are solely backward-looking and erroneously include qualitative, non-security considerations such as equity, sustainability, or decarbonization. NCEA’s calculation of a risk level for U.S. energy security is based on an integration of concrete data across 18 energy domains with direct relevance to national security. The ESI forecast, of course, depends on current plans that policymakers can change—for better or worse. All inputs, data sources, methodology, assumptions, and weightings used to integrate the various factors are transparently available in the Technical Appendix and on NCEA’s website.
Future additions to the Leading Energy Indicators will expand to include the three other core features of the U.S. energy system: affordability, reliability, and environmental factors. The goal is to create an interactive dashboard of these four energy indicators, which we plan to update regularly as inputs and plans evolve. We welcome commentary and refinements.
Mark P. Mills
Executive Director, NCEA
Executive Summary
Energy security has been a critical feature of geopolitics since the dawn of the modern era. Although such concerns moved into the background of geopolitics in the post–World War II era, the 1973 Arab oil embargo reignited energy security debates and motivated Congress and U.S. presidents—across party lines—to enact far-reaching federal legislation. Political anxieties abated after 2010, when the shale revolution gained momentum and eventually made the United States a net energy exporter for the first time in 70 years. And the cycle continues: Energy security has returned as a political concern amid the Russian invasion of Ukraine, the dominance of China in energy minerals, and the conflict in Iran.
NCEA’s U.S. Energy Security Index (ESI) sets out to provide a single, integrated, and numerical (rather than qualitative) indicator that measures the state and direction of U.S. energy security. ESI was designed to help assess whether the nation’s energy security is getting better or worse. Using 18 numerical risk indicators integrated into a single overall metric, ESI plots the history of U.S. energy security from 1970 to 2025 and provides a forecast to 2035 based on the energy trends projected by federal agencies.
Although the overall U.S. energy security risk declined from 2010 to 2020, recent trends show that geopolitical risks rose from 2020 to 2025 and will continue to rise over the coming decade. The increased energy risk is being driven by growing import supply risks for minerals that are essential to both conventional and alternative energy technologies. The risks are also escalating due to growing vulnerabilities from cybersecurity attacks on energy infrastructure and a lower Strategic Petroleum Reserve (SPR) inventory.
As ESI shows, over the coming decade the United States is on track to wipe out most of the gains in security achieved since 2010—the year the nation faced peak vulnerability in the twenty-first century.
The 18 risk indicators used in ESI are organized into six indicator groups: Crude Oil, Natural Gas, Uranium, Energy Technology Minerals, Energy Infrastructure Minerals, and Systemic (e.g., cybersecurity). The indicator groups are weighted and combined to form a single overall measure of U.S. energy security (see figure ES-1). Higher scores indicate a higher risk.
The trends across the six indicator groups reveal the changing nature of U.S. geopolitical risk exposure and also point to opportunities for mitigation. As figure ES-1 illustrates, reductions in energy security risks associated with oil and natural gas have been more than offset by rising vulnerabilities associated with alternative energy technologies. The substantial security gains that came from the U.S. shale revolution—the single most consequential reduction in the nation’s geopolitical energy vulnerabilities in decades—are now being eroded by risks related to imports of uranium and of energy minerals, the latter particularly critical for solar, wind, and battery hardware.
Similarly, in the modern era, ESI shows rising contributions to U.S. energy security risks from cyberattacks against energy infrastructure; crude oil price volatility, which negatively affects domestic production; and depletion of the SPR as a buffer. These new risks to U.S. energy systems have, in aggregate, replaced the earlier vulnerabilities.
Figure ES-1. Energy Security Index, by Indicator Group
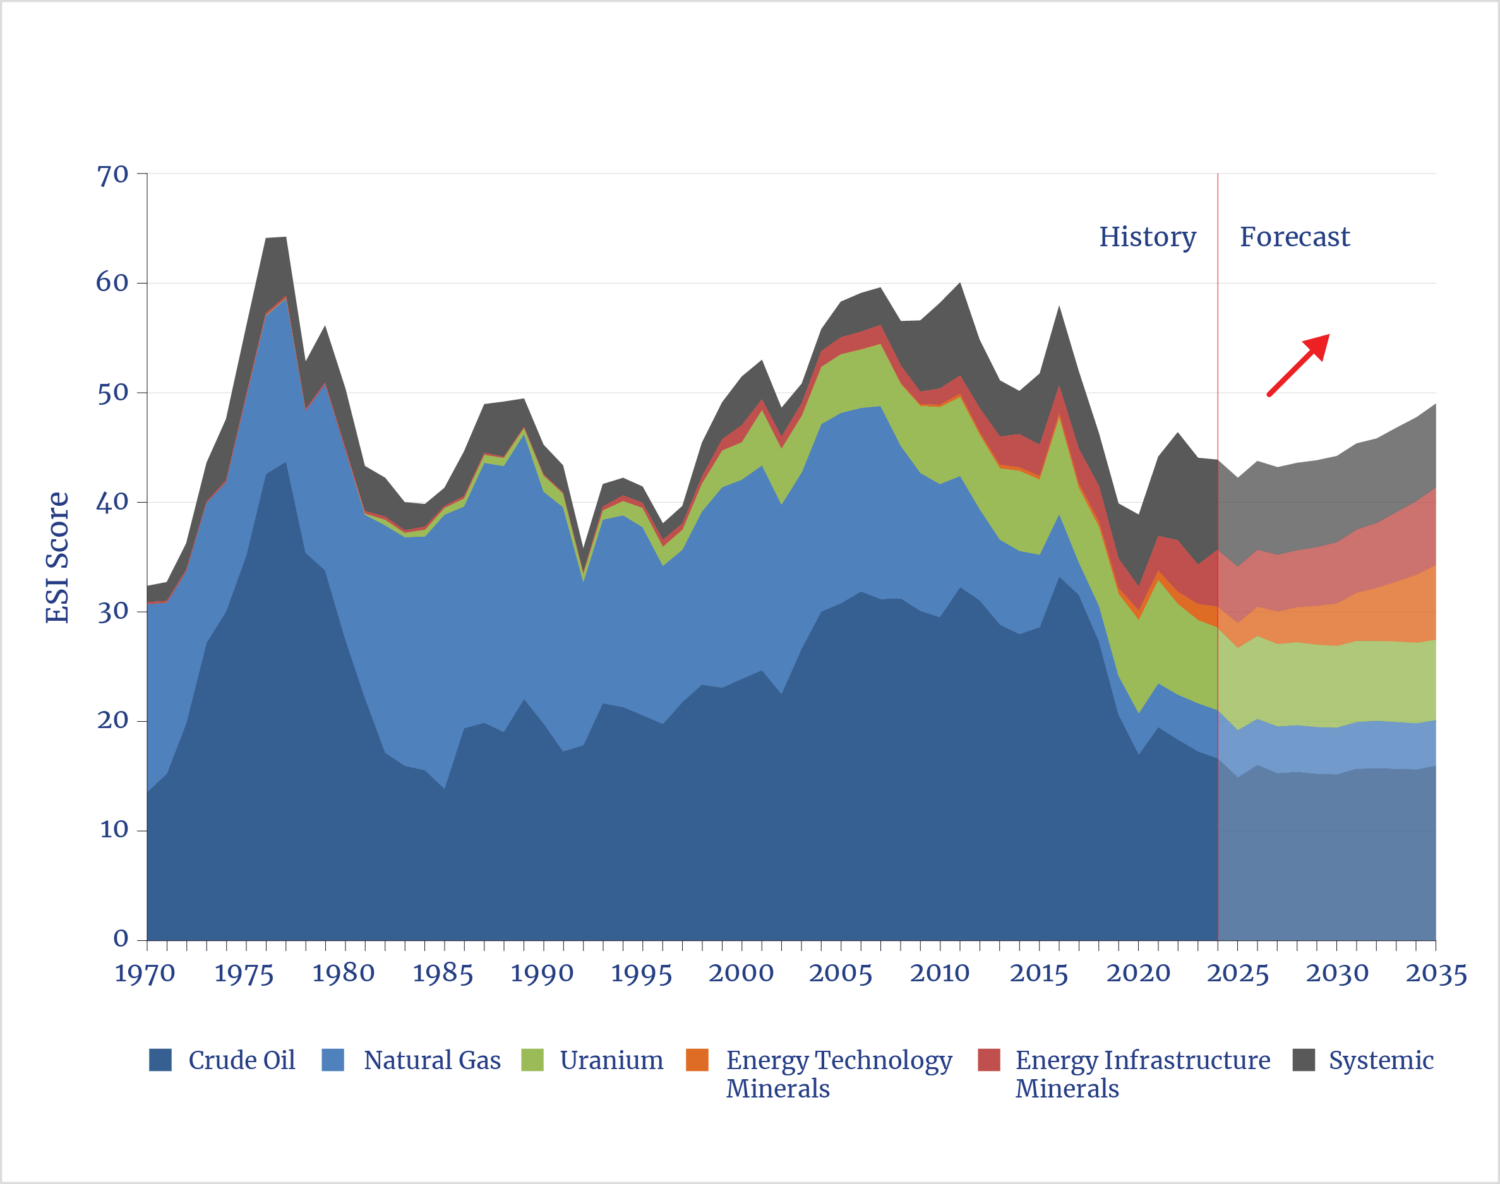
Source: Authors.
Overview
Since the 1973 Arab oil embargo, U.S. energy security has been a perennial geopolitical concern of presidents from both parties. Energy security is an abstract term that can have many meanings. Since the early 1970s, the concept of U.S. energy security has generally revolved around the amount and sources of oil imports as well as the price of gasoline. While still politically potent, these measures no longer suffice to depict—if they ever did—the overall vulnerability of the U.S. energy system to external threats. In this report, the term energy security is used to refer to threats against the domestic energy system that originate outside the United States.
NCEA developed the U.S. Energy Security Index (ESI) as a data-based tool to measure these threats over time. It focuses on physical supplies of oil, natural gas, and minerals used for energy technologies and infrastructure while also encompassing other threats to U.S. energy security. This is the first such comprehensive, integrated security index—with the notable exception of the Global Energy Institute’s Index of U.S. Energy Security Risk series, which was last published by the U.S. Chamber of Commerce in 2020.1 The plan for ESI is to publish annual updates and, in due course, to offer an interactive online feature. ESI’s numerical score reflects the sum of the threats that are affecting imports of fuels and minerals from foreign countries, dangers to energy systems from global market disruptions, and risks from cyberattacks.
ESI is designed to take a snapshot of not only the present but also the future state of the U.S. energy system’s vulnerabilities based on recent forecasts. By examining the evolution of energy security over recent decades, ESI provides context for the current threat level and shows how and why security has shifted over time. To place ESI in a historical context, index scores were calculated to 1970—just before the oil crises of the 1970s that laid bare America’s energy weaknesses and made energy security a perennial political concern. Using U.S. government projections of the evolution of the U.S. energy system, implied changes to ESI were also calculated over the next 10 years. Scoring is based on a composite of individual indicators, and ESI assigns a risk score of 100 to the maximum indicator value over a 50-year reference period.2 In practice, ESI scores tend to range between a low of 30 (very low risk) and a high of 65 (very high risk), though some of the individual indicators can and do exhibit much wider variability. Figure 1 shows the integrated ESI scores from 1970 to 2035.
Figure 1. Energy Security Index
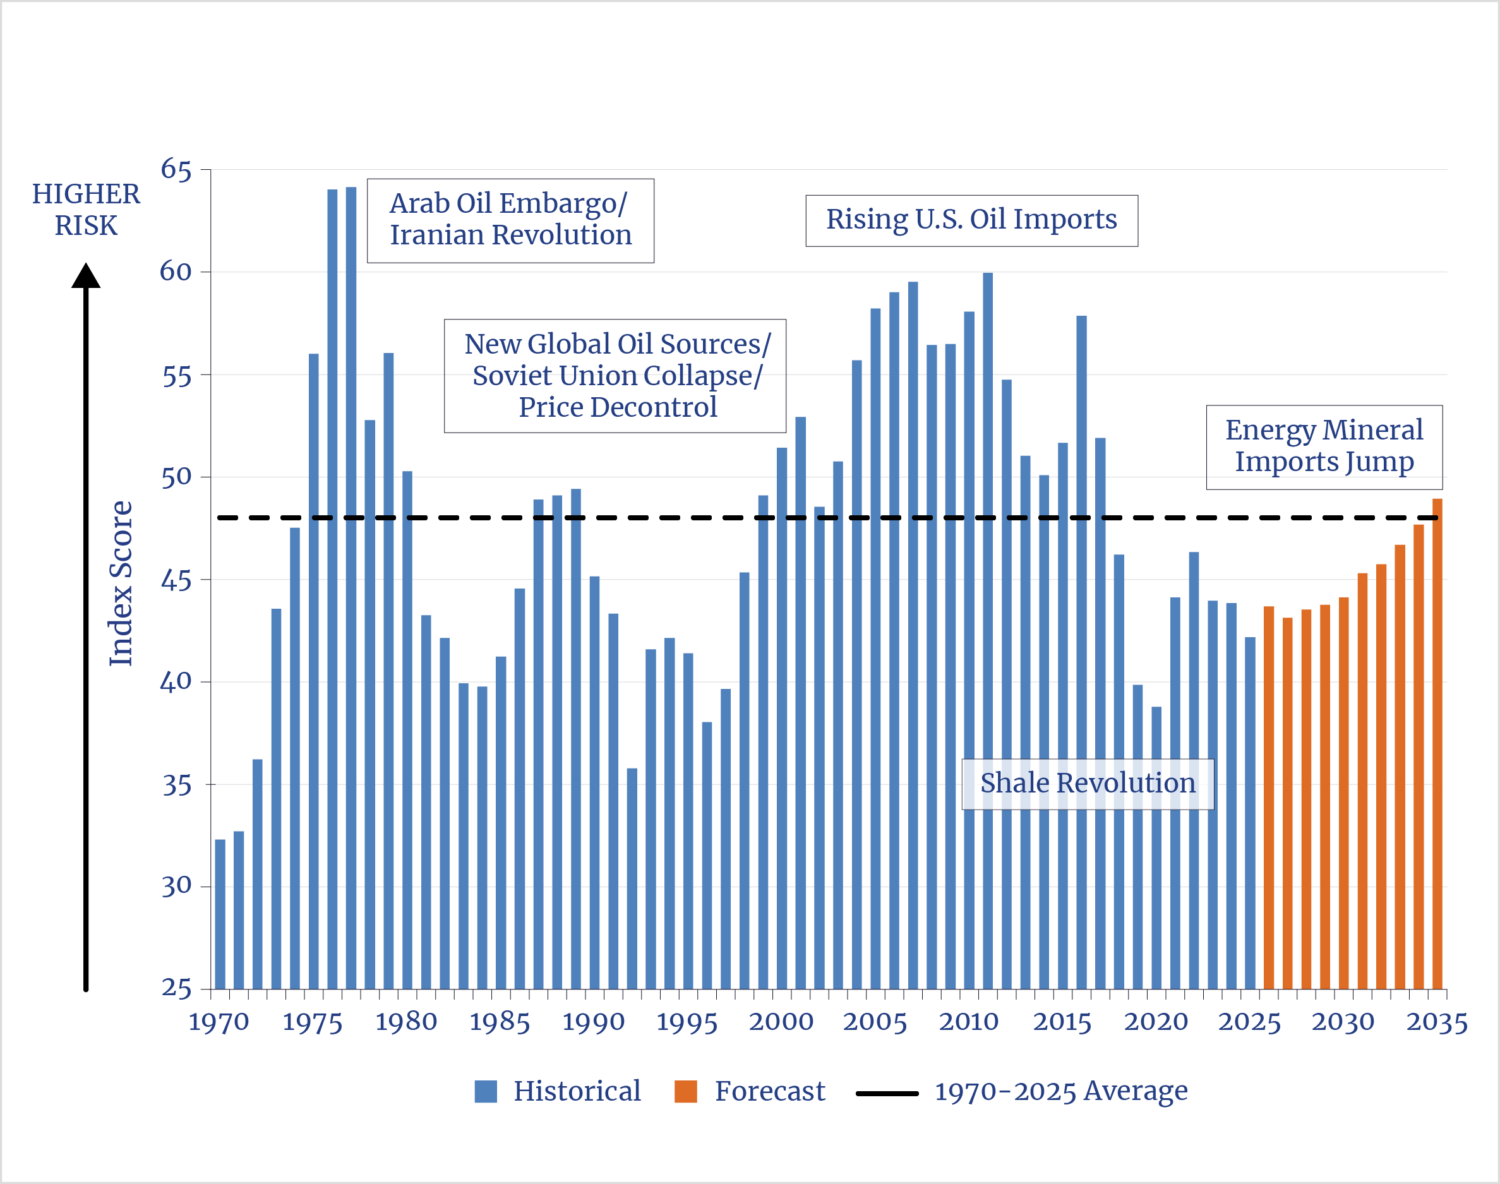
Figure 1 identifies a few of the major events, trends, policies, and technologies that have influenced U.S. energy security and affected ESI scores over this period. (For a brief historical analysis of ESI over the decades since 1970, see ESI Results on page 10.)
The data used to calculate the indicators in ESI are drawn from U.S. and other statistical agencies, such as the U.S. Energy Information Administration (EIA), the U.S. Geological Survey (USGS), and the British Geological Survey (BGS) (see the Technical Appendix for a full list of data sources for each indicator). This inaugural edition of ESI incorporates the most recent data available to assess the key trends that are affecting the geopolitical
How Does ESI Measure Energy Security?
To capture the evolution and state of energy security of the United States in a single index, 18 indicators were organized into six indicator groups that represent the key geopolitical vulnerabilities of the U.S. energy system (see table 1).
Table 1. ESI Indicator Groups and Weightings
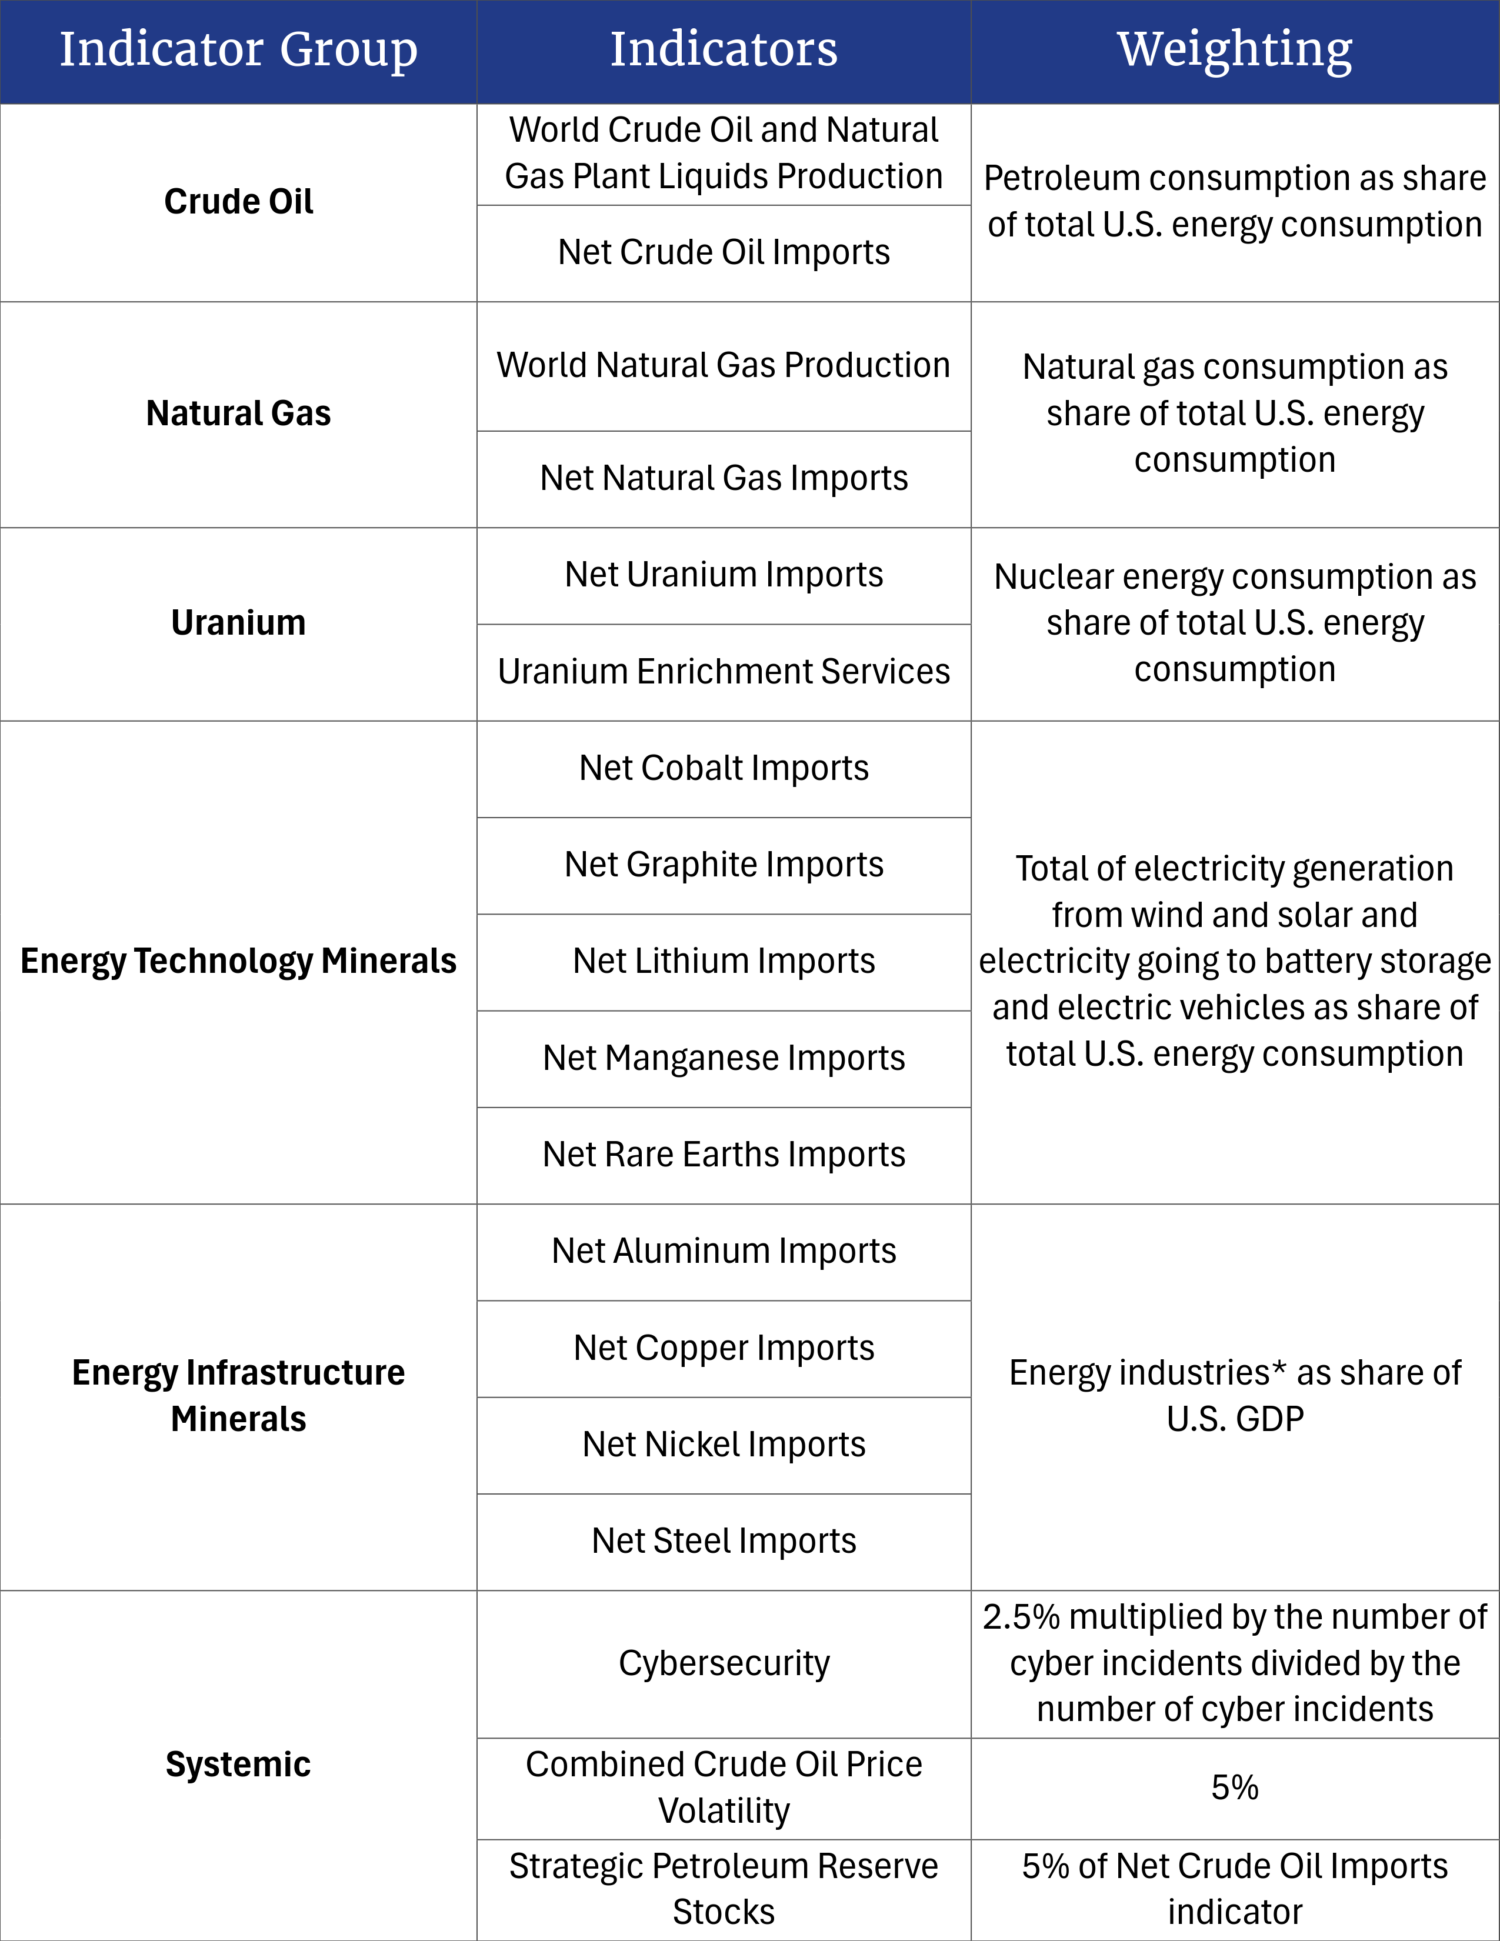
*This includes oil and gas extraction; utilities; electrical equipment, appliances, and components; and petroleum and coal products.
The 18 indicators do not represent a precise formula for describing something as expansive as U.S. energy security. They do, however, provide a reasonably comprehensive picture of the foreign-based risks to the nation’s energy system by including the flow of major hydrocarbon fuels (with the exception of domestically abundant coal); the physical flow of certain selected minerals that are essential for new energy technologies and overall energy infrastructure; and the systemic risks, such as cybersecurity threats to the U.S. energy system.
The 18 indicators are not equally significant to the U.S. energy system. Table 1 shows how each indicator is weighted in calculating its contribution to the integrated ESI score. Overall, secure supplies of hydrocarbon fuels remain more critical to the U.S. energy system than, for example, supplies of manganese and cobalt. To reflect their relative importance, each indicator group is weighted according to its share of primary energy consumption, its contribution to the U.S. energy economy, or its estimated contribution to total risk—factors that can and do change over time. (See the Technical Appendix for more details on how the indicator weightings are apportioned within each group.)
The weights assigned to the indicator groups are dynamic, changing annually based on their shifting importance to the U.S. energy system. For example, as the natural gas fraction of total U.S. energy consumption increases, the weighting of that indicator group increases accordingly. Similarly, the growing use of wind, solar power, and batteries will increase the weighting for the Energy Technology Minerals indicator group, which includes minerals used across the energy sector to build structures and operating equipment. It is weighted by the output of the U.S. energy sector in relation to the broader U.S. economy. Indicators within the Systemic indicator group are weighted individually to reflect their estimated risk contribution in relation to the overall risk level. Crude oil price volatility is included because oil prices are set by global markets; they can be—and have been—manipulated by other nations, with the resultant volatility affecting domestic markets and investment.
ESI weighs and sums the disparate indicators to form a single composite annual index. Looking at ESI by its component indicator groups provides insights into trends within key areas of the U.S. energy system, which can subsequently influence changes in the overall risk index. Figure 2 illustrates the share of the ESI score attributed to each of the six weighted indicator groups over time. It shows that, while vulnerabilities relating to oil and natural gas once dominated ESI, the sources of uranium and energy minerals have assumed a far larger role over the past decade.
Figure 2. Energy Security Index, by Indicator Group
In 2010, the combined score of the Crude Oil and Natural Gas indicator groups accounted for approximately 72% of the total ESI score. Since 2017, the risk score for the Net Natural Gas Imports indicator has been zero; by 2025, the score for both indicator groups accounted for less than half (46%) of the overall ESI score.
The prominence of the Uranium indicator group grew due to Russia’s dominance of the uranium supply chain for conversion and enrichment services and the near-total reliance of the United States on imports to fuel its nuclear reactors. From 2010 to 2025, the Uranium indicator group increased from 12% of the overall ESI score to 18% of the total.
The increase in vulnerability associated with energy technology minerals has been even more pronounced. Over the past decade, demand for these minerals—essential for building both renewable energy technologies and expanding basic energy infrastructure—surged due to several climate-inspired energy policies becoming law. As a result, the total minerals contribution to ESI rose by seven points from 2010 to 2025, offsetting one-third of the security gains in crude oil and natural gas. The minerals share of the overall ESI score rose from 3% to 17% in 2025 and, if current trends hold, could rise to 28% by 2035.
Forecasts from EIA’s Annual Energy Outlook 2025 predict continued growth in demand for renewable energy and battery technologies throughout the decade beginning in 2025.3 This trend is expected to persist in the near-term, despite recent changes in federal policy. The increase is due partly to the backlog in the construction pipeline and partly to the enactment of the One Big Beautiful Bill Act of 2025, which did not eliminate all subsidies but instead reduced many and accelerated their distribution. The anticipated increases in mineral demand, driven by these factors, will cause ESI’s Energy Technology Minerals indicator group to rise through 2035. The supply chains for many of these minerals are concentrated in countries that are either hostile or unfriendly toward the United States or that are politically unstable and inherently vulnerable to internal disruption. For example, most of the projected growth in the global supply of graphite and nickel is expected to be sourced from China and Indonesia, and 45% to 75% of the supply growth for refined copper, lithium, cobalt, and rare earth elements will be sourced from China.4
How Are ESI Scores Calculated?
ESI Scores
Because the indicators use different units and vary greatly in absolute value, the data are normalized into a dimensionless unit that can be combined to produce a single index score. To normalize these values, ESI assigned a score of 100 to the maximum indicator value over a 50-year reference period from 1970 through 2019. The normalized indicator values for each year were then weighted and summed together to produce the index score.
An ESI score of 100 would indicate that all 18 individual indicators simultaneously reached their respective peak of 100 over the 50-year reference period (1970–2019)—an outcome that is extremely unlikely. It is important to note that the reference period’s normalized maximum score of 100 is not a cap; individual index scores after 2019 can exceed 100, as is the case for emerging indicators. A score of zero is the lowest possible score. For example, although the United States is a net exporter of natural gas, the risk score for this indicator group does not fall below zero. Achieving a risk score of zero is difficult, and a scenario in which all indicators reach zero risk is extraordinarily improbable.
Calculating Indicators
The development of the indicators required balancing conceptual intent with practical measurability. For example, while there is a risk attached to importing crude oil from the Organization of Petroleum Exporting Countries (OPEC), the data on the volumes of those imports that have already arrived in the United States do not reflect that hazard. To address this, proxies for reliability and supply concentration are used to represent international market risks and U.S. import risks.
Political Freedom
To assess the relative risk and security of global energy and mineral supplies, two primary elements of supply security were used: reliability and market concentration. Reliability of supplies was measured using scores of political and civil liberties that were developed and published by Freedom House in its annual Freedom in the World series.5 The diversity of supply is measured using the Herfindahl-Hirschman Index (HHI), a concept used in antitrust analysis. This diversity component recognizes that greater diversity of supplies creates greater competition and less volatility and, hence, less risk.6
The political freedom of supplying nations and their diversity are critical aspects of energy security. To assess the relative security risk associated with global energy and mineral supplies, ESI considers not only the indicators of political freedom in supplier nations but also the measures of supply diversity that reach the global market. Using domestic political freedom as a measure of geopolitical risk assumes that free countries follow the rule of law, making them more likely to be reliable suppliers and trading partners with the United States. In contrast, less free countries are more likely to use exports as a geopolitical weapon, manipulate commodity markets, or form or join a cartel.
As a measure of political freedom, ESI used the annual Freedom House ratings. Each energy- or mineral-producing country was assigned a Freedom House score that ranges from 1 (high freedom) to 7 (low freedom). Figure 3 shows the share of the global supply of crude oil, natural gas, uranium, and nine minerals concentrated in countries that Freedom House classified as Free, Partly Free, or Not Free in 2025.7
Figure 3. Share of Mineral Production in Free, Partly Free, and Not Free Countries: 2025
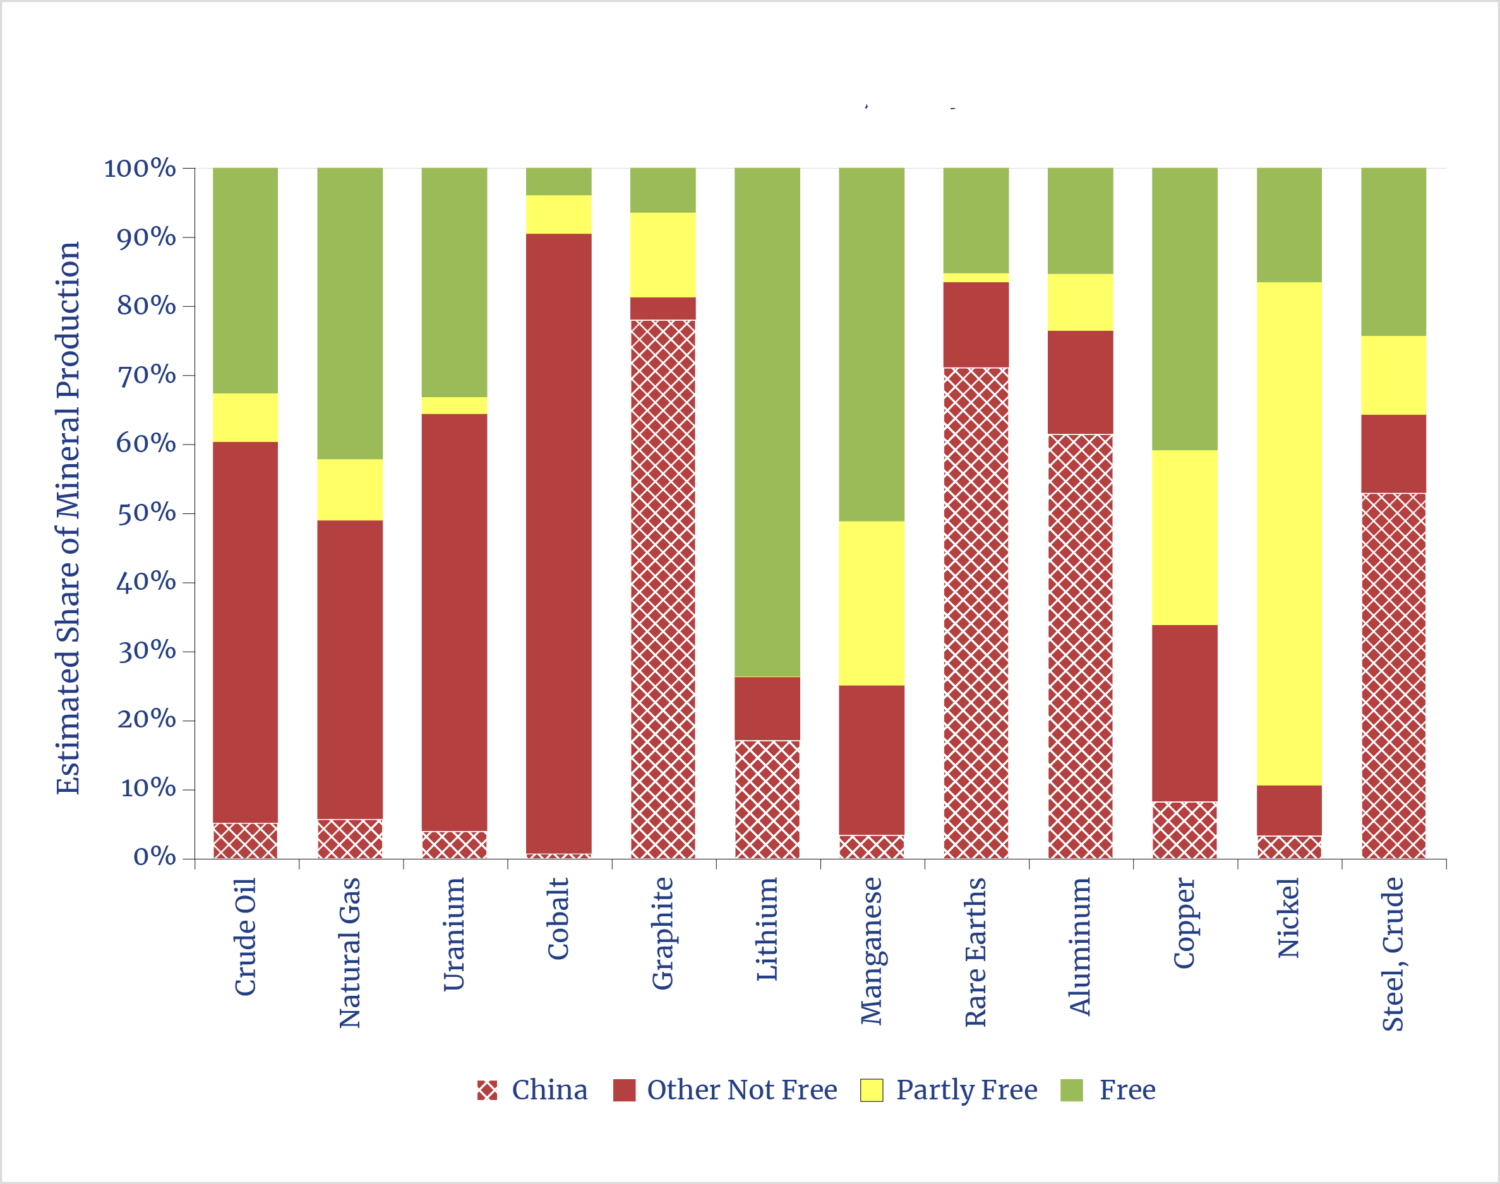
Well over half of all crude oil and natural gas production occurs in countries labeled as Not Free or Partly Free. The United States, however, is the largest global producer of both fuels and a net exporter of natural gas, which limits its exposure to risks in these fuel markets.
Production of uranium and energy minerals also occurs largely in nations categorized as Not Free and Partly Free. In only two cases—lithium and manganese—does more than half of global output occur in countries designated as Free. Import risks for these minerals have increased rapidly, and most forecasts suggest rising security risks for these minerals.
Diversity of Supply
Including a measure of supplier diversity in the global market recognizes that a broader range of suppliers indicates greater competition, reduces price volatility, and consequently lowers risk—all of which are important to energy security. The supply variety for any given global commodity market is quantified using the HHI, which is calculated by squaring the global market share (percentage) of each country’s production and summing the squares across all suppliers. The higher the HHI score, the more concentrated the market is in the hands of fewer suppliers. A maximum HHI score of 10,000 means that a market is dominated by a single supplier.
Other risks are associated with the transport of fuels and materials to global markets. Large volumes of crude oil must transit key maritime chokepoints, such as the Strait of Hormuz, the Suez Canal, the Strait of Malacca, and Bab el Mandeb. The most vulnerable of these—from an energy perspective—is the Strait of Hormuz, through which roughly 20 million barrels (about 20% of global crude oil supplies) pass each day. To account, at least in part, for this vulnerability, the HHI calculations for oil and natural gas include the combined market share of seven Persian Gulf States (Bahrain, Iran, Iraq, Kuwait, Qatar, Saudi Arabia, and the United Arab Emirates), most of whose production transits the Strait of Hormuz.
World production indicators (indicators 1 and 3; see table 1) are the product of the global production–weighted Freedom House score and the HHI score, the result of which is a risk value to an average unit of that fuel or mineral produced worldwide.
Imports
Import indicators (indicators 2, 4, 5, and 7–15; see table 1) take the average risk score for each unit of global production and multiply it by the net import share of U.S. demand for that fuel or mineral. If the U.S. is a net exporter of a commodity (e.g., natural gas), the import risk is assigned a value of zero. Conversely, high levels of net imports do not necessarily translate into high risk levels if the global market for an imported product is served by reliable and diverse suppliers.
Systemic Features
Systemic indicators (indicators 16–18; see table 1) are designed to make ESI responsive to dynamic threats to the U.S. energy system that do not directly relate to the production or import of any particular commodity. The volatility of crude oil prices serves as a proxy for instability in global oil markets and risks arising from hostilities, political upheavals, natural disasters, and other occurrences worldwide that affect energy production. The Strategic Petroleum Reserve (SPR) crude oil stocks measure U.S. preparedness for handling disruptions in global crude oil supplies.
The Cybersecurity indicator measures the risks posed by cyberattacks on U.S. energy installations that originate from both malicious domestic actors and foreign governments unfriendly to the United States.
Coal supplies were not considered in ESI. The United States historically has produced large volumes of both thermal and metallurgical coal and has long been self-sufficient in both. The risks surrounding coal are not geopolitical but arise from domestic political and regulatory factors. (It is important to note that coal’s role in grid stability, reliability, and affordable electricity will be a factor in forthcoming tools within the Index of Leading Energy Indicators project.)
Forecasts
ESI forecasts are based on projections from the EIA’s Annual Energy Outlook (AEO) data.8 For instances in which AEO projections are unavailable—such as for projected mineral production and imports or future Freedom House scores—a neutral assumption is applied, and the most recent year of available data is extended over the forecast period.
ESI Results
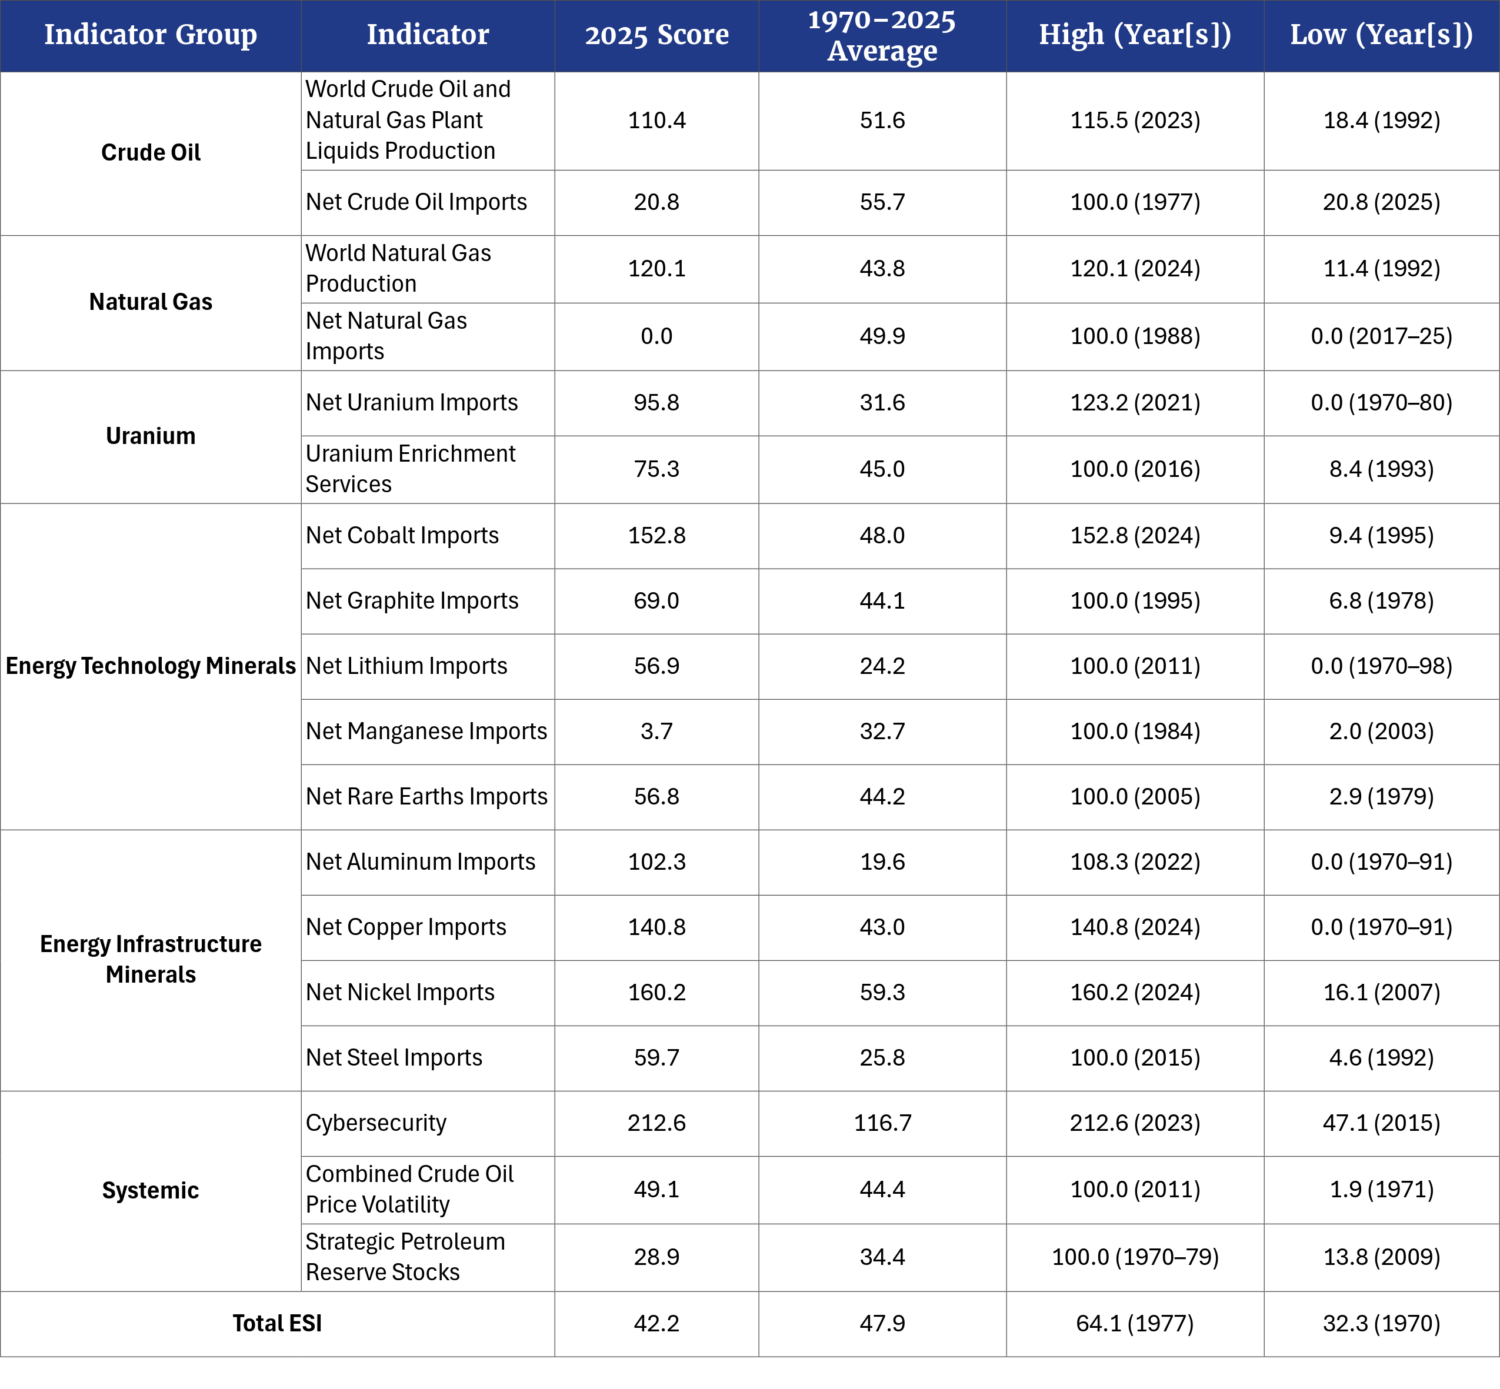
Looking at the period from 1970 to 2025, total ESI scores fluctuate between a low of 32.3 in 1970—three years prior to the Arab oil embargo—and a high of 64.1 in 1977 during its aftermath. Over the whole period, the individual indicators rose and fell independently. Table 2 presents the historical data, as well as the highs and lows for each indicator from 1970 to 2025.
Historically low scores are concentrated in the 1990s, during which time eight of the 18 indicators reached their lowest score. It is not surprising, then, that some of the lowest total ESI scores also occurred during that decade.
In contrast, eight of the 18 indicators recorded their highest historical scores during the period from 2020 to 2025. These indicators tend to be those that measure emerging risks connected to energy minerals and cyberattacks.
Table 2. ESI Indicator Scores for 2025 and High, Low, and Average Scores for 1970–2025
1970s
The period began with ESI shooting from a record low of 32.3 in 1970 to a record high of 64.1 in 1977. This increase reflected growing import dependence and price volatility after Arab oil producers cut supplies to the world market during the 1973 Arab oil embargo. By the time that supplies were restored in the spring of 1974, the price of a barrel of crude oil had surged from about $3 to $12—a fourfold increase. A second, smaller bump in ESI occurred later in the decade, when Iranian production slowed to a halt following the 1979 Iranian Revolution and the subsequent hostage crisis.
The 1970s were marked by exceedingly high crude oil price volatility. At that time, the United States lacked an emergency stockpile of crude oil. This was remedied by the enactment of the Energy Policy and Conservation Act of 1975, which established the SPR.
1980s
ESI began to decline in the early 1980s. The election of President Ronald Reagan sparked a reduction in federal regulations begun under President Jimmy Carter along with a greater reliance on free markets, both of which benefited energy producers. Oil price decontrol, a more cooperative OPEC, and increased non-OPEC production—including from Alaska’s North Slope and the North Sea—also helped to enhance the reliability and diversity of crude oil supplies.
At the same time, global oil demand declined slightly over four years of the decade. The growing emergency oil stockpile—the SPR—and the replacement of oil-fired electricity generation with coal and nuclear capacity in the power sector further mitigated oil-related risks. By the latter half of the 1980s, rising global risks to natural gas production and increasing U.S. imports contributed to an escalation in ESI. These factors accounted for the upward trend in overall risk after 1985.
1990s
The collapse of the Soviet Union in 1991 contributed to an increase in the reliability and diversity of global oil and natural gas supplies. Despite Iraq’s invasion of Kuwait in 1990 and the subsequent military response in Operation Desert Storm, ESI trended downward as the 1990s began. From 1990 to 1992, the ESI score dropped by 9.4 points to 35.8—well below the average value over the 55 years that were analyzed. Although risk scores increased from that point, they remained relatively low throughout the decade, with an average deviation of six points below the historical mean.
2000s
The 2000s brought a return to rising risk scores that were driven by growing U.S. reliance on fuel imports as well as increasing concentration of fuel production in countries with limited political freedom and often open hostility toward the United States. The decade was also a period of high crude oil price volatility. By 2007, the ESI risk score had risen to 59.5—its highest value since the tumultuous 1970s.
The end of the 2000s, however, marked the beginning of a development that would have profound consequences for the geopolitical security of the U.S. energy system: the shale revolution. The application of enhanced seismic imaging, horizontal drilling, and hydraulic fracturing unlocked significant amounts of oil and natural gas from geological strata in numerous regions of the United States, including resource-bearing shale identified by the U.S. Geological Survey a century earlier. The impact on world markets has been remarkable. Whereas OPEC controlled about 55% of the world’s crude oil production on the eve of the 1973 oil embargo, it controls about one-third in 2026.9
2010s
ESI clearly demonstrates that the shale revolution had a positive impact in reducing geopolitical oil and gas supply risks during the 2010s. Over this decade, however, the risks related to uranium and mineral imports began to rise in significance. In 2011, the ESI risk score was 60.0—a level not exceeded since the 1970s—before rising domestic production of oil and natural gas in the early 2010s sent risk scores plummeting. Today, the United States is the largest global producer of oil and natural gas, which has helped to reduce import risks for these fuels. The value of U.S. energy and mineral production is important not just for the country’s energy security, but it also benefits security worldwide by increasing the reliability and the diversity of global energy and mineral supplies for the U.S. and its friends and allies.
2020s
Estimates indicate that for 2024, the ESI score stood at 42.2—5.8 points lower than the historical average. From 2020 to 2025, ESI estimates that the U.S. geopolitical energy risk increased nearly 3.4 points. This jump was propelled by rising import supply risks for minerals such as nickel, cobalt, copper, and aluminum, which more than offset lower crude oil import risks related to a recovery in domestic production after the COVID-19 pandemic. Changes in SPR stock levels also contributed to higher risk scores during the early 2020s, while the systemic risk to the U.S. energy system posed by cybersecurity breaches has risen sharply since 2020. According to the Electricity Information Sharing and Analysis Center, these attacks continue to grow in sophistication.10
Conclusion
To return to the central question: Is America’s overall energy security getting better or worse? As ESI shows, the indicator fluctuates over time, with some underlying components strengthening and others weakening. Ultimately, U.S. energy risk exposure is projected to rise over the next decade, assuming that current trends persist.
Although the 2025 ESI score of 42.2 was about six points higher than average, it remained about 22 points lower than the worst risk score of 1977, which indicates notable improvement.
Disruptions to the supply of oil have been the largest threat to U.S. energy security in the past. Risks related to oil and natural gas have declined rapidly since the late 2000s. Indeed, the shale revolution has been the single most consequential—and beneficial—factor in lowering the nation’s geopolitical energy vulnerabilities since the decontrol of oil prices in the 1980s. The tremendous increase in domestic oil and natural gas production since about 2008 has lessened the import risks associated with those fuels considerably—and, in the case of natural gas, it has eliminated them entirely. The geopolitical advantages of increased domestic production are potentially enormous. Growing exports of U.S. liquefied natural gas to Europe have lessened the Russian stranglehold on European energy. Similarly, rapid growth in crude oil production in the same period allowed the United States to impose sanctions on oil exports from Iran, Russia, and Venezuela, with no perceptible impact on oil prices. Greater domestic output has given the United States more diplomatic flexibility.
Not all of the news is positive, however. Clear areas of concern have emerged over the past decade. Uranium supply risks have increased, driven by Russia’s dominance of the supply chain for uranium conversion and enrichment services as well as the near-total reliance of the United States on imports for nuclear fuel. In December 2023, provisions of the Nuclear Fuel Security Act were enacted as part of the National Defense Authorization Act. These provisions aim to build a domestic nuclear fuel supply chain by revitalizing U.S. enrichment and conversion capabilities. To further stimulate U.S. investment, the Prohibiting Russian Uranium Imports Act—which bans U.S. imports of Russian uranium—was signed into law in May 2024. The United States does not lack uranium resources, and the emergence of a competitive domestic fuel cycle industry could reduce future uranium supply risks in much the same way that the shale revolution lowered risks for oil and natural gas supplies.
New risks related to energy minerals have grown alongside the increasing reliance on mineral use and imports. There has been a surge in risks associated with the demand for minerals used to fabricate solar, wind, and battery hardware, the supply chains of which are highly concentrated and controlled by countries unfriendly to the United States. Similarly, there has been an increase in risks from minerals needed to build energy infrastructure. The rising geopolitical risks surrounding energy mineral supplies are offsetting the reductions in risks associated with oil and natural gas supplies.
Mitigating rising mineral vulnerability will require expanded domestic production and ore refining capacity, as well as increased friend-shoring of minerals from allied countries. Further federal action is under way to diversify mineral supply chains, including diplomatic engagement through the Minerals Security Partnership.11 The U.S. engages with 29 friendly, minerals-rich countries—those that have a free trade or critical minerals agreements with the U.S., such as Australia, Canada, Mexico, and Chile. This factor can be of critical relevance, depending upon how aggressively policymakers encourage or limit the greater use of mineral-dependent renewable energy technologies instead of conventional fuels.
Increasing domestic mineral production remains challenging. Opening new mines in the United States currently takes an unreasonably long time. While Congress and the executive branch are pursuing reform, it is unclear how quickly or effectively these efforts will address the issue.
In their recent NCEA report, Energy Delusions: Critical Minerals Forecasts, Peter Bryant and Satish Rao stated:
Adding far more mineral-based energy systems to complement the existing fossil fuel–intensive energy system creates some nontrivial, even massive risks. Those risks all entail the supply of certain key minerals needed to meet demands. This is true across a range of minerals, including copper, lithium, nickel, and REEs [rare earth elements]. The geopolitical considerations for energy minerals constitute a “minefield” as challenging as—and, in many cases, more challenging than—oil and gas markets.12
At the same time, demand for aluminum, copper, and steel—minerals that are essential for all classes of energy technologies—is expected to grow rapidly, regardless of changes in the energy mix. Securing supplies of these minerals will remain a persistent challenge.
Finally, protecting the U.S. energy infrastructure from cyberattacks will continue to be another area of perennial concern. Under the Federal Energy Regulatory Commission’s direction, the North American Electric Reliability Corporation has issued standards for utilities to protect critical cyber assets. Bipartisan efforts in Congress are also under way to address cyber threats to energy infrastructure, including oil and gas pipeline networks.
For decades, the concept of American energy security has evolved (and, from a political perspective, understandably so) around where the U.S. gets its oil and the price of gas at the pump. The goal in producing ESI was to reveal through data the many different facets of energy security—some of which, such as cybersecurity, were not even contemplated a few decades ago.
An old adage claims that what gets measured gets managed. Ideally, ESI will become an impartial tool that offers policymakers a means to monitor policy decisions such as the array of nations that the United States is dependent on for energy fuels and minerals. Financial markets and educators can use ESI to gain insight into U.S. energy vulnerabilities and make the nation’s energy systems more secure.
ESI is not the last word on energy security. It remains a work in progress. Ideas on how ESI can be improved and refined are most welcome.
Notes
- Global Energy Institute, Index of U.S. Energy Security Risk: Assessing America’s Vulnerabilities in a Global Energy Market (U.S. Chamber of Commerce, 2020).
- The reference period extends from 1970 through 2019.
- EIA (U.S. Energy Information Administration), Annual Energy Outlook 2025 (EIA, 2025).
- IEA (International Energy Agency), World Energy Outlook 2024 (IEA, 2024).
- See, for example, Yana Gorokhovskaia and Cathryn Grothe, Freedom in the World 2025: The Uphill Battle to Safeguard Rights (Freedom House, 2025).
- “Herfindahl-Hirschman Index,” Antitrust Division, U.S. Department of Justice, updated January 17, 2024. HHI is calculated by taking the market share percentage of each country’s production, squaring that share, and summing those squares across all suppliers. A market with a single supplier would have an HHI score of 10,000. The greater the number of producers, the lower the HHI score.
- “Freedom in the World Research Methodology,” Freedom House, accessed February 6, 2026. In 2020, Freedom House changed the way it scores political and civil liberties. ESI uses the pre-2020 1–7 scoring system, which Freedom House still provides. Under this 1–7 rating scheme, countries designated as Free have scores from 1.0 to 2.5, Partly Free from 3.0 to 5.0, and Not Free from 5.5 to 7.0.
- See “Publications & Tables,” EIA, https://www.eia.gov/outlooks/aeo/data/browser.
- “International Data,” EIA, accessed January 29, 2026.
- Holden Mann, “ERO Says 2024 Cyber Incidents Showed Increased ‘Sophistication’,” RTO Insider, May 24, 2025.
- “Minerals Security Partnership,” U.S. Department of State, accessed January 8, 2026.
- Peter Bryant and Satish Rao, Energy Delusions: Critical Minerals Forecasts (National Center for Energy Analytics, 2025).