U.S. Energy Security Index
Using 18 statistical risk indicators integrated into a single metric, the ESI plots the history of America’s energy security from 1970 to 2024 and provides a glimpse into the future to 2035.
By Iddo Wernick and Stephen D. Eule
U.S. Energy Security Index
Higher score = higher risk · 1970–2035
The reduction in risks in traditional domains—oil and natural gas—have been more than offset by rising vulnerabilities associated with alternative energy technologies.
01
Risk is rising
From 2020 to 2024, America’s geopolitical energy risk increased nearly 6 points, driven by mineral import dependencies and cybersecurity threats.
02
Shale gains eroding
The shale revolution’s historic security gains are being reversed by rising vulnerabilities in uranium, cobalt, lithium, and rare earth supply chains.
03
New risk profile
From 2020 to 2024, America’s geopolitical energy risk increased nearly 6 points, driven by mineral import dependencies and cybersecurity threats.
04
18 indicators, one score
The ESI integrates risk across six categories—oil, natural gas, uranium, energy minerals, infrastructure minerals, and systems—into a single metric.
Preface
With this report, the National Center for Energy Analytics launches its new Energy Security Index (ESI) to help answer the question: Is our nation’s energy security getting better or worse?
Indices are commonly used to provide a proxy for measuring the state and direction of change for complex systems influenced by many factors. The GDP offers a single number widely used to gauge economic activity. We believe it is possible to create a similarly useful metric for the overall state of national energy security.
The NCEA’s Energy Security Index is the first such index that can serve as both a gauge of the current risk level in historical context, and also as a leading indicator for the direction of change. All inputs, data sources, assumptions, and weightings are transparently available. We invite commentary and refinements and will be updating the ESI annually.
— Mark P. Mills, NCEA Executive Director
Executive Summary
Energy security has been a critical feature of geopolitics since the dawn of the modern era. The 1973 Arab Oil Embargo re-ignited energy security debates and catalyzed far-reaching Congressional policies. Political anxieties did not abate until the shale revolution of the early 2000s brought the United States back to a position as a net energy exporter for the first time in 70 years. Now the cycle continues—energy security has returned as a concern in the wake of the Russian invasion of Ukraine and the rise of China’s energy minerals dominance.
The ESI uses 18 statistical risk indicators integrated into a single overall metric, plotting the history from 1970 to 2024 and providing a glimpse into the future to 2035 based on federal agency forecasts.
U.S. Energy Security Index

The reduction in risks in traditional domains—oil and natural gas—have been more than offset by rising vulnerabilities associated with alternative energy technologies.
Overview
Since the Arab Oil Embargo of 1973, the energy security of the United States has been a perennial geopolitical concern. Since the early 1970s, the concept generally revolved around the amount and sources of oil imports and the price of gasoline. While still politically potent, such measures no longer suffice for depicting the overall vulnerability of the U.S. energy system to external threats.
NCEA developed its Energy Security Index as a data-based tool to measure these threats over time. It focuses on physical supplies of oil, natural gas, and minerals used for energy technologies and infrastructure. The ESI’s numerical score is the sum of the threats affecting imports of fuels and minerals from foreign countries, as well as the vulnerability of energy systems to disruptions in global markets and threats from cyber attacks.
Figure 3. Freedom House Political Freedom Scores
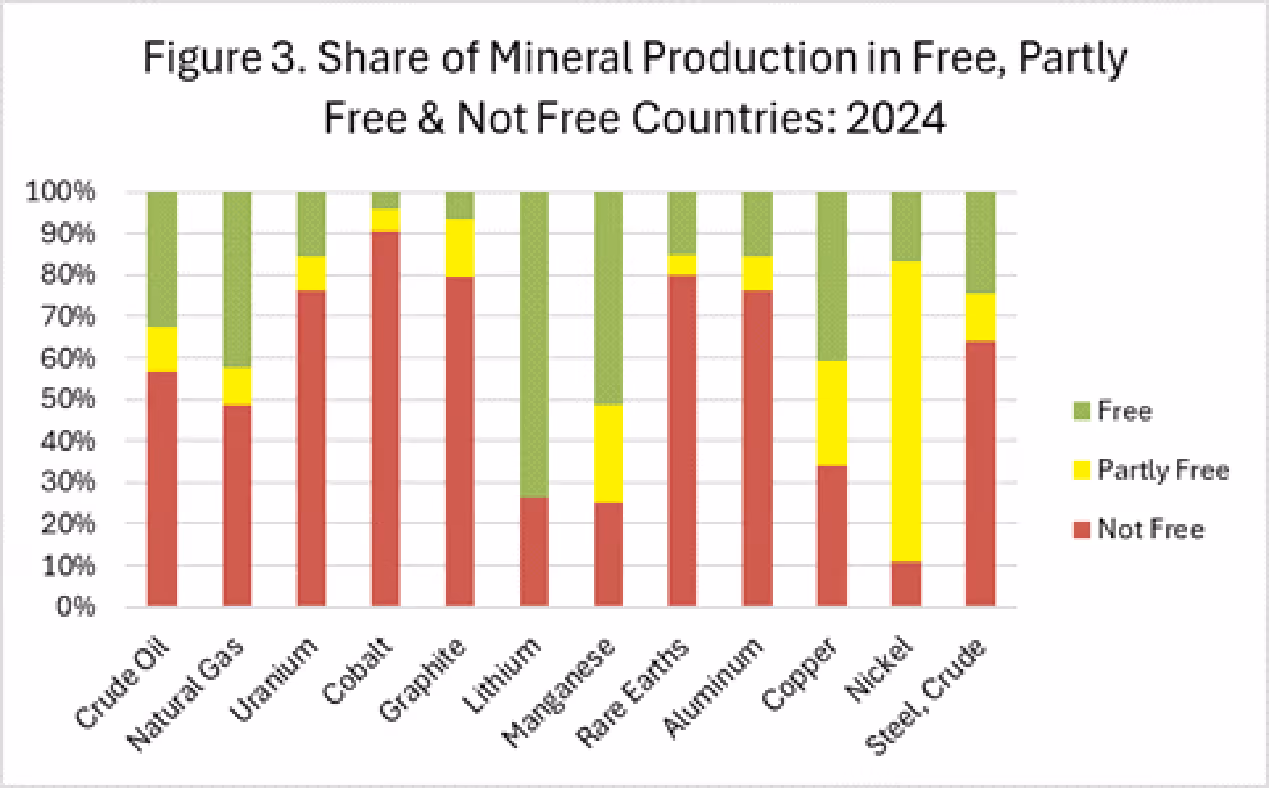
Political freedom scores for nations supplying critical energy commodities to the United States, weighted by import share.
How the ESI Works
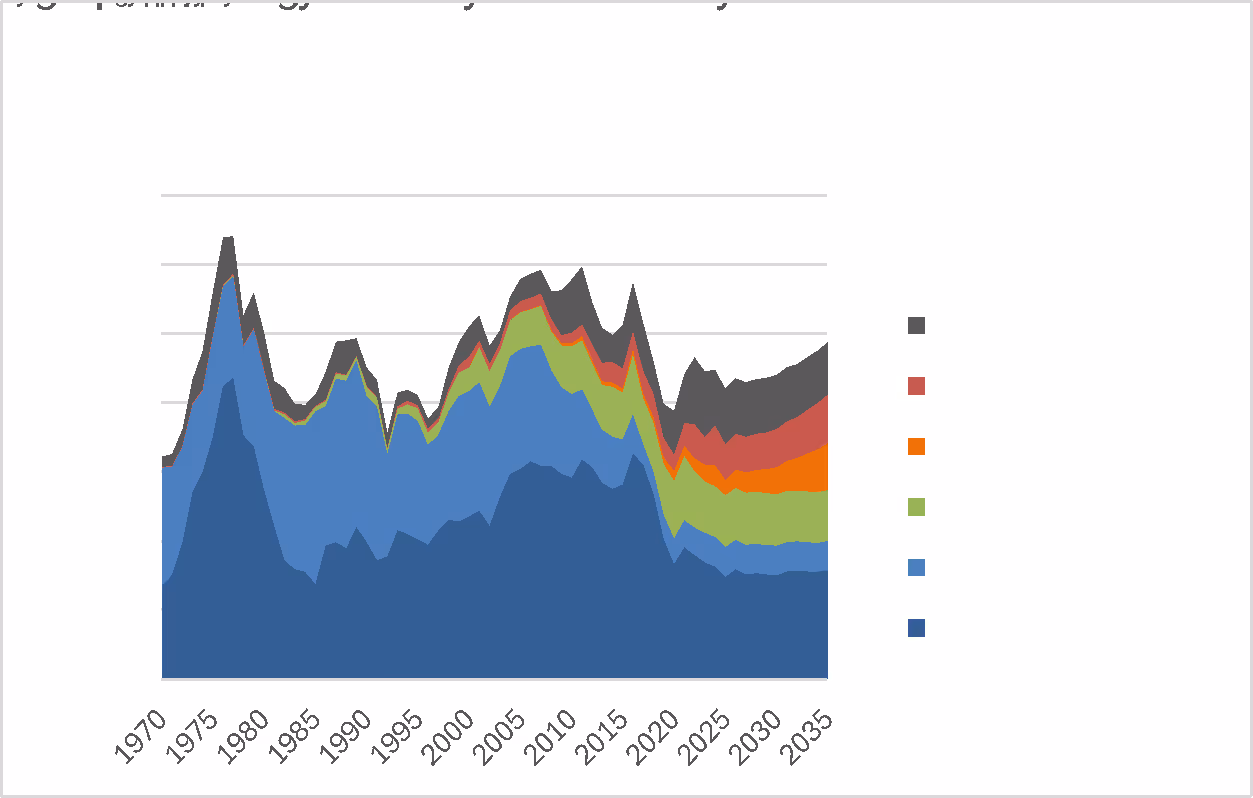
The ESI is based on data for 18 different risk indicators grouped into six categories: crude oil, natural gas, uranium, energy technology minerals, energy infrastructure minerals, and systemic factors including cyber security, oil price volatility, and the Strategic Petroleum Reserve.
The six indicator groups are weighted and combined to form a single overall measure of U.S. energy security. Import indicators use a weighted average risk score based on the political freedom of supplier countries and the degree of import concentration.
ESI Indicator Category Weights
Share of the ESI score contributed by each of the six indicator categories over time.
Results
Oil and Natural Gas Risks Are Getting Better
The shale revolution’s impact on U.S. energy security was arguably the single most consequential reduction in geopolitical energy vulnerabilities in decades. Rapidly growing crude oil production since 2008 allowed the United States to sanction exports from Iran, Russia, and Venezuela with no perceptible move in oil prices.
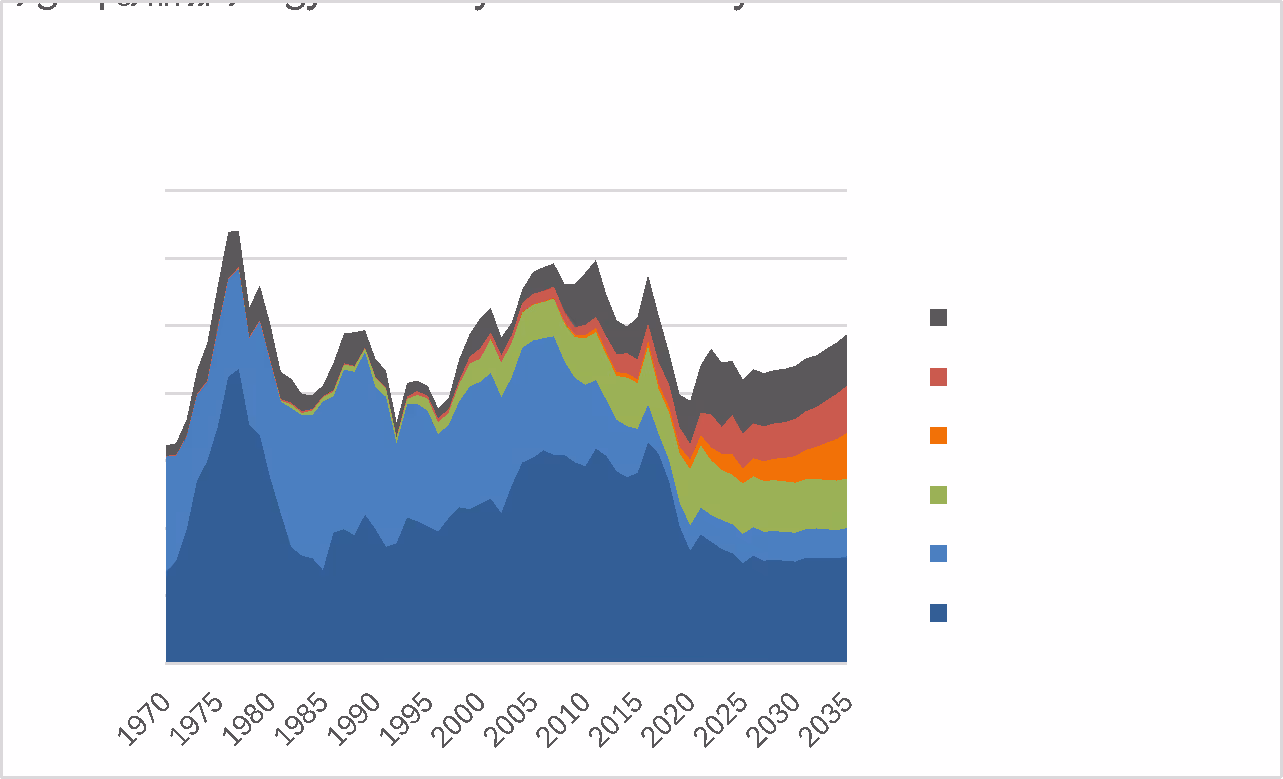
Minerals Risks Are Getting Worse
Risks associated with the demand for energy technology minerals—cobalt, graphite, lithium, manganese, and rare earths—have surged. Many of these minerals are sourced from countries under authoritarian control. China’s dominance of mineral processing represents a concentrated supply chain vulnerability.
Systemic Risks Will Persist
Cyber-attacks against energy infrastructures represent a growing threat. Combined with crude oil price volatility and lower SPR inventory levels, systemic risks have effectively replaced earlier vulnerabilities.
Category-Level Risk Trends
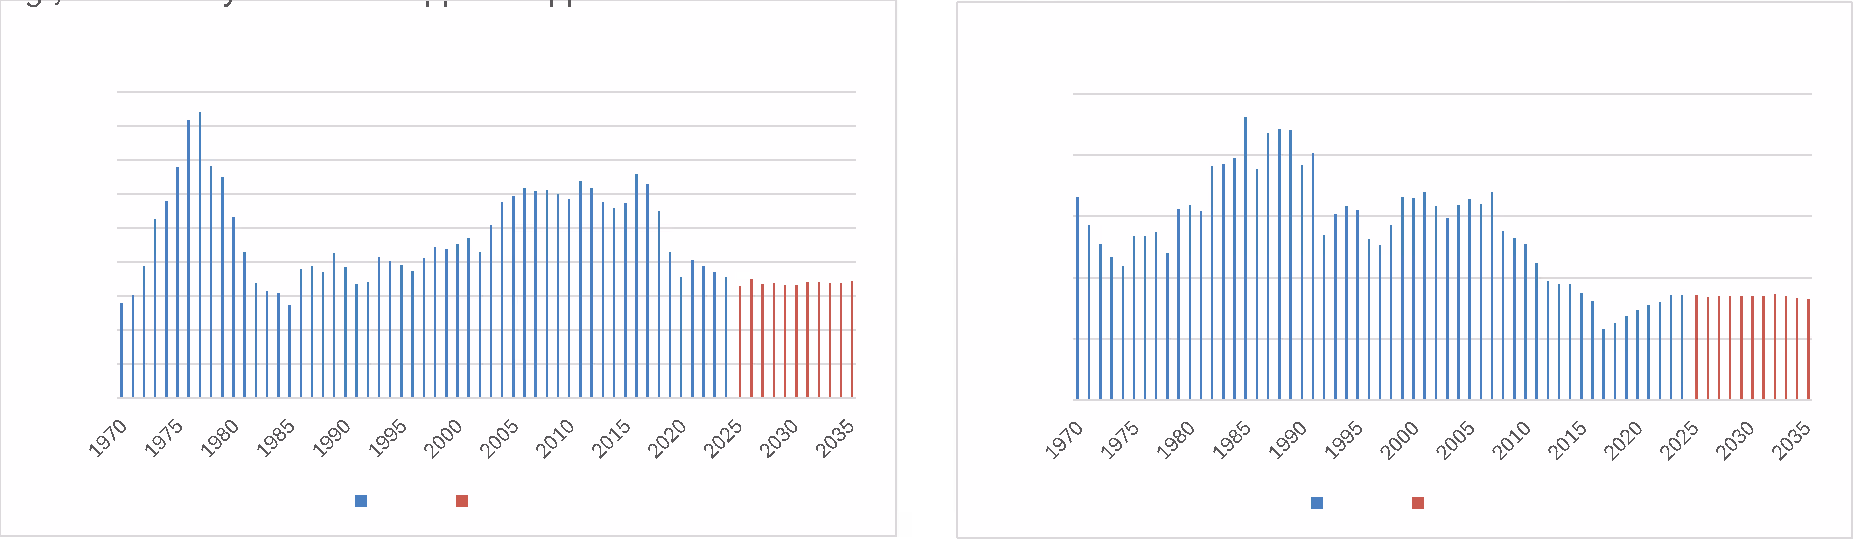
Individual risk trends by category showing the divergence between declining oil/gas risks and rising mineral and systemic risks.
Historical Context
1970s
The 1973 Arab Oil Embargo triggered the worst U.S. energy security crisis of the post-war era, pushing the ESI to its all-time high of 64.1 in 1977. Congress responded with sweeping legislation including the Energy Policy and Conservation Act, creation of the Strategic Petroleum Reserve, and fuel economy standards.
1980s–1990s
The breakup of OPEC pricing discipline and the growth of non-OPEC production steadily reduced oil-related security risks. The collapse of the Soviet Union opened new supply sources and reduced geopolitical tensions around energy.
2000s–2010s
The shale revolution, beginning around 2008, transformed the U.S. energy landscape. Domestic oil and gas production surged, net imports fell dramatically, and the U.S. became a net natural gas exporter.
2020s
For 2025, the ESI score stands at 44.9—about 3 points below the historical average. From 2020 to 2024, risk increased nearly 6 points, propelled by rising import supply risks for minerals and sharply rising cybersecurity breaches.
Conclusion
Is America’s overall energy security getting better or worse? The answer is nuanced. Some underlying components are getting better while others trend worse. But the bottom line is that U.S. energy risk exposure is rising over the coming decade based on current trends—if those trends continue.
The tremendous increase in domestic oil and natural gas production has lessened import risks considerably. But uranium supply risks have increased due to Russia’s dominance of the supply chain, and the surge in demand for energy minerals has created new vulnerabilities that have replaced the earlier oil-centric risks.
Explore the interactive dashboard
Dive into the data behind the ESI. Explore individual indicators, compare categories, and see where current policies are headed.