The Energy Impacts of Capturing CO2 from the Air
-3.png)
One of the newest and most heavily subsidized approaches to atmospheric carbon dioxide (CO2) reduction is direct air capture (DAC).
Listen
The Issue
One of the newest and most heavily subsidized approaches to atmospheric carbon dioxide (CO2) reduction is direct air capture (DAC). DAC systems are often described as giant vacuum cleaners; these systems extract CO2 directly from ambient air using chemical processes that pull air over sorbent materials—substances used to collect liquids or gases. The captured CO2 is then compressed and either transported for permanent underground storage or used elsewhere (for example, in enhanced oil recovery.
Several dozen DAC systems are in operation today, primarily in Europe, but most are small demonstration projects. One exception is Occidental Petroleum’s Stratos Plant, located in the Permian Basin of Texas. Once fully operational, it will be capable of extracting over 500,000 tons1 of CO2 annually, which would make it the largest DAC plant in the world—far ahead of the second largest, Iceland’s Climeworks Mammoth, which captures nearly 40,000 tons of CO2 annually). For comparison, current anthropogenic annual global CO2-equivalent emissions exceed 70 billion tons without adjusting for natural CO2 uptake.2
Proponents of DAC and other carbon dioxide removal (CDR) methods—often grouped under the broader umbrella of carbon capture and storage (CCS; or, if CO2 utilization is included, CCUS)—argue that removing billions of tons of CO2 from the atmosphere will be necessary, in addition to aggressive net-zero emissions-reduction policies, to limit global temperature increases. The Inflation Reduction Act of 2022 in the U.S. and other mostly European legislation significantly boosted incentives for DAC. In the U.S., the incentive is through enhancements of the section 45Q tax credit, raising the maximum to $162 per ton3 for CO2 that is captured and permanently stored underground (with lower amounts—up to $118—for CO2 used in enhanced oil recovery).4 By comparison, market prices for CO2 emissions allowances in compliance trading systems are substantially lower: about $23 per ton in the most recent auction;5 about $30 per ton in the May 2026 California-Quebec cap-and-trade auction;6 about $60 per ton in the March 2026 Washington State auction;7 and about €70 per ton in Europe during May 2026.8
The substantial subsidies for DAC raise several important policy questions. Is large-scale DAC physically feasible, given its high energy requirements and current and future cost? If it proves both physically and economically viable, what would its actual impact be on the climate or on the environment more broadly? Does DAC pass a basic cost-benefit test—that is, do the claimed benefits of reduced atmospheric CO2 concentrations outweigh the full costs of deployment?
Energy Requirements
A key factor in evaluating the cost-effectiveness and practicality of large-scale DAC is its energy demand—both for operations and for the equipment and raw materials required at scale.
Although a variety of DAC technologies have been demonstrated, all are bound by the laws of thermodynamics. Every system must move vast quantities of air over or through CO2-absorbing materials. This is typically done with large fans that create a pressure drop to pull air across sorbent beds or contactors. Given that CO2 makes up only about 0.042% of the atmosphere by volume (or 425 parts per million [ppm]), capturing 1 billion tons of CO2—even at an idealized 100% capture efficiency—would require moving about nearly 2.8 trillion tons of air, or about a cube of air nearly 80 miles on each side.9 In practice, real-world systems achieve far lower single-pass efficiencies, so the actual air volume (and energy) required is significantly higher.
Increasing the CO2 capture rate requires higher airflow rates. Higher airflow, in turn, requires increasing the pressure drop—and therefore greater energy input—regardless of how efficient a fan’s motor and design are.10 That minimum energy requirement stems from fundamental fluid dynamics, including Bernoulli’s principle, which relates pressure, velocity, and elevation in moving fluids; this principle explains how airplane wings create lift.11 The electricity requirement for real-world fans—ranging from 300 to 900 kilowatt-hours (kWh) per ton of CO2 captured—is much higher than that of a theoretical 100%-efficient fan.12
There is also a minimum energy requirement to separate CO2 from ambient air, again based on thermodynamics. At the current atmospheric CO2 concentration of approximately 425 ppm, this minimum work of separation—at sea level and 32 degrees Fahrenheit—is just under 130 kWh per ton. This value increases at higher elevations or temperatures because air density decreases, requiring even more energy to process the same mass of CO2.
Finally, the captured CO2 must be purified, compressed, and prepared for transportation—whether for underground storage or for other purposes, such as enhanced oil recovery. Thermodynamics again determines the minimum amount of energy required for compression: approximately 60 kWh per ton. Adding these energy requirements together—fan energy (~90 kWh per ton), separation (~130 kWh per ton), and compression (~60 kWh per ton)—yields a theoretical minimum energy requirement of about 280 kWh per ton of CO2 captured.13 No real-world DAC process can ever go below this floor, as it assumes 100% efficiency—which is impossible.
A single commercial-scale facility capturing 1 million tons of CO2 per year would have a minimum theoretical energy requirement of over 280 gigawatt-hours (GWh) of electricity (0.28 megawatt-hours [MWh] per ton of CO2). Real-life facilities consume a multiple of this theoretical floor.
Real DAC systems logically require far more energy than the theoretical minimum. No mechanical or chemical process operates at 100% efficiency. The electric motors that drive the fans lose some energy to friction and heat. The fan blades must overcome aerodynamic drag and friction within the system. The chemical processes and filters do not remove 100% of the CO2 in a single pass. Energy is consumed by pumping chemicals to regenerate the liquid hydroxide solutions. Compressors are not 100% efficient. And so on.
Academic studies since 2011 have shown wide variation in projected DAC energy requirements, depending on the technology employed (see figure 1).14 The dashed line in figure 1 illustrates the estimated average energy requirement for DAC facilities, which is about 1,700 kWh per ton of CO2 removed. One optimistic projection assumed more than a 50% reduction in energy use by 2030 through technological improvements—an assumption that many view as unrealistic.15
Climeworks, a developer of commercial DAC facilities, has claimed that its Generation 3 (Gen 3) system will achieve significantly higher energy efficiency, potentially requiring less than 1 MWh per ton of CO2 removed.16 However, such claims are unlikely to reflect the full energy footprint when the entire DAC process is considered—including raw material extraction and processing, equipment manufacturing, transportation, construction, and ongoing facility operation. Although comprehensive data for full-system energy use are not publicly available, a more realistic total energy requirement for DAC—including all upstream and infrastructure inputs—is likely in the range of 1.8 to 3.6 MWh per ton of CO2 removed.17
Figure 1. Published Estimates of DAC Energy Requirements
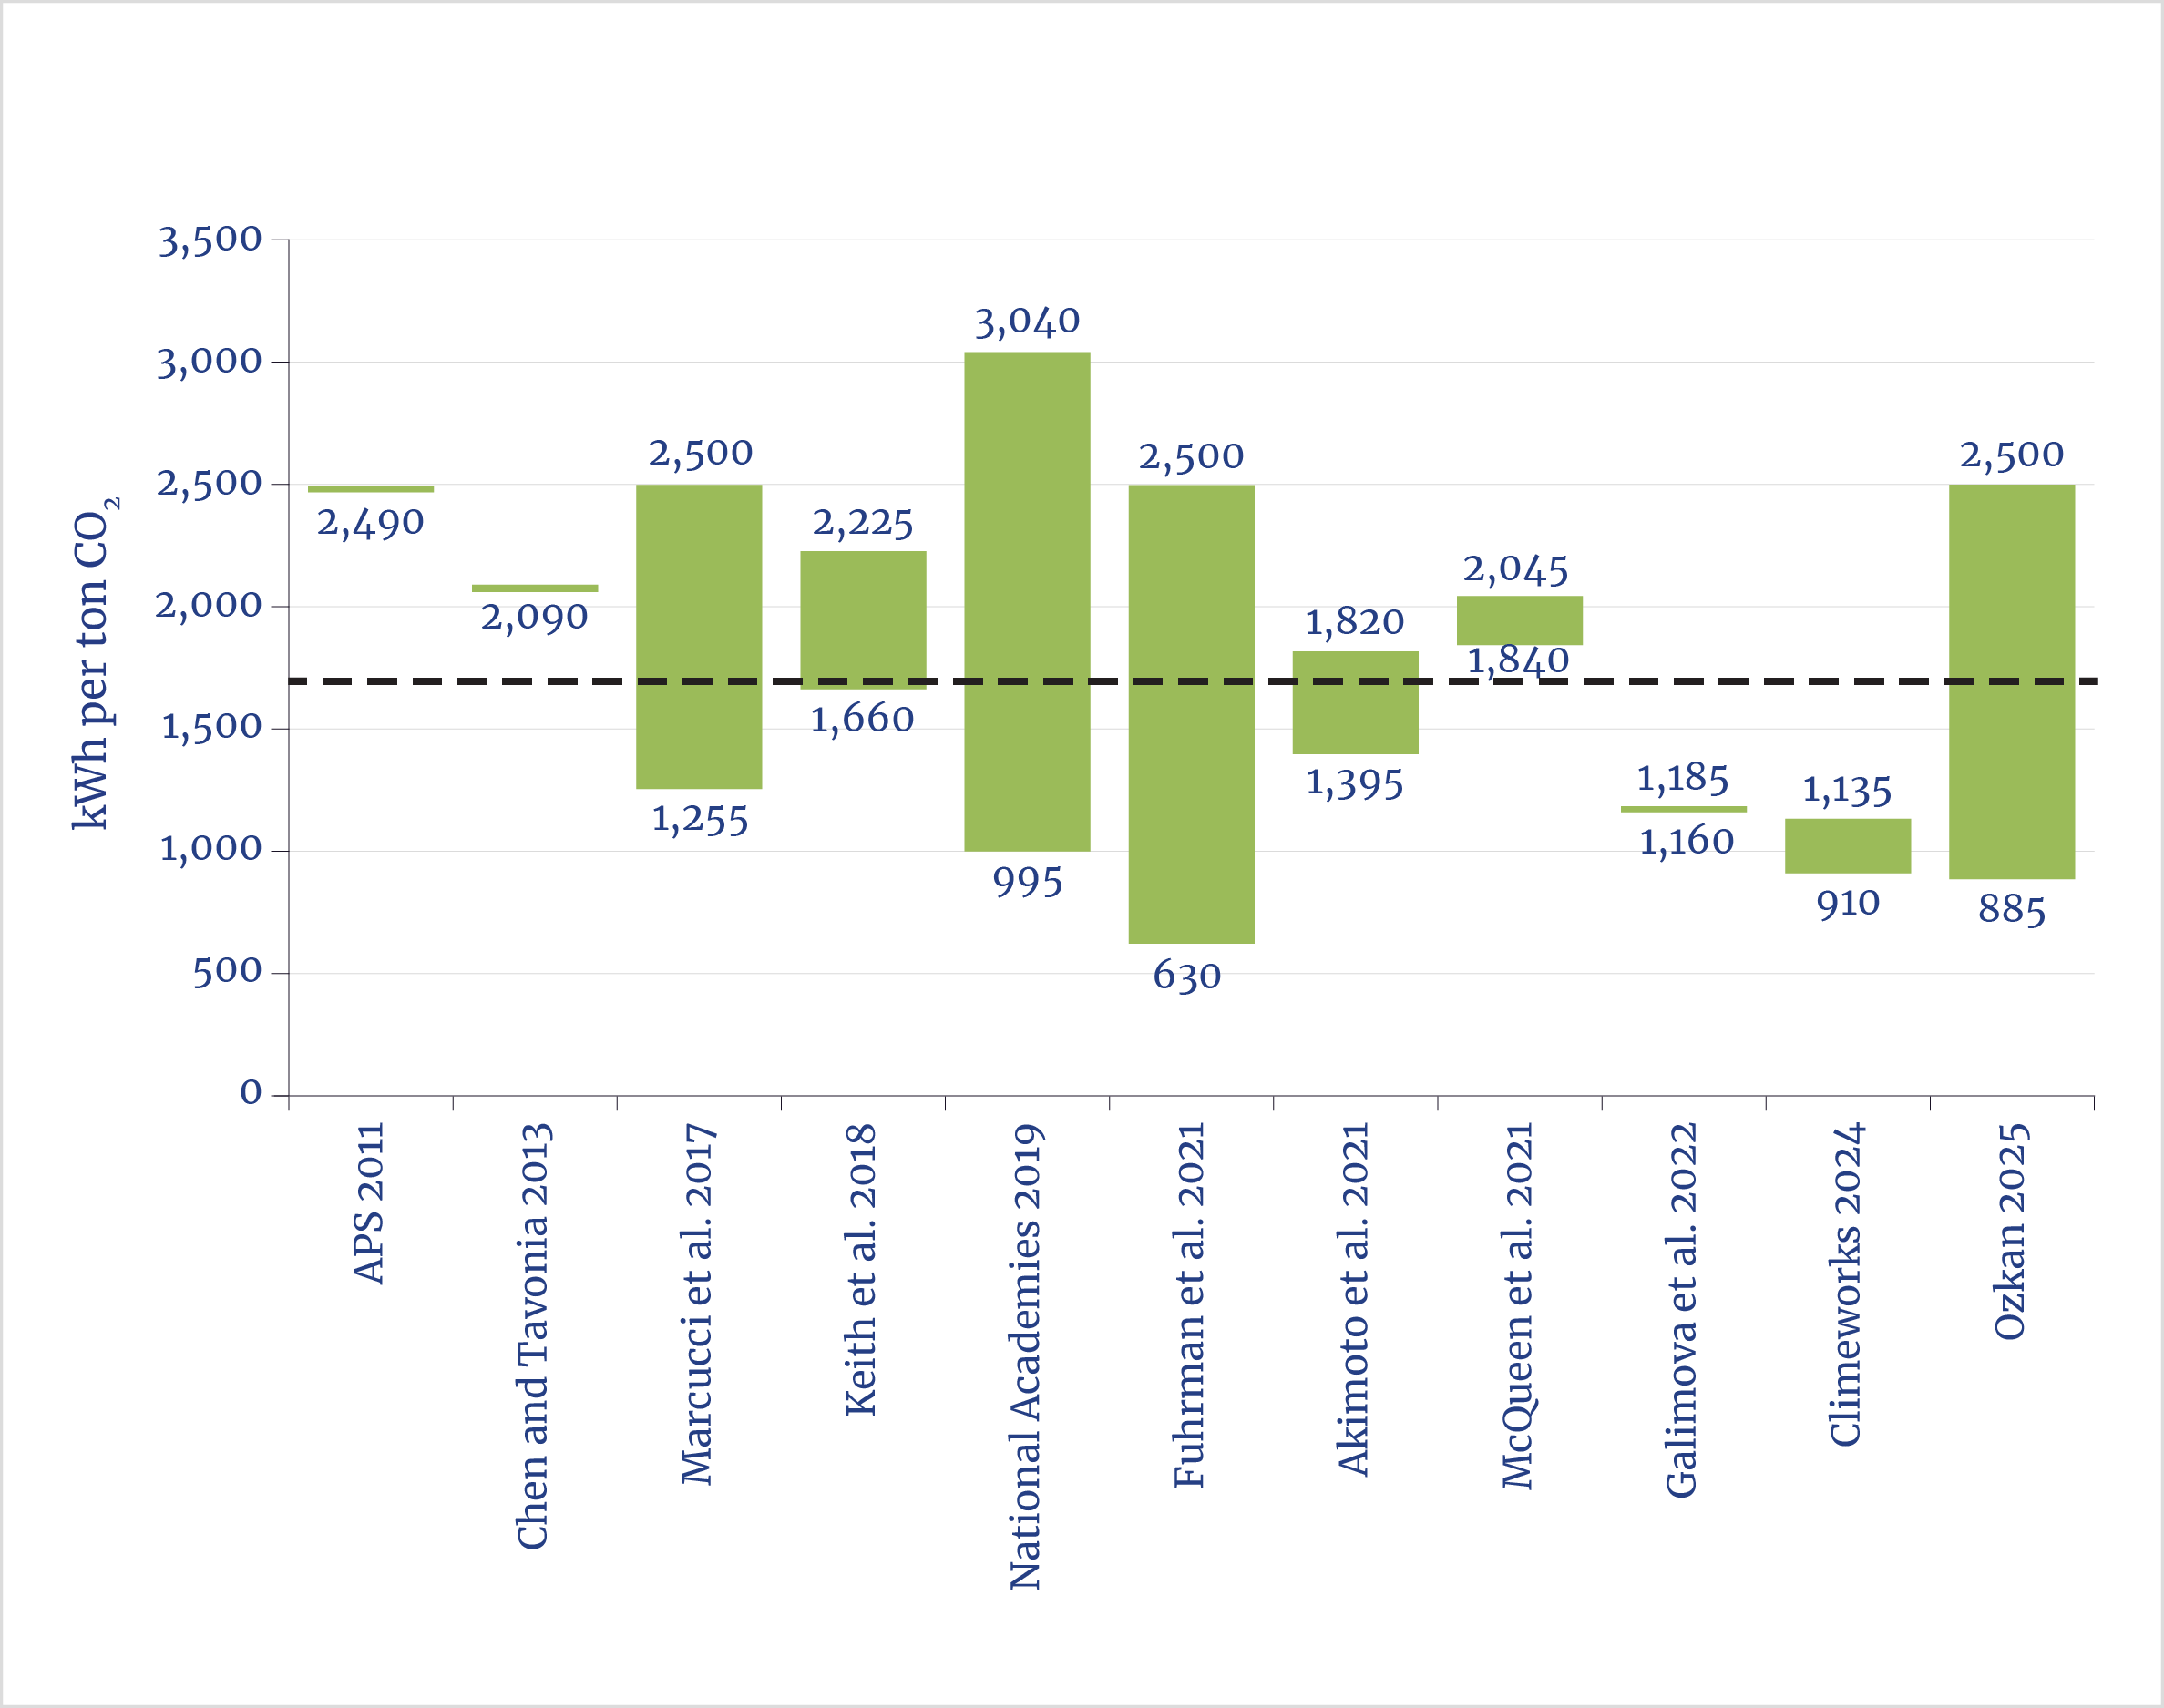
Source: Adapted from Lucas Desport et al., “Deploying Direct Air Capture at Scale: How Close to Reality?” Energy Economics 129 (January 2024): 107244, table 1. Values in the original studies were given in metric units.
A recent U.S. Department of Energy report indicated that the U.S. may need to remove between about 100 million and 2 billion tons of CO2 per year by 2050.18 Using the conservative estimate of 1 MWh per ton of CO2, capturing 100 million tons of CO2 in one year would require about 100 terawatt-hours (TWh) of electricity (about 25% of Germany’s annual electricity consumption).19 Capturing 2 billion tons would require over 2,000 TWh—almost half the total U.S. electricity consumption in 2025.20
Producing this additional electricity would require vast quantities of new, reliable, uninterrupted generating capacity, since industrial CO2 capture requires on-demand power independent of weather conditions. Modern nuclear plants in the U.S. operate at a net load factor above 90%.21 A typical 1,000-MW plant therefore produces 7.9 TWh per year.22 Thus, capturing 100 million tons of CO2 at an average of just over 1 MWh per ton with DAC would require 100 TWh of electricity and about 13 GW of new nuclear capacity. Capturing 2 billion tons of CO2 annually with DAC would require building at least 260 GW of new nuclear capacity—nearly three times the size of the existing U.S. nuclear plant fleet, which is just under 100 GW.23
The U.S. Energy Information Administration (EIA) estimated the overnight capital cost (excluding financing) of building an advanced nuclear plant at about $8,000 per kW (in 2023 dollars) for twin 1-GW reactors.24 Building the 260 GW of new nuclear capacity needed for 2 billion tons of annual DAC removal would therefore cost over $2 trillion. Financing costs, inflation during the multiyear construction period, and project overruns would likely double this figure. This estimate also excluded the additional high-voltage transmission infrastructure (e.g., power lines, substations, transformers) that is required to deliver this new capacity, which would add hundreds of billions of dollars more. When annualized over the life of the plants, the electricity cost alone for DAC would exceed $90 per ton of CO2 removed.25 Using wind and solar with battery and other storage and backup systems would face even greater challenges and even higher costs. The intermittency of wind and solar, the need to overbuild capacity, and the massive land and material requirements would make this approach prohibitively expensive and impractical at the required scale.26
There is also the substantial capital cost of the DAC facilities themselves. The most optimistic projections claimed that total DAC costs could fall by roughly 80% to as low as under $100 per ton of CO2 removed by 2050.27 However, as explained previously, electricity costs alone are likely to exceed $90 per ton, which leaves little room for capital recovery, maintenance, and other operating expenses.
A 2019 National Academies of Sciences, Engineering, and Medicine study estimated the overnight capital costs for a generic, approximately 1-million-ton-per-year liquid-solvent DAC plant at between about $615 million and $1.15 billion.28 Assuming a 20-year plant life and an 8% cost of capital, this translates into an annualized capital cost of approximately $60–$120 per ton of CO2 captured.29
More recent analyses indicate that earlier cost estimates for DAC have been overly optimistic.30 For example, Occidental Petroleum’s Stratos Plant in the Permian Basin, which uses Carbon Engineering’s liquid-solvent DAC technology,31 has a current estimated capital cost of approximately $1.3 billion for its full 550,000 ton capacity.32 Assuming a 20-year plant life and an 8% cost of capital, this equates to an annualized capital cost of just over $130 million per year, or roughly $240 per ton of CO2 captured—before accounting for energy, operations, and maintenance expenses.33
A 2021 study examined different configurations of liquid DAC systems, including those using natural gas for calcination and fully electric systems powered by wind, solar, or nuclear.34 For wind- and solar-powered configurations, the researchers estimated total costs (DAC facilities plus energy) for a 1.1-million-ton-per-year plant at approximately $330–$630 per ton. For nuclear-powered systems, the range was about $360–$560 per ton.35
These cost estimates—which are likely too low, given rising costs for new capacity over the past five years—far exceed the most recent official estimates of the social cost of carbon (SCC), a modeling exercise that attempts to quantify the future damages caused by emitting an additional 1.1 tons of CO2. In 2023, the U.S. Environmental Protection Agency (EPA) published updated SCC values of approximately $190 per ton in 2025, with a projected rise to about $210 per ton by 2030.36 These figures are more than four times higher than the $46-per-ton estimate published in 2021 by the Interagency Working Group.37 Although SCC estimates are controversial—relying on assumptions and predictions that extend centuries into the future38—even these elevated values are lower than the full costs of CDR using DAC.
Climate Impacts
If large-scale DAC capability could be developed and deployed successfully, how would it affect the climate? In 2024, U.S. energy-related CO2 emissions were just over 5 billion tons.39 Another 330 million tons were estimated to come from non–energy-related sources.40 Overall, world energy-related CO2 emissions were more than 40 billion tons in 2024; when other greenhouse gases such as methane were included, total emissions approached 80 billion tons —without adjusting for natural CO2 uptake by the biosphere or oceans.41 Those emissions have increased by an average of nearly 300 million tons per year over the past decade. Removing a mere 100 million tons of CO2 in one year would be equivalent to just over one week of 2024 U.S. emissions and less than one day of 2024 global emissions, and it would offset less than five months of average annual energy-related emissions growth.
The potential effects on global temperature from different levels of DAC deployment can be estimated using the Intergovernmental Panel on Climate Change estimates of climate sensitivity. At the current atmospheric CO2 concentration of about 425 ppm, removing 110 million tons of CO2 with DAC would reduce atmospheric CO2 by about 0.0116 ppm and lower the average global temperature by about 0.0002 degrees Fahrenheit. Removing 2 billion tons would reduce the atmospheric concentration by 0.232 ppm and lower the average global temperature by 0.004 degrees Fahrenheit.42
To put these DAC-driven temperature “improvements” in context, global mean temperatures have uncertainty ranges of about ±0.09 degrees Fahrenheit to ±0.234 degrees Fahrenheit.43 In other words, the estimated temperature reductions would be far smaller than the inherent noise—or measurement uncertainty—in global temperature records.
Using MAGICC, a climate carbon cycle model,44 it is possible to project the potential temperature impacts from sustained DAC removal over several decades. For example, if 2.2 billion tons of CO2 were removed annually starting in 2030 and continuing through 2100, a cumulative total of 154 billion tons of CO2 would be removed. Under the median shared socioeconomic pathway 4.5 scenario,45 this sustained removal would reduce average global temperature by 0.108 degrees Fahrenheit by 2100, lowering projected warming from 4.89 degrees Fahrenheit to 4.78 degrees Fahrenheit above preindustrial levels (see figure 2). The temperature reduction is less than one-fourth of the typical ±0.234 degrees Fahrenheit uncertainty band in global mean temperature—that is, indistinguishable from natural variability and measurement noise.
Figure 2. Estimated Impact of DAC Removal, 2030–2100
.png)
Note: SSP 4.5 refers to shared socioeconomic pathway 4.5, a framework used by climate scientists to model future greenhouse gas emissions scenarios.
Source: Authors, using “MAGICC (Model for the Assessment of Greenhouse Gas Induced Climate Change),” Integrated Assessment Modeling Consortium, 2022, accessed June 5, 2026, https://magicc.org.
Perspectives
This issue brief demonstrates that DAC is neither economical nor practical for addressing climate change. Even if deployed on an unrealistically massive scale, DAC would have virtually no measurable impact on global temperatures. Despite its exorbitant cost and negligible impact on global climate, DAC is heavily subsidized through the section 45Q tax credit. If DAC facilities capable of capturing about 100 million tons of CO2 are built by 2033, the credit would cost taxpayers approximately $18 billion per year—or $180 billion over the 10-year eligibility period.
With high costs far exceeding any realistic climate benefit, DAC fails any reasonable cost-benefit test. The current tax credits therefore represent a significant and unjustifiable waste of taxpayer dollars. A more productive use of these funds would be to redirect them toward research and development of lower-cost, advanced nuclear power technologies, which offer far greater potential for meaningful emissions reductions.
- Unless otherwise specified, tons refers to U.S. short tons (approximately 0.9 metric tons).
- Lars Schernikau and William Smith, “‘Climate Impacts’ of Fossil Fuels in Today’s Energy Systems,” Journal of the Southern African Institute of Mining and Metallurgy 122, no. 3 (March 2022): 133–146. The cited publication expressed the estimate in metric tons and reflects a 20-year global warming potential for methane.
- The prices in this issue brief are given in U.S. dollars or in euros per U.S. short ton, but the tax code and auction-price sources expressed prices in dollars per metric ton.
- Inflation Reduction Act of 2022, Pub. L. No. 117-169, § 13104, 136 Stat., 1924–29.This section extended and modified the credit for carbon oxide sequestration under IRC § 45Q.
- “Auction71,” The Regional Greenhouse Gas Initiative, accessed May 19, 2026, https://www.rggi.org/Auction/71.
- California Air Resources Board (CARB) and Ministère de l’Environnement, de laLutte contre les changements climatiques, de la Faune et des Parcs (MELCCFP), California Cap-and-Invest Program and Québec Cap-and-Trade System February 2026 Joint Auction #47 Summary Results Report (CARB, MELCCFP, and WIC, Inc., 2026).
- State of Washington Department of Ecology, Washington Cap-and-Invest Program Auction #13 March 2026 Summary Report (State of Washington Department of Ecology, 2026).
- “EU Carbon Permits,” Trading Economics, accessed May 19, 2026, https://tradingeconomics.com/commodity/carbon.
- One ton of air has a volume of just over 28,000 cubic feet at standard temperature and pressure; hence, 2.75 trillion tons of air has a volume of about 70 quadrillion cubic feet.
- Geoffrey Holmes and David W. Keith, “An Air-Liquid Contactor for Large-Scale Capture of CO2 from Air,” Philosophical Transactions of the Royal Society A: Mathematical, Physical and Engineering Sciences 370, no. 1974 (September 2012): 4380–403. The authors derived an empirical relationship to determine pressure drop that is based on the depth of the contactors and the air velocity.
- For an introductory example, see Ruqiong Qin and Chunyi Duan, “The Principle and Applications of Bernoulli Equation,” Journal of Physics: Conference Series 916 (October 2017): 012038.
- Mihrimah Ozkan, “Atmospheric Alchemy: The Energy and Cost Dynamics of Direct Air Carbon Capture,” MRS Energy & Sustainability12 (2025): 46–61.
- Jonathan Lesser, A Cost-Benefit Analysis of Using Direct Air Capture to Remove Atmospheric Carbon (National Center for Energy Analytics [NCEA], 2026).
- See Lucas Desport et al., “Deploying Direct Air Capture at Scale: How Close to Reality?” Energy Economics 129(January 2024): 107244, table 1, for a summary of existing studies for thermal and electric energy consumption; and National Academies of Sciences, Engineering, and Medicine (NASEM), Negative Emissions Technologies and Reliable Sequestration: A Research Agenda (National Academies Press, 2019), for a full range of estimates (486–5818 kWh per ton, depending on parameters). The lowest energy requirement for fans (at al ow-value pressure drop of 300 pascals) is 20 kWh per ton. This value is below the theoretical minimum energy requirement for a facility that removes about 1million tons of CO2 annually. Figure 1 therefore reflects the National Academies’ midrange values.
- Jay Fuhrman et al., “The Role of Direct Air Capture and Negative Emissions Technologies in the Shared Socioeconomic Pathways Towards +1.5°C and +2°C Futures,” Environmental Research Letters 16 (November 2021): 114012. The authors assumed that the energy requirement for solid sorbent DAC would decrease from 1,386 kWh per ton in 2020 to 630 kWh per ton by 2030. The basis for that assumed improvement inefficiency is not specified. As Desport et al. noted, some estimates were unclear as to whether the energy for compression of the captured CO2 was included. For their economic analysis, they assumed around 1,090 kWh per ton of electricity use (approximately the average estimated electricity consumption of the Climeworks Gen 3 solid DAC process).
- Climeworks, “Real-World Testing Proves Climeworks’ Gen 3 Efficiency Leap with Svante’s Structured Adsorbents,”press release, May 12, 2025. There is no publicly available information on actual energy use. Based on published data for the company’s Gen 2 technology, Gen 3 likely requires 635–1,360 kWh per ton of CO2 removed.
- Lars Schernikau, “‘Carbon’ Capture, Utilization, and Storage (CCUS): Separating Fact from Fiction,” The Unpopular Truth (blog), January 3, 2026.
- Grant Faber, Direct Air Capture: Definition and Company Analysis (Office of Fossil Energy and Carbon Management, U.S. Department of Energy, 2025).
- U.S. Energy Information Administration (EIA), “International,” dataset, accessed May29, 2026, https://www.eia.gov/international/data/world.
- Kimberly Peterson, “U.S. Electricity Generation in 2025 Hit a Record, Again,” Today in Energy, March 5, 2026.
- “Table 4.08.B. Capacity Factors for Utility Scale Generators Not Primarily Using Fossil Fuel,” EIA, accessed June 7, 2026, https://www.eia.gov/electricity/annual/html/epa_04_08_b.html.
- This was calculated as (1,000 MW) × (8,760 hours/year) × 0.90 capacity factor =7.884 × 10⁶ MWh.
- "Table 6.2.A. Net Summer Capacity of Utility Scale Units by Technology and by State, March 2026 and 2025 (Megawatts),” Electric Power Monthly, EIA, accessed June 7, 2026, https://www.eia.gov/electricity/monthly/epm_table_grapher.php?t=table_6_02_a.
- EIA, Capital Cost and Performance Characteristics for Utility-Scale Electric Power Generating Technologies (EIA, 2024), 63.
- Electric utilities recover the costs of a generating plant investment over its assumed lifetime, depreciating the cost over that period and earning a return on the un-depreciated capital investment. For a detailed discussion, see Jonathan Lesser and Leonardo Giacchino, Fundamentals of Energy Regulation,3rd ed. (Regulatory Economics Publishing, 2019).
- Lars Schernikau, “Rethinking the Cost of Electricity in a Complex Energy System,” The Unpopular Truth (blog), April 2026; and Lars Schernikau, The Battery Storage Delusion: Utility Scale Batteries Are No Silver Bullet (NCEA,2025).
- David W. Keith et al., “A Process for Capturing CO₂ from the Atmosphere,” Joule 2, no. 8 (August 15, 2018): 1573–94. See also Robert F. Service, “Cost Plunges for Capturing Carbon Dioxide from the Air,” Science, June 7, 2018.
- NASEM, Negative Emissions Technologies. This study assumes a DAC plant life of 30 years. Most other assessments assume 20 years.
- Assuming a cost of debt of 6%, a cost of equity capital of 10%, and a 50:50 capital structure, the overall weighted average cost of capital is 8%. The resulting capital recovery factor is 0.1019. The original analysis was based on a 1-million-metric-ton plant.
- Katrin Sievert et al., “Considering Technology Characteristics to Project Future Costs of Direct Air Capture,” Joule8, no. 4 (April 17, 2024): 979–99. They estimate a range of capital costs of $205–$757per ton. See also Desport et al., “Deploying Direct Air Capture” ;and Howard Herzog et al., “Getting Real About Capturing Carbon from the Air,” One Earth 7, no. 9 (2024): 1477–80.
- Julia Attwood, “Occidental’s Big Buy May Change Course of $150 Billion Market, ”Bloomberg NEF, August 28, 2023. In 2023, Occidental Petroleum acquired Carbon Engineering.
- Shelby Webb, “Occidental Updates Plan for World’s Largest CO2 Trap,” E&E News, August 9, 2024.
- Origis Energy built a $290 million, 145-megawatt alternating current solar photovoltaic facility to power the Stratos plant. There is no publicly available information on accompanying battery storage or grid interconnection. See “Swift Air Solar,” Origis Energy, accessed May 29, 2026, https://origisenergy.com/project/swift-air.
- Noah McQueen et al., “NaturalGas vs. Electricity for Solvent-Based Direct Air Capture,” Frontiersin Climate 2 (2021): 618644.
- The original analysis was based ona 1-million-metric-ton plant.
- U.S. Environmental Protection Agency (EPA), Reporton the Social Cost of Greenhouse Gases: Estimates for Carbon Dioxide, Methane,and Nitrous Oxide (EPA, 2023).
- Interagency Working Group on Social Cost of Greenhouse Gases, Technical Support Document: Social Cost of Carbon, Methane, and Nitrous Oxide: Interim Estimates Under Executive Order 13990 (United States Government, 2021). The cited publication expressed this estimate in dollars per metric ton.
- Jonathan Lesser, “The Social Cost of Carbon Should Not Be Used for Making Policy Decisions,” Journal of Advance Research in Food, Agriculture, and Environmental Science 11 (September 2025): 27–42.
- Energy Institute, 2025 Statistical Review of World Energy, 74th ed. (Energy Institute, 2025), 16.
- Pierre Friedlingstein et al., “Global Carbon Budget 2025,” Earth System Science Data 18, no. 5 (2026): 3211–88.
- Friedlingsteinet al., “Global Carbon Budget 2025.”
- The authors’ calculations were based on the radiative forcing model in Gunnar Myhre et al., “New Estimates of Radiative Forcing Due to Well Mixed Greenhouse Gases,” Geophysical Research Letters 25, no. 14(July 1998): 2715–18.
- Chris Hewitt, “State of the Global Climate: Annual and Decadal Updates by WMO,” presented at the United Nations Climate Change 17th Research Dialogue, June 17, 2025.
- “MAGICC (Model for the Assessment of Greenhouse Gas Induced Climate Change),”Integrated Assessment Modeling Consortium, 2022, accessed June 5, 2026, https://magicc.org.
- The shared socioeconomic pathway (SSP) framework was developed to model futureclimate change and builds on the earlier representative concentration pathway(RCP). SSP 4.5 is a midrange scenario, with 4.5 representing the predictedincrease in radiative forcing—which measures the additional heat that the earthretains—from the year 1750 to 2100. For additional discussion, see “ClimateModel: Temperature Change (RCP 4.5)—2006–2100,” Science on a Sphere, National Oceanic andAtmospheric Administration, published November 17, 2013, https://sos.noaa.gov/catalog/datasets/climate-model-temperature-change-rcp-45-2006-2100.
Continue Reading


.jpeg)
Who Pays When Wind Turbines and Solar Panels Wear Out? A Hidden Energy Liability
This means that consumers or taxpayers-not the owners-will likely be left to pay a significant portion of the $50 billion or more in future decommissioning costs.