The Adverse Impacts of Renewable Portfolio Standards on Electricity Prices and the Economy
-6%20(7).png)
Subsidies and mandates for renewable electricity have existed for almost 50 years, beginning with the passage...
Executive Summary
Subsidies and mandates for renewable electricity have existed for almost 50 years, beginning with the passage of the Public Utilities Regulatory Policies Act (PURPA) of 1978. In 1983, the first renewable portfolio standard (RPS) was enacted by the state of Iowa. Subsequently, 29 states plus the District of Columbia enacted RPS mandates.
RPS mandates require a certain percentage of retail electricity to be supplied by qualifying renewable resources, such as wind and solar, as well as from other favored sources of generation, such as municipal solid waste and waste coal. Typically, these percentage requirements increase over time, with some states enacting RPS mandates that require 100% of all electricity to eventually be sourced from these resources. In most states, wind and solar generation account for the vast majority of the mandated electricity.
RPS mandates are typically accompanied by renewable energy credits (RECs), with one REC corresponding to 1 megawatt-hour (MWh) of RPS electricity. RECs provide an additional subsidy to generators that meet the RPS mandate, while acting as a tax on conventional generation owners and electric utilities. Ultimately, the costs of RECs are borne by retail electricity customers through higher retail prices.
Those costs are substantial. Over the years 2020–25, the estimated impact on retail ratepayers in the United States was over $114 billion. On a percentage basis, the largest impacts on retail rates have been in states that require qualifying generators to be located within state borders. The highest individual impact in 2024 was in the District of Columbia, where the estimated increase on retail prices exceeded 15%.
RPS mandates and RECs distort and undermine competitive electricity markets. They drive out unsubsidized conventional generators, decreasing overall supply and increasing wholesale market prices. And, because RECs act as a tax on conventional generators, they increase those generators’ marginal costs, thus reducing their ability to compete in wholesale markets. This further hastens those generators’ exit from wholesale markets and leads to still higher market-clearing prices. Because RECs are generated almost entirely by wind and solar resources—which are inherently intermittent and thus have low economic values—the costs of maintaining electric system reliability also rise, further increasing retail electric rates.
Proponents have offered numerous justifications for RPS mandates. These include reduced exposure to volatile fuel and electricity prices, lower wholesale and retail electric prices, reduced greenhouse gas emissions, and greater economic growth and job creation. None of these justifications has any basis in fact.
- RPS mandates increase volatility in wholesale electricity prices and have no measurable impact on volatility in fossil fuel prices. Moreover, numerous well-developed financial instruments for hedging such volatility exist. Those provide the desired levels of hedging at a cost lower than that of building renewable resources.
- RPS mandates reduce economic growth. While mandates and RECs clearly benefit renewable energy developers, the costs of RPS mandates are ultimately reflected in higher retail electric costs. These costs reverberate through the broader economy, much as higher gasoline prices do. This results in a net decrease in economic growth and the loss of thousands of jobs. This analysis estimates that, from 2020 to 2025, RPS mandates forced retail consumers in the United States to pay an additional $114 billion for their electricity—and more than $22 billion in 2025 alone. The resulting job losses in 2025 are estimated to be more than 130,000 full-time equivalents.
- The claimed reduction in greenhouse gas emissions from electricity supplied by wind and solar under RPS mandates is negligible. For example, even assuming wind and solar generation displaced only coal-fired generation, total RPS wind and solar generation in 2024 displaced the equivalent of just one day’s worth of world greenhouse gas emissions. RPS mandates are an inefficient, high-cost mechanism for reducing those emissions, thereby burdening U.S. consumers.
Introduction
Subsidies and mandates for renewable electricity have existed for almost 50 years, beginning with the passage of the Public Utilities Regulatory Policies Act (PURPA) of 1978, which was one of five acts that encompassed a broad set of energy policies designed to reduce the United States’ dependence on foreign oil. Although the rationale for promoting renewable electricity has changed since the enactment of PURPA, as have the forms of electricity that qualify as renewable, the economic damage from the various forms of renewable energy promotion continues.
Specifically, this report examines the economic impacts of renewable portfolio standards, which are in place in 29 states and the District of Columbia.1 A renewable portfolio standard (RPS) is a mandate on local electric utilities and, in states that allow retail electric competition, competitive electricity providers. The first such mandate was enacted in 1983 in Iowa. However, the majority of RPS mandates were enacted in the mid- to late 1990s.
Typically, RPS mandates require a certain percentage of retail electricity to be supplied by qualifying renewable resources, such as wind and solar. These percentage requirements increase over time, with some states, such as Vermont, establishing 100% RPS mandates.2 Vertically integrated utilities have the option of building their own qualifying renewable resources.
For electric utilities that either do not or cannot own generating resources—such as in states that have restructured their electric industries—the alternative is to purchase renewable energy credits (RECs) from qualifying independently owned renewable energy generators. Thus, RECs provide a subsidy to qualifying renewable energy producers that is paid for by nonqualifying electricity suppliers and, ultimately, retail customers.
Many states differentiate their RPS mandates by renewable resource type, requiring different percentages for specific types of renewable generation (e.g., solar) that fall into administratively defined renewable energy tiers. For example, Pennsylvania’s Alternative Energy Portfolio Standard, enacted in 2004, required 18% of all retail electric sales to come from qualifying resources by 2020.3
Those resources are divided into two tiers. Eight percent must come from Tier 1 resources, which include solar photovoltaics (PV), wind, small hydroelectric, biomass, coal-mine methane biologically derived methane, and fuel cells. The remaining 10% must come from Tier 2 resources, which include waste coal, large hydroelectric projects, demand-side management, and even coal gasification. And, as with many states, there is also a specific carve-out for solar PV, which must constitute at least 0.5% of the total RPS requirement.4
Regardless of their specific design, all RPS mandates distort electricity markets. As will be discussed in this report, market distortions, in turn, cause economic losses and raise overall costs.5 Some studies have quantified the costs of RPS and the effects on electric prices.6 These impacts have increased as the overall quantity of renewable electricity supplied has increased. In effect, RPS mandates benefit the few (qualifying RPS suppliers) at the expense of the many (individual consumers, businesses, and industry).
This report provides a general evaluation of these mandates, based on established economic principles and published estimates of the impacts of RPS mandates on retail electricity costs. Moreover, the report discusses the broader economic impacts of RPS mandates, as supporters often claim they enhance economic growth and job creation; the more stringent the mandate, the greater the resulting economic growth and job creation. As this report will show, such claims are a baseless form of free-lunch economics.
Rationales for RPS Mandates Fail Basic Tests of Economic Logic
The rationales for RPS mandates have included the following: increasing energy security, reducing electric price volatility by reducing fossil fuel consumption, reducing greenhouse gas emissions, and promoting economic development through the creation of new industries and green jobs7
Additionally, some states have established RPS requirements based on political considerations to favor specific constituencies, such as excluding large-scale hydroelectric power while including electricity generated by burning waste coal. Still other states have established RPS mandates that require retail providers to purchase RECs only from renewable generators that are physically located within those states, under the pretense of economic development.8
Reduced Dependence on Foreign Oil
Although the genesis of PURPA and the other legislative acts that accompanied it was to reduce U.S. dependence on foreign oil and overall fossil fuel consumption, the United States is now the largest producer of oil and gas in the world and is a net exporter of petroleum and natural gas.9 Thus, the argument about reducing U.S. dependence on foreign crude oil is no longer valid.
Additionally, oil-fired generation in the United States has declined precipitously over the past two decades. By 2024, petroleum consumption for electricity generation had fallen to just under 30 million barrels, compared with total consumption of over 6 billion barrels—roughly 0.5% of total consumption.10 Today, oil-fired generators rarely operate and typically only do so during times when electricity demand is greatest or when other generators are scheduled to be offline for maintenance, as happened in May 2026 in New England.11
Reduced Fossil Fuel and Electric Price Volatility
In 2024, oil-fired generation accounted for just 0.25% of total U.S. electricity generation.12 Hence, claims that RPS mandates reduce fossil fuel price volatility focus on natural gas prices. The U.S. Energy Information Administration (EIA) reported on natural gas price volatility, noting that it declined from a peak in 2022.13 Natural gas price volatility has many causes, most notably weather-related changes in demand.14
Retail electricity prices are far less volatile than natural gas prices because electricity prices are typically set by utility regulators. Moreover, in states that allow direct retail electric competition, local distribution utilities are required to offer provider of last resort service or serve as a default electricity provider for customers who either cannot or do not wish to select a retail provider. Typically, those utilities are required to hedge electricity prices through layered contracts that extend over several years. Furthermore, there are many financial hedging mechanisms available to utilities and consumers to reduce price volatility as much as they wish, including long-term contracts, call options based on futures market prices, pre-buy options for retail customers, and so forth. These hedging mechanisms are less costly and more flexible than forced purchases of renewable generation under RPS mandates.
In fact, renewable generation increases price volatility in wholesale electricity markets as its supply increases. Most of the renewable generation provided by RPS mandates comes from wind and solar PV—which are inherently intermittent, generating electricity only when the wind blows and the sun shines. When that happens, supply increases and prices decrease. But when there is no wind or sun, they are unavailable—and so prices increase. As the overall generating capacity of wind and solar increases, these impacts become more pronounced, as illustrated in figure 1.
In this figure, the supply of wind and solar generation, R, is shown as the green line in both panels. Initially, the supply is R0.15 The remaining supply is shown as the red line. The market-clearing price when renewable energy is available is where the combined supply curve crosses the demand curve, D. In the left-hand panel, the supply of renewable energy is given by R0 and the market-clearing price when this electricity is available is P0R0. When that supply is not available, the market price increases to P0. The difference, V0, is the price volatility.
When the supply of intermittent renewable electricity increases to R1, volatility increases, as shown on the right-hand panel of figure 1. When the additional renewable generation is available, the wholesale price falls to P1R1. When unavailable, the price is P1, which is the same as the previous price P0. Hence, the price change increases to V1.
Figure 1. Effects of Increasing Wind and Solar on Electric Price Volatility
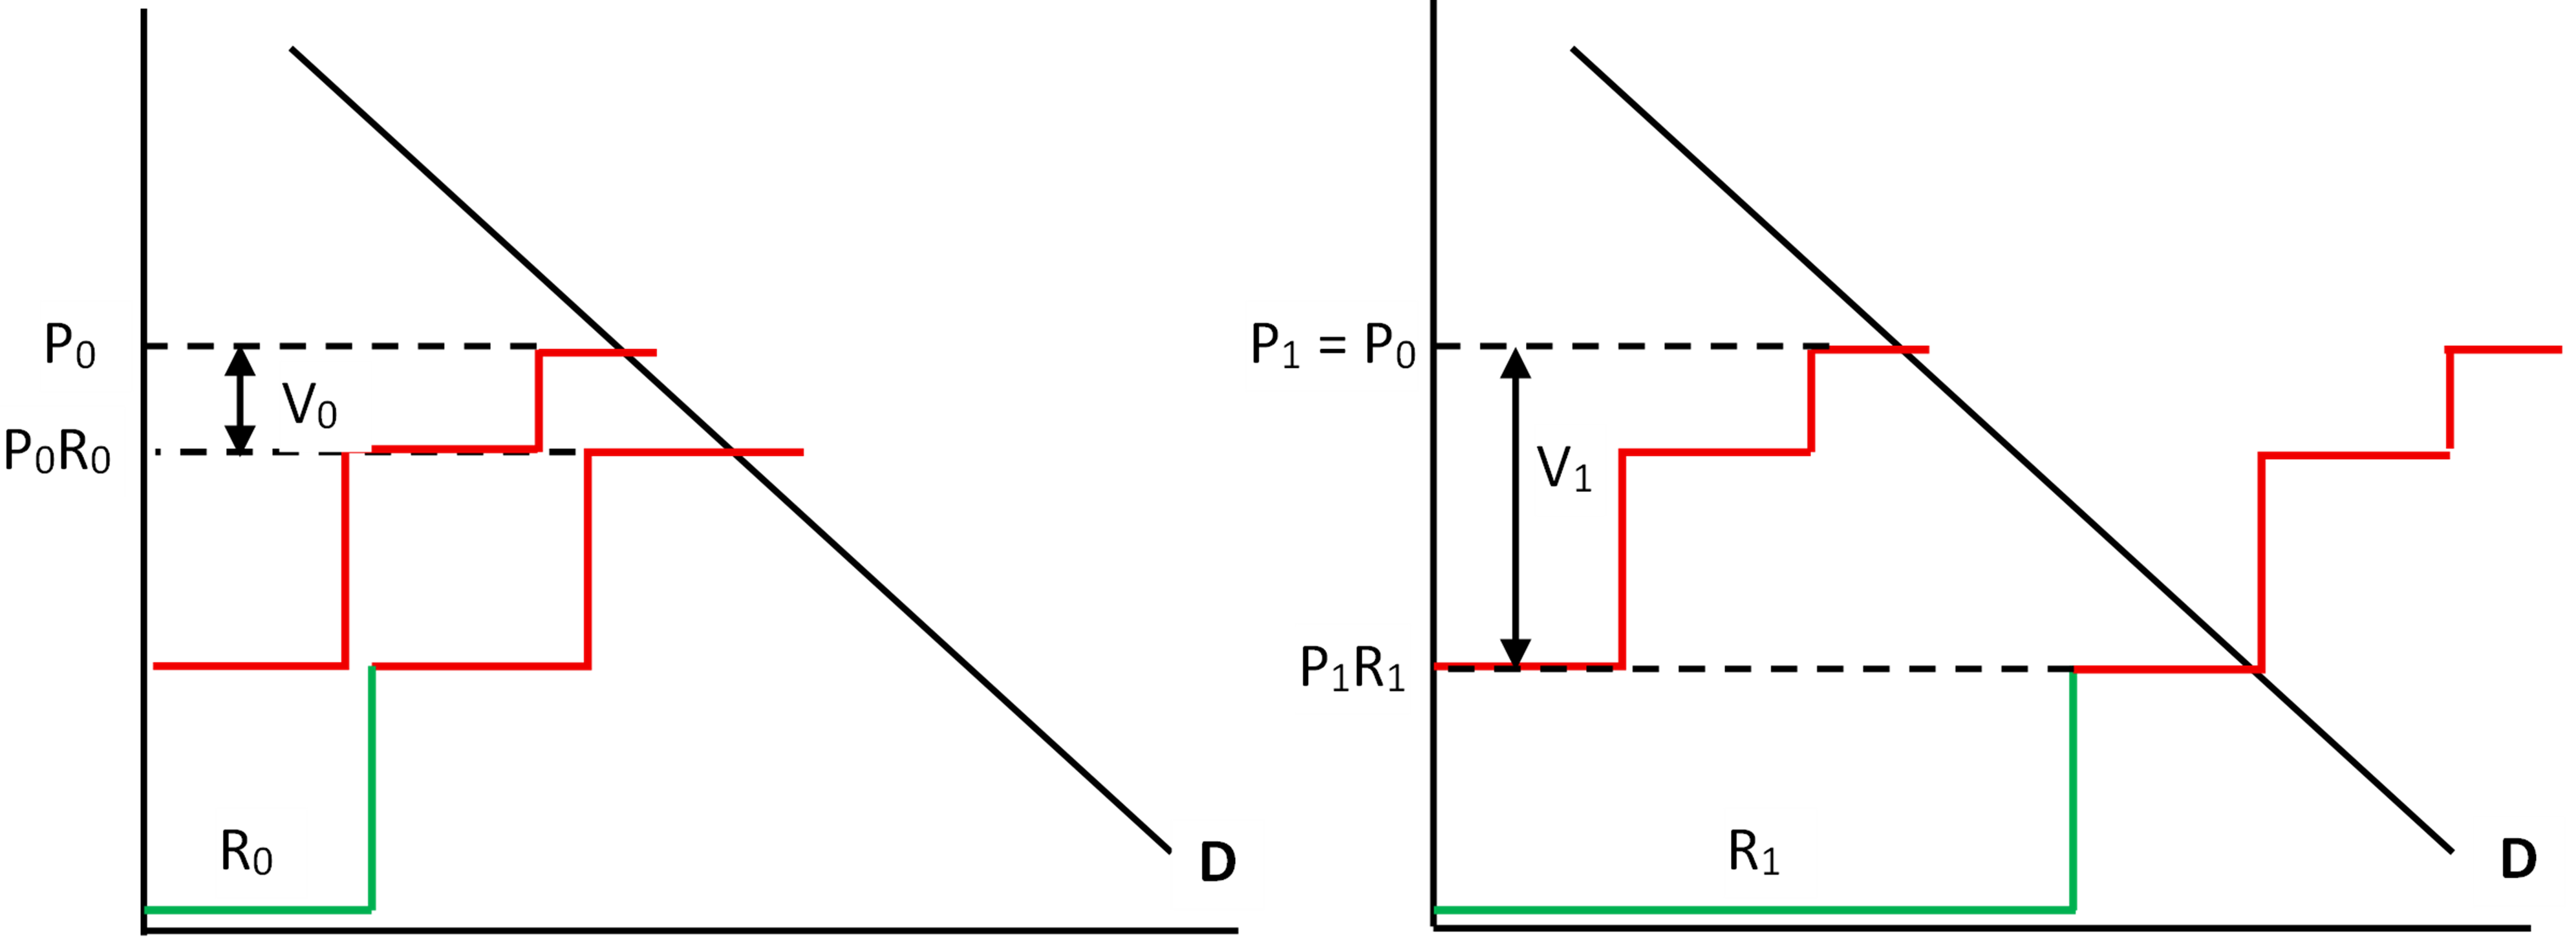
Source: Author.
Climate Change
Regardless of one’s beliefs about the severity of climate change and the urgency of policies to reduce greenhouse gas emissions, RPS mandates are an inefficient, high-cost approach that will have no measurable impact on the climate. First, the emissions reductions achieved by substituting zero-emissions renewable electricity for electricity from fossil fuels are offset when that renewable generation is intermittent. This is because additional fossil-fuel generation—typically gas-fired combustion turbines—must be in standby mode to quickly compensate for changes in renewable generation. An analogy is having a second car idling in case the first car’s engine stalls.
When the costs of providing back-up generation are included, the costs of intermittent renewable generation are higher than those of conventional resources.16 Moreover, wind and solar PV can degrade power system quality because they do not provide key attributes, such as inertia, that provide voltage and frequency support. Consequently, those attributes must be provided by other fossil-fuel generators or by costly battery storage. Previous studies have found that the emissions reductions can be achieved at a lower cost than through RPS.17
Finally, the quantities of carbon dioxide (CO2) that RPS mandates reduce are negligible when compared with world emissions. In 2024, certified sales of RECs totaled just under 120 million MWh.18 If one (incorrectly) assumed that every MWh displaced is coal-fired generation, and there were no increases in emissions arising from requiring additional gas-fired generators on standby to account for intermittency, the emissions reductions would amount to just over 120 million metric tons.19 That represents just over one day of world CO2 emissions in 2025, which totaled just over 38 billion metric tons.20
Economic Development
The final argument for RPS mandates is to boost economic growth and job creation. Numerous studies have been published touting the job creation potential of renewable generation.21 These studies, and others like them, claim that investments (i.e., subsidies) for renewable energy increase economic growth. However, as will be discussed, such findings are invalid because they fail to account for the source of the subsidies themselves.
Impacts of RPS Mandates on Electricity Markets and Economic Growth
Figure 1 presents the simplest possible short-run case, in which the REC requirement acts as a tax on subsidized generation, leaving unsubsidized generation exempt. Even without the implicit tax on unsubsidized generators, as subsidized renewable generation increases, it drives out unsubsidized generation that cannot compete, which the author has termed Gresham’s Law of Green Energy.22
Forcing unsubsidized generators to pay the REC tax accelerates this process and leads to higher long-term electricity prices as unsubsidized generation falls. In fact, this has taken place across the country. Data published by EIA indicates a reduction in coal- and natural gas–fired generating capacity, while wind and solar capacity have increased.23
A second effect that must be addressed is the impact of RPS mandates on the costs to ensure system reliability. This includes increases in capacity market prices, such as in PJM (which oversees the operation of the electric grid for 13 states and the District of Columbia), as well as increased costs for ancillary services, such as reserves and voltage support. By forcing out unsubsidized fossil fuel generators, RPS mandates—along with other renewable energy subsidies such as production tax credits—have increased capacity market prices and raised ancillary service costs (e.g., spinning reserve, voltage support). Retail customers ultimately bear these costs.
Direct REC Costs
RECs represent transfer payments from unsubsidized generators and retail electric customers to qualifying generation owners.24 REC costs are published by individual state utility commissions. Table 1 summarizes total RPS compliance costs for four states (Maryland, Massachusetts, New Jersey, and Pennsylvania) and the District of Columbia over the period 2020–25. As shown in table 1, RPS compliance costs for the period 2020–25 totaled just under $20 billion.
Table 1. RPS Compliance Costs, Selected States: 2020–25
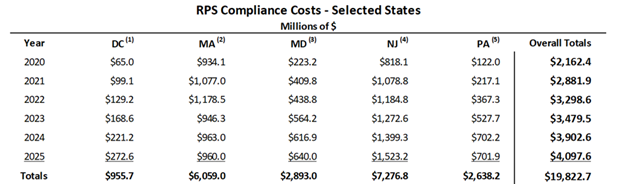
(1) Public Service Commission of the District of Columbia (DCPSC), Renewable Energy Portfolio Standards: A Report for Compliance Year 2025 (DCPSC, 2026).
(2) “Annual Compliance Reports and Other Publications,” Renewable Energy Portfolio Standard, Mass.gov, accessed June 25, 2026, https://www.mass.gov/info-details/annual-compliance-reports-and-other-publications. Massachusetts provides low and high RPS cost estimates. The values shown represent the average of those estimates.
(3) Maryland Public Service Commission, Renewable Energy Portfolio Standard: With Data for Calendar Year 2024 (Maryland Public Service Commission, 2025).
(4) New Jersey Board of Public Utilities, EY 2025 RPS Compliance Results 2004 to 2025, dataset (New Jersey Clean Energy Program, 2025).
(5) “Alternative Energy Portfolio Standards (AEPS) Reports,” Pennsylvania Public Utility Commission, accessed June 25, 2026, https://www.puc.pa.gov/filing-resources/reports/alternative-energy-portfolio-standards-aeps-reports/.
As previously shown in figure 1, RECs provide a subsidy to renewable generators, thereby increasing the supply of renewable generation to R1. Additionally, because RECs are paid by unsubsidized generators, they act like a tax, shifting the conventional supply curve upwards, as shown in figure 2. The long-run result is to drive even more conventional generators out of the market, raising electricity prices for consumers. This loss of conventional generators has already taken place.
Figure 2. Effects of RECs on Unsubsidized Generators and Market Prices

Source: Author.
In PJM, for example, the capacity of coal-fired generators has decreased by about 25%, from 52,500 megawatts (MW) at the end of 2019 to 38,850 MW at the end of 2025.25 Although gas-fired generating capacity increased by 6,300 MW over the same period, the overall loss of conventional generating capacity exceeded 7,000 MW. While conventional generating capacity decreased, peak loads in PJM increased.
As shown in table 2, summer peak load increased by over 6,300 MW and winter peak load by over 23,000 MW—an increase of almost 20%. The increase in winter peak load is especially problematic because electricity generation from solar PV is negligible during peak periods, which take place either in the early morning or early evening.26
Table 2. PJM Summer and Winter Peak Demand: 2020–25
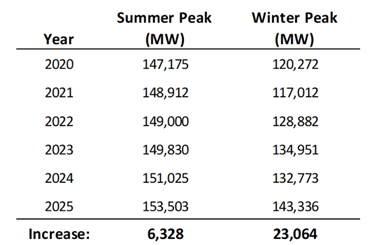
Source: Data from PJM, “2026 Load Report Tables,” dataset in PJM Load Forecast Report (PJM, 2026).
The loss of conventional generating capacity in PJM would have been still worse had it not been for out-of-market arrangements, called reliability-must-run (RMR) agreements, with certain generation owners. RMR agreements are intended to delay the planned retirement of generating plants that are no longer economically viable. PJM signed RMR agreements with two generating plants: Brandon Shores, a 1,300 MW coal plant located outside Baltimore, and H.A. Wagner, a 774 MW oil-fired plant located in Anne Arundel County, east of Washington, DC. The RMR agreements for these two plants do not expire until 2029.
The withdrawal of conventional generation also caused capacity market prices to increase in PJM by a factor of 10. (PJM oversees this separate capacity market to compensate generators for being available when most needed.27) Clearing prices in PJM’s capacity market auction last December increased from around $29 per MW per day (MW-day) in the 2024–25 delivery year to over $330/MW-day in the most recent 2027–28 delivery year.28
The increase in capacity prices, despite the addition of over 15,000 MW of solar PV and 2,300 MW of wind, is a consequence of the intermittency of those resources. PJM and other RTOs use probabilistic models to determine the effective load carrying capability (ELCC) of generating resources. ELCC measures the contribution that a generating resource can make toward meeting peak demand.29 For example, PJM estimated the ELCC value for solar PV at just 8% for the 2026–27 planning year and 7% for the 2027–28 planning year. In other words, PJM estimated that for every 1,000 MW of installed solar PV capacity, the expected contribution to peak load would be only 80 MW in the 2026–27 planning year and just 70 MW in the 2027–28 planning year. For wind, PJM calculated an ELCC value of 41%.30
By contrast, PJM calculated ELCC values for nuclear and coal plants at 95% and 83%, respectively. Gas combined-cycle plants have an ELCC value of 74%.31 Because RPS mandates drive out high-ELCC conventional generators and replace them with low-ELCC intermittent resources, far more nameplate capacity must be built and paid for to meet the same peak demand. The result is higher capacity costs, which are ultimately passed through to retail customers as higher rates.
Impacts of RPS Mandates on Retail Electric Costs
Lawrence Berkeley National Laboratory has estimated the annual impacts of RPS mandates across the country on electric costs and ret2025), expressed as a percentage of retail electric bills.32 In 2024, the average for all states that reported RPS compliance costs was approximately 4%. The states whose RPS mandates have the highest impacts on retail electric bills are those with specific solar PV mandates. The average annual impacts on bills for the years 2020–25 are shown in table 3.
Table 3. Impacts of State RPS Mandates on Retail Electric Bills: 2020–25
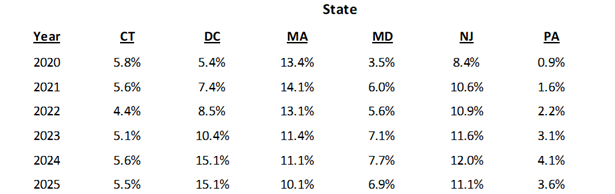
Source: Data from Galen L. Barbose, “Historical RPS & CES Target Achievement and Compliance Costs,” dataset in U.S. State Electricity Resource Standards: 2026 Data Update (Lawrence Berkeley National Laboratory, 2026).
As table 2 shows, the costs of RPS mandate compliance are highest in the District of Columbia, at 15.1%, followed by New Jersey, at 11.1%. The impact on Massachusetts is 11.1%. The table also shows that the impacts on retail electric bills have increased, quadrupling in Pennsylvania, trebling in the District of Columbia, and doubling in Maryland.
Using EIA-published retail revenue data, the RPS bill impact percentages can be converted into total dollar impacts.33 Table 3 shows total retail revenues for the states listed in table 4, as well as for the United States as a whole. Table 4 shows the impact of RPS mandates on those retail revenues, based on the percentages shown in table 2 and the overall 4% average for the United States. The impacts on retail electricity prices exceed the RPS compliance costs because of the upward shift in the market supply curve shown in figure 2.
Table 4. Total Retail Electric Sales Revenues: 2020–25 (Millions of $)
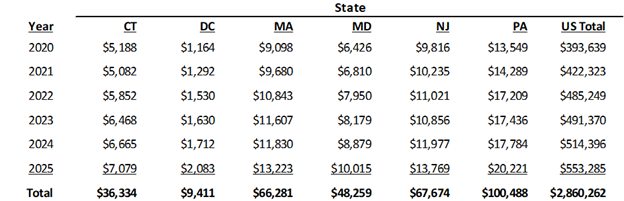
Source: “Electricity Data Browser,” U.S. Energy Information Administration, accessed June 25, 2026, https://www.eia.gov/electricity/data/browser.
Table 5. Revenue Impacts of RPS Mandates: 2020–24 (Millions of $)
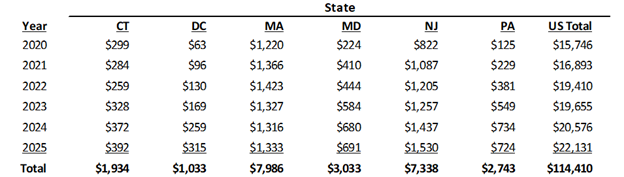
Source: “Electricity Data Browser,” U.S. Energy Information Administration, accessed June 25, 2026, https://www.eia.gov/electricity/data/browser.
As shown in table 5, the additional costs paid by retail ratepayers over the five-year period, 2020–25, range between $1 billion in the District of Columbia to just under $8 billion in Pennsylvania. For the United States as a whole, the cost of the retail electric price increase totals over $114 billion.
Indirect REC Costs
The primary sources of RECs have been intermittent wind and solar generation that would not have been developed but for subsidies. This has caused the costs of ensuring system reliability to increase.34 These costs include operational reserve costs, which are payments made to conventional power plants to keep them running on standby, and costs for frequency and voltage support, which compensate for sudden variations in wind and solar output and those resources’ lack of system inertia.35
The additional costs for reserve capacity increase as the share of wind and solar capacity increases.36 As discussed previously, the impact on capacity market prices was most pronounced in PJM. The amount of reserve capacity required depends on the specifics of the bulk power system. A study by the New York Reliability Council, for example, estimated that the reserve capacity for the New York ISO would need to increase from its current 20% value to over 100% as wind and solar generating capacity increased.37
Operational reserves refer to the different types of resources needed to ensure system reliability at a moment’s notice, including frequency response (FFR), which can respond almost instantaneously; spinning reserves, which are available within 10 minutes; and non-spinning reserves, which are typically available between 10 and 30 minutes. FFR refers to equipment that can compensate for sudden changes in frequency (which must be kept within a narrow range for the power system to operate). Spinning reserves are generators—typically gas-fired—that are operated and synchronized with the grid but that do not supply power. Non-spinning reserves are those that are either offline or idle and that can be synchronized to the grid.
Economic Impacts of Higher Electric Rates
A final consideration is the broader impact of higher electricity costs that are ultimately paid by retail customers and borne by the economy as a whole. Most economic impact studies by renewable energy advocates have ignored those costs by assuming the subsidies were provided from sources outside the economy, rather than by consumers. The author developed estimates of these broader economic impacts using an input-output modeling framework.38
The estimated impacts of higher electricity costs vary by state, depending on a state’s economy. In Pennsylvania, for example, the author estimated that each million-dollar increase in electricity costs would result in a loss of just over six full-time equivalent job-years.39 Thus, the $92 billion impact on retail electric prices shown in table 4 for the years 2020–25 would result in a loss of 550,000 job-years. In 2025 alone, the loss would be over 130,000 job-years.
Conclusion
There is no economic or environmental justification for RPS mandates. None of the justifications offered by proponents—reduced exposure to volatile fuel and electricity prices, lower electric costs, reduced greenhouse gas emissions, and greater economic growth and job creation—has any basis in fact.
RPS mandates—along with greater penetration of wind and solar power—have increased electric price volatility while having no measurable impact on fossil fuel price volatility. RPS mandates and RECs increase electricity prices by driving out unsubsidized conventional generators, decreasing overall supply, and raising wholesale market prices.
RECs act as a tax on unsubsidized conventional generators, increasing production costs and further reducing conventional generators’ ability to compete in wholesale markets. RECs—generated almost entirely by intermittent wind and solar resources—increase the costs of maintaining electric system reliability, which in turn further increases retail electricity costs.
While RPS mandates and RECs clearly benefit renewable energy developers, the higher electricity costs that result from wind and solar generation projects reverberate throughout the broader economy and result in net decreases in economic growth and jobs.
- Galen L. Barbose, “Historical RPS & CES Target Achievement and Compliance Costs,” dataset in U.S. State Electricity Resource Standards: 2025 Data Update (Lawrence Berkeley National Laboratory, 2025).
- Many states have also adopted clean energy or zero-s electricity standards, which are often combined with RPS requirements.
- The Pennsylvania Public Utility Commission (PAPUC), Alternative Energy and Economic Development in Pennsylvania (PAPUC, 2024).
- PAPUC, Alternative Energy and Economic Development.
- See Carolyn Fischer, “Renewable Portfolio Standards: When Do They Lower Energy Prices?,” The Energy Journal 31, no. 1 (2010): 101–19. Fischer claims that, under some circumstances, RPS mandates can lower electricity prices. Her claim is purely theoretical, based on an assumption that RPS mandates reduce natural gas demand and prices, thus lowering electricity prices.
- See, for example, Richard Schmalensee, “Evaluating Policies to Increase the Generation of Electricity from Renewable Energy,” Review of Environmental Economics and Policy 6, no. 1 (2011): 45–64; and Ryan H. Wiser et al., Impacts of Variable Renewable Energy on Bulk Power System Assets, Pricing, and Costs (Lawrence Berkeley National Laboratory and Argonne National Laboratory, 2017).
- Schmalensee, “Evaluating Policies.”
- In-state mandates are a form of protectionism that, like tariffs and quotas, increases REC prices, as will be discussed below. Such mandates also raise Commerce Clause issues, as states are generally prohibited from inhibiting interstate commerce. However, a discussion of the legal implications of in-state RPS mandates is beyond the scope of this white paper.
- Mickey Francis, “The United States Is a Major Energy Exporter and Importer, Especially for Petroleum,” Today in Energy, U.S. Energy Information Administration (EIA), May 27, 2026.
- EIA, May 2026 Monthly Energy Review (EIA, 2026).
- Stu Turley, “New England’s Grid Failed Resiliency and Burned Oil This Week: New England’s Power Grid Just Reminded Everyone Why Resiliency Must Come First,” Energy News Beat (blog), May 20, 2026.
- “Table 3.1.A. Net Generation by Energy Source: Total (All Sectors), 2014–2024,” Electric Power Annual, EIA, accessed June 24, 2026, https://www.eia.gov/electricity/annual/table.php?t=epa_03_01_a.html.
- Katy Fleury, “U.S. Natural Gas Prices Calmed After a Volatile 2022,” Today in Energy, EIA, June 4, 2024.
- Abebe Hailemariam and Russell Smyth, “What Drives Volatility in Natural Gas Prices?,” Energy Economics 80 (2019): 731–42.
- For ease of exposition, the marginal cost of wind and solar electricity in figure 1 is shown to be slightly greater than zero. In fact, for resources that claim the production tax credit, their marginal cost is negative.
- See, for example, Michael Reed and Brett Bennett, The Cost of Wind and Solar Variability to Texas Ratepayers (Texas Public Policy Foundation, 2025); and Lazard, Levelized Cost of Energy+: June 2025 (Lazard, 2025).
- See Katerina Dobesova et al., “Are Renewable Portfolio Standards Cost-Effective Emission Abatement Policy?,” Environmental Science & Technology 39, no. 22 (2005): 8578−83; Kenneth Gillingham and James H. Stock, “The Cost of Reducing Greenhouse Gas Emissions,” Journal of Economic Perspectives 32, no. 4 (2018): 53−72; and Michael Greenstone and Ishan Nath, Do Renewable Portfolio Standards Deliver Cost-Effective Carbon Abatement?, Working Paper No. 2019-62 (University of Chicago, Becker Friedman Institutes for Economics, 2020).
- Center for Resource Solutions (CRS), 2025 Green-e Verification Report (CRS, 2025).
- In 2025, total coal-fired generation was 733 million MWh and total emissions from coal-fired power plants were 750 million metric tons—an average of 1.02 metric tons/MWh. “Electricity Data Browser,” EIA, accessed June 25, 2026, https://www.eia.gov/electricity/data/browser.
- Pierre Friedlingstein et al., “Global Carbon Budget 2025,” Earth System Science Data 18, no. 5 (2026): 3211–88.
- See Navigant Consulting, Jobs Impact of a National Renewable Electricity Standard (Navigant Consulting, 2010); Daniel M. Kammen et al., Green Jobs and the Clean Energy Economy, Thought Leadership Series #4 (Copenhagen Climate Council, 2009); Ethan Pollack, Counting up to Green: Assessing the Green Economy and Its Implications for Growth and Equity, Briefing Paper #349 (Economic Policy Institute, 2012); and Virgilijus Dirma et al., “The Impact of Renewable Energy Development on Economic Growth,” Energies 17, no. 24 (2024): 6328. The Navigant Consulting report is no longer publicly available.
- Jonathan A. Lesser, “Gresham’s Law of Green Energy,” Regulation (Winter 2010–2011): 12–18. Lesser shows that any short-run gains to consumers are less than the cost of the subsidies themselves, which are paid by consumers and unsubsidized generators.
- “Table 1.1. Net Generation by Energy Source: Total (All Sectors), 2016–March 2026, Electric Power Monthly, EIA, accessed June 24, 2026, https://www.eia.gov/electricity/monthly/epm_table_grapher.php?t=table_1_01.
- The share of costs borne by generators and retail customers depends on the generation elasticity of supply and customer elasticity of demand. Because the demand for electricity is inelastic, that is, consumption is relatively invariant to changes in prices, it is retail customers who are most likely absorbing the majority of RPS compliance costs.
- “Electricity Data Browser.”
- PJM, “2026 Load Report Tables,” dataset in PJM Load Forecast Report (PJM, 2026).
- Capacity markets are one solution to what is called the missing money problem, which arises because wholesale energy market prices are capped. The energy market price caps create a situation in which generators—especially those designed only to run at times of peak demand—cannot recover sufficient revenues to remain economically viable. Not all RTOs oversee separate capacity markets. For example, the Electric Reliability Council of Texas (ERCOT), which operates the grid in Texas, relies on reliability unit commitment, as well as payments in ancillary services markets. See ERCOT, “Reliability Unit Commitment,” presentation, September 2025; and Pengwei Du et al., “New Ancillary Service Market for ERCOT,” IEEE Access 8 (2020): 178391–401.
- PJM, 2027/2028 Base Residual Auction Report (PJM, 2025). PJM’s delivery year runs from June 1 to May 31.
- Todd Aagaard and Andrew N. Kleit et al., “Marginal vs. Average Effective Load Carrying Capability: How Should Capacity Markets Deal with Alternative Generation Forms?,” Utilities Policy 84 (October 2023): 101654.
- PJM, 2025 PJM Effective Load Carrying Capability and Reserve Requirement Study (ELCC/RRS) (PJM, 2025).
- PJM, 2025 PJM Effective Load Carrying Capability.
- Barbose, “Historical RPS & CES.”
- Barbose, “Historical RPS & CES.”
- Ryan H. Wiser et al., Impacts of Variable Renewable Energy on Bulk Power System Assets, Pricing, and Costs (Lawrence Berkeley National Laboratory and Argonne National Laboratory, 2017); and Jason Scott Johnston, Renewable Power and the Reliability Cost of Electricity, Virginia Public Law and Legal Theory Research Paper No. 2022-32, Virginia Law and Economics Research Paper No. 2022-05 (University of Virginia, 2022).
- Conventional generators spin large turbines to generate electricity. These turbines have rotational inertia that keeps them spinning, thus providing voltage and frequency support. Wind and solar generators supply direct current electricity and do not provide system inertia.
- Lion Hirth and Inka Ziegenhagen, “Balancing Power and Variable Renewables: Three Links,” Renewable and Sustainable Energy Reviews 50 (October 2015): 1035–51.
- Mayer Sasson et al., “Reliability Challenges in Meeting CLCPA Requirements,” presented at the Climate Action Reliability Planning Speaker Session, August 2, 2021.
- See Jonathan A. Lesser, “Renewable Energy and the Fallacy of ‘Green’ Jobs,” The Electricity Journal 23, no. 7 (2010): 45–53.
- Lesser, “Renewable Energy and the Fallacy.” One job-year equals one full-time-equivalent job for one year. The mathematical framework for this analysis is available from the author.
Continue Reading
-2%20(1).png)
.jpg)

After UAE Departure, What's Next for OPEC?
The news of the United Arab Emirates's (UAE) departure from the Organization of the Petroleum Exporting Countries (OPEC) came as a significant surprise to the markets. But to those paying close attention, the move was less unexpected than it appeare