The Myth of the Chinese Clean-Energy Dragon
-3%20(1).png)
China is increasingly portrayed as the global leader in the clean-energy revolution and a role model for other countries to emulate
Listen
The Issue
China is increasingly portrayed as the global leader in the clean-energy revolution1 and a role model for other countries to emulate. Climate and renewable-power activists tout China’s peaking greenhouse gas emissions,2 rapid transition away from fossil fuel energy,3 mass adoption of electric vehicles (EVs), and whole-economy shift to electrification.4 In the media, China is often lauded as the world’s first major “electrostate”5 due to its rapid deployment of renewable-power capacity and growing dominance in manufacturing wind turbines, solar panels, batteries, and EVs, as well as the critical minerals required to make these technologies.6 Despite the U.S. having achieved absolute reductions in carbon emissions over the past two decades,7 America is still admonished to be more like China—not just for environmental reasons but to avoid falling behind technologically and economically.8 Some analysts warn that failing to emulate China’s “green leap forward”9 could create national security risks and geopolitical vulnerabilities for the U.S.10
Culturally and institutionally, China has long operated with layers of mythology, opacity, and misdirection, a pattern that persists to this day. In the modern era, any macroeconomic data release or pronouncement by the Chinese Communist Party (which has ruled for nearly 77 years) should be assessed with a gimlet eye and, when possible, independently verified. Political incentives heavily influence reporting, from local industrial targets to national statistics such as real gross domestic product (GDP) growth and manufacturing production. The same skepticism applies to China’s climate and clean-energy disclosures and targets. The key difference now is the external amplification: Many environmentalists and climate advocacy groups appear willing to suspend critical scrutiny by engaging in selective or loose analysis to present China’s green credentials in the most favorable light.
The Reality
Myth #1: China’s Carbon Emissions Are Now Peaking
Estimating greenhouse gas emissions is an inexact science, marked by measurement challenges and inevitable reporting lags. Nevertheless, for the past two years, the U.K.-based climate journalism website Carbon Brief has highlighted—almost on a monthly basis—that China’s CO2 emissions have been “flat or falling” since March 2024.11 In mid-February 2026, barely six weeks after the close of 2025, the site reported that China’s emissions fell 1% year-over-year during the fourth quarter of 202512—this, in a country where most domestic companies require a full four months to disclose annual financial results. Besides being rushed, the Carbon Brief analysis tracks emissions generated only by the fossil fuel and cement sectors (which comprise approximately two-thirds of Chinese emissions) to distill a peaking trend, understating the country’s carbon footprint in the process.
Figure 1 shows the 40-year trend in China’s total greenhouse gas emissions (excluding land use, land-use change, and forestry), broken down by economic sector. It draws on the European Commission’s EDGAR – Emissions Database for Global Atmospheric Research data for 1985–2014 and Climate TRACE data for 2015–25.13
Despite slowing real GDP growth in recent years, China’s total emissions have continued rising over the past decade, reaching roughly 19.4 billion tons of CO2 equivalent in 2025—up 26% from 2015 levels and nearly fivefold since 1985. Power generation and manufacturing together accounted for 65% of China’s total emissions in 2025. While national emissions have shown a somewhat sideways trend over the past two to three years, this flattening owes more to cyclical and structural factors than to conscious clean-energy policy decisions. Chief among them is the severe downturn in the domestic residential real estate market,14 which sharply reduced demand for cement and related emissions.15 The earlier shutdown of China’s solid waste recycling industry16 and the ban on foreign trash imports17 played a smaller, longer-term role.
Figure 1. China’s Gross Greenhouse Gas Emissions, by Sector: 1985–2025
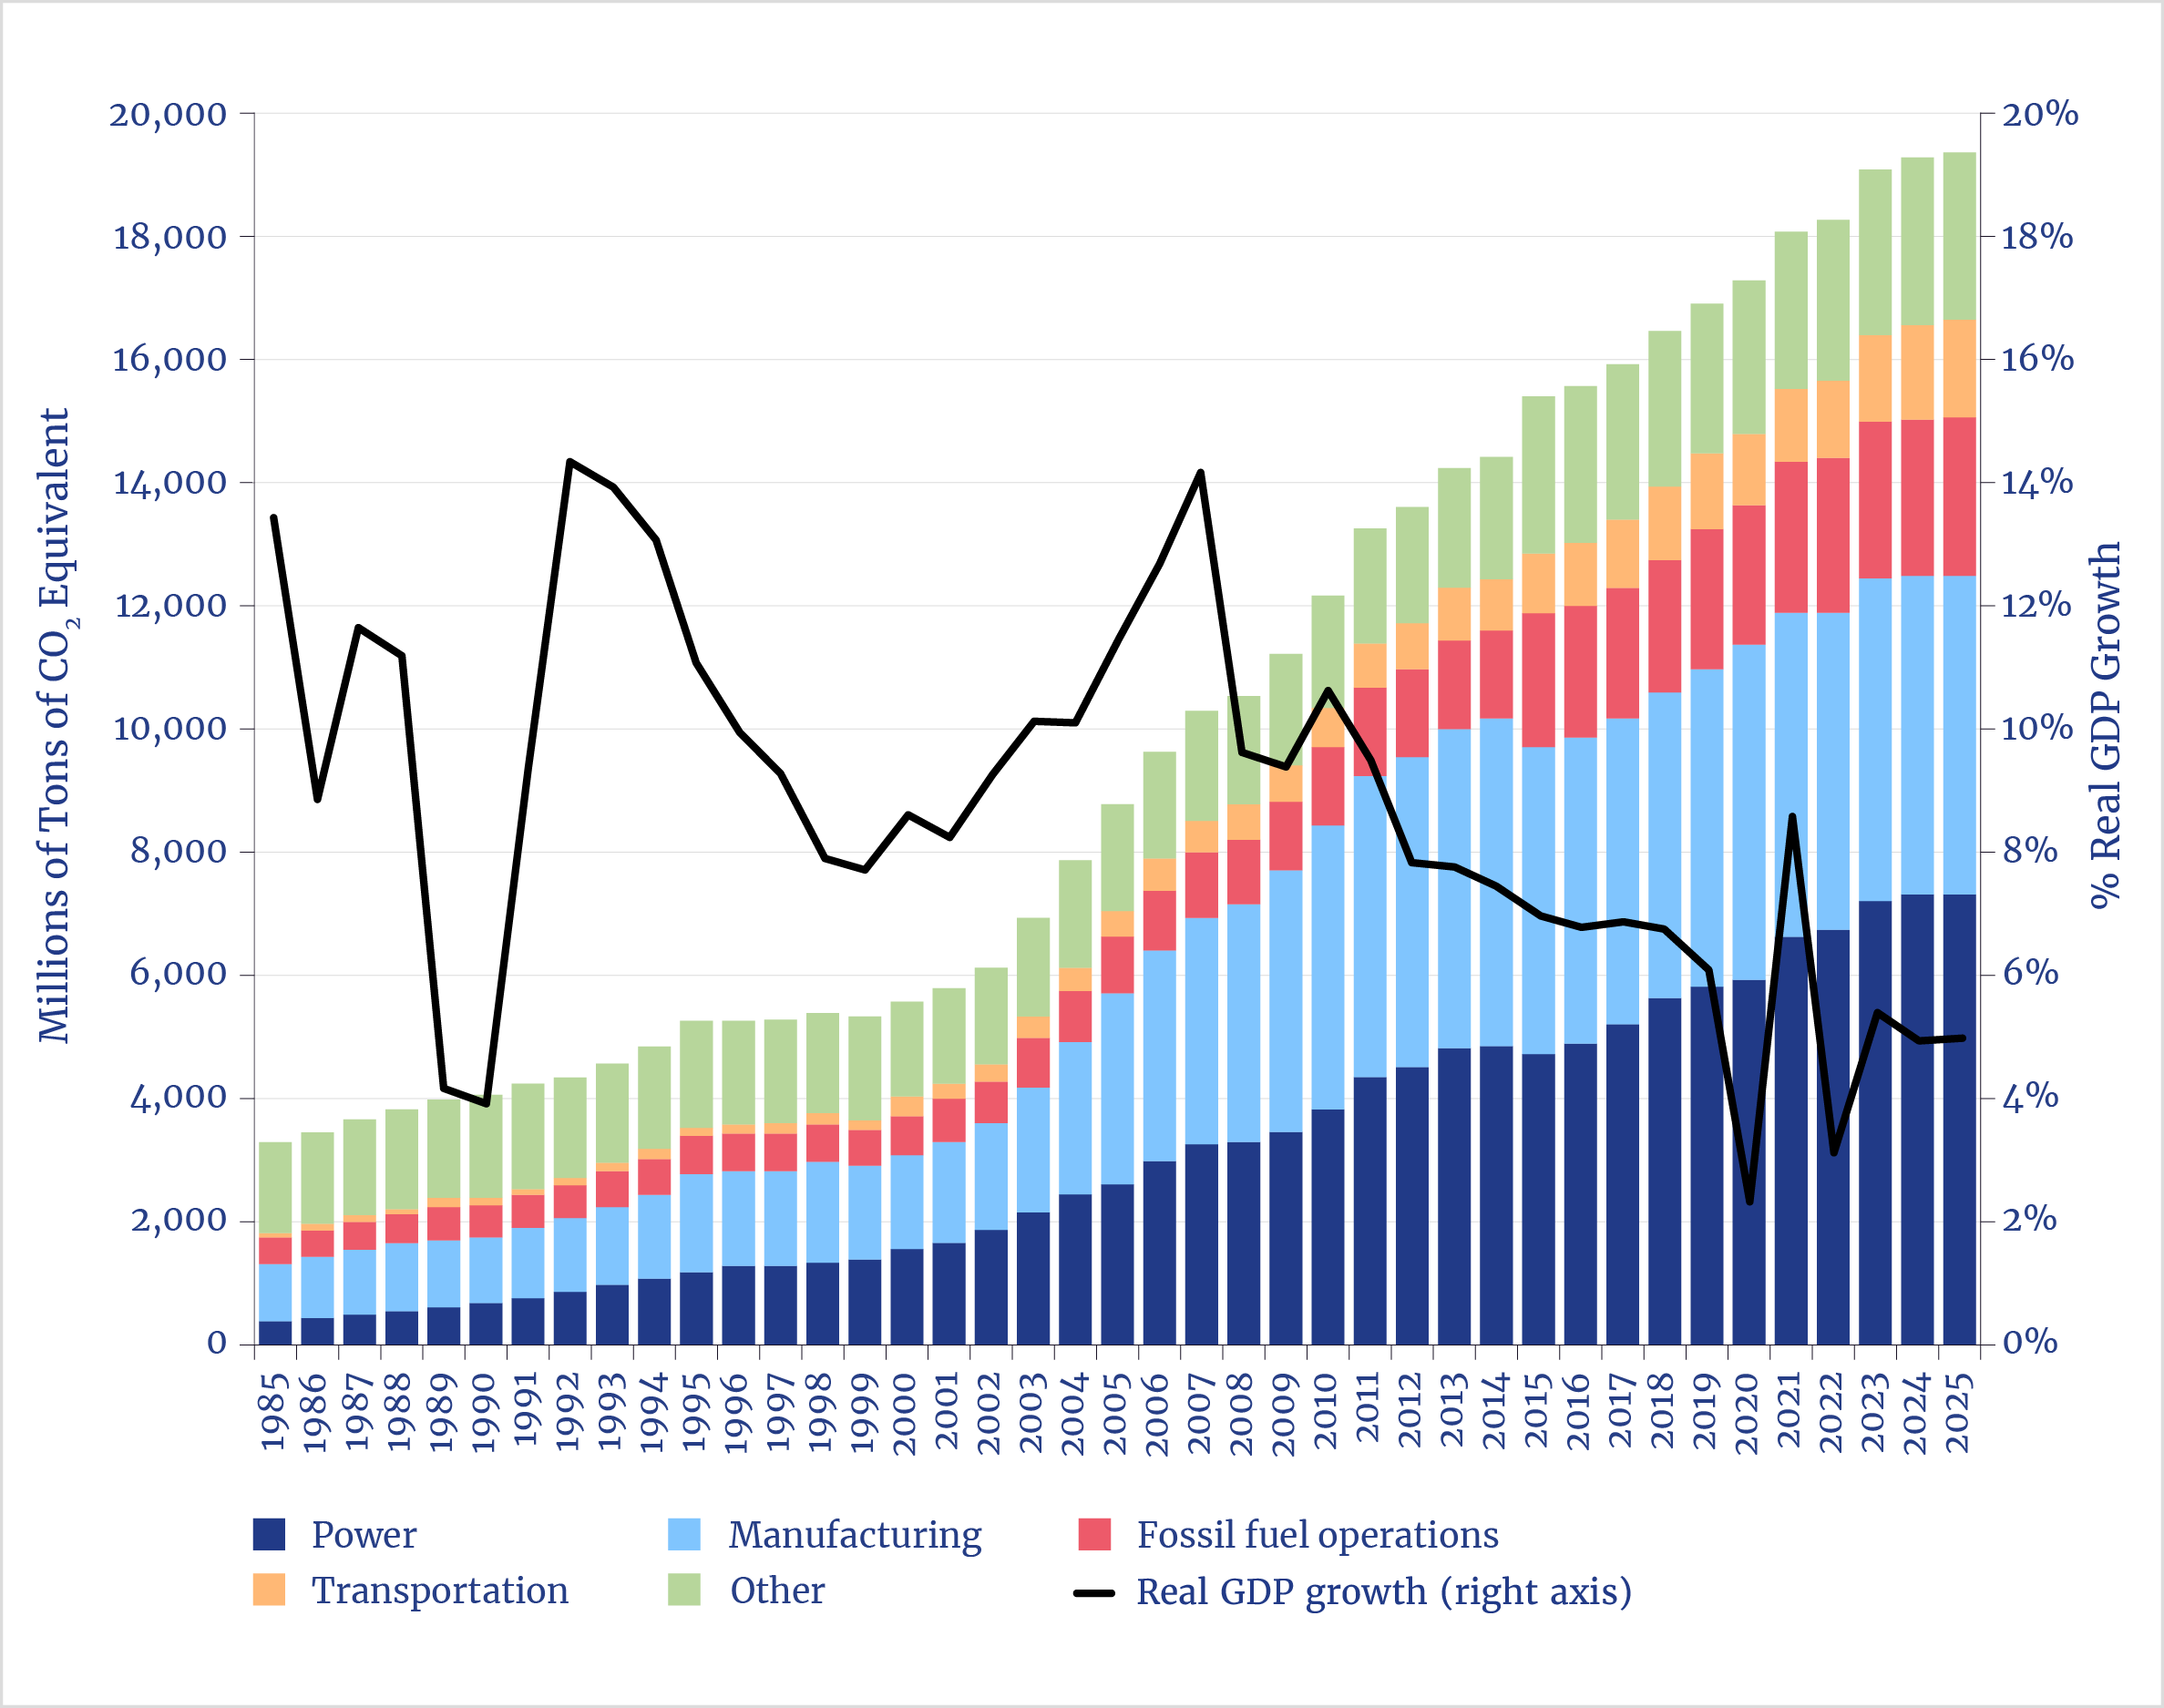
Note: This excludes emissions from land use, land-use change, and forestry.
Sources: Data from “China Country Fact Sheet,” EDGAR – Emissions Database for Global Atmospheric Research, Joint Research Centre, European Commission, accessed June 12, 2026, https://edgar.jrc.ec.europa.eu/country_profile/CHN; “Country/Territory Inventory: China,” Climate TRACE, accessed June 12, 2026, https://climatetrace.org/inventory?region=China+%28CHN%29%3A1%3ACHN%3Acountry; and World Bank Group, “GDP Growth (Annual %), China,” Data, World Bank Group, accessed June 12, 2026, https://data.worldbank.org/indicator/NY.GDP.MKTP.KD.ZG?locations=CN. Values in these sources were given in metric units.
For its part, China has committed only to peaking its economy-wide net greenhouse gas emissions by 2030 and then reducing emissions by 7%–10% below that peak level by 2035.18 It has set no explicit, binding nominal targets for its national emissions. Rather, its most recent Five-Year Plan for National Economic and Social Development (the 15th Five-Year Plan [FYP], which covers 2026–30 and was released in March 2026) includes a separate chapter on climate and the environment but offers only a cryptic carbon-intensity goal: reducing CO2 emissions per unit of GDP by a cumulative 17% over the period.19 China’s 2035 Nationally Determined Contribution report, which was submitted to the United Nations, falls well short of the emissions trajectory needed to align with the goals of the 2015 Paris Agreement, yet the Chinese government continues to receive the benefit of the doubt from many observers based on its pledge that it will “strive to do better.”20 Meanwhile, despite all the international focus on climate, the 15th FYP pays limited attention to China’s more immediate environmental challenge: improving urban air quality by reducing particulate-matter pollution in its major cities.21
Myth #2: China’s Economy Is Transitioning Away from Fossil Fuels
Closely linked to the first myth is the claim that China is rapidly transitioning its economy away from fossil fuels and increasingly running on renewables such as wind and solar. Ember, a clean-energy think tank, has reported that China’s “energy-related fossil fuel use” is now peaking due to its accelerated deployment of “clean electro-technologies.”22 The hard data tell a different story.
Figure 2 shows China’s primary energy consumption by source (using the substitution method)23 from 1985 to 2025. Over the last 40 years, aggregate consumption of coal, crude oil, and natural gas has jumped nearly sixfold. Even over the past decade, as China was entering its green-energy heyday, fossil fuel demand has grown by roughly 27%. Mirroring the trend in overall emissions, China’s fossil fuel demand shows no sign of peaking. Since 2015, the country has continued to build out its fossil fuel infrastructure to keep pace with consumption, which does not suggest plans to wean itself from fossil fuels anytime soon. China remains the world’s largest coal producer; domestic production (both thermal and metallurgical) hit a record of nearly 5 billion tons in 2025, more than the rest of the world combined.24 Demand from the electricity and steel sectors has continued to grow—so much so that the world’s largest coal producer still needs to import coal.25 Domestic oil and gas production has also risen steadily, though China remains heavily reliant on imports to satisfy its domestic needs.26 China has continued to expand its storage and processing capacities for both these hydrocarbons. Its oil-refining capacity has expanded 24% since 2016 to approximately 18.5 million barrels per day in 2025, equal to that of the United States despite having an economy roughly one-third smaller.27 China is also the world’s top importer of liquefied natural gas (LNG),28 alongside significant pipeline imports of natural gas from neighboring countries. Overall, China has built some of the newest and most extensive fossil fuel infrastructure in the world, expanding capacity rather than phasing it out.
While Chinese government mandates, subsidies, and import restrictions have driven a significant ramp-up of renewables in recent years, the effect has been additive, not displacive. As with the global energy mix overall, China has diversified its fuel sources but made no discernible moves to transition away from fossil fuels. As of 2025, fossil fuel energy still accounted for 78% of China’s primary energy consumption, while wind, solar, geothermal, and biofuels made up roughly 12%. China’s latest FYP sets a relatively modest target of increasing the proportion of non–fossil fuel energy (including nuclear and hydropower) to 25% of total energy consumption by 2030, up from 22% in 2025.29 Rather than pursuing rapid decarbonization, China appears to be following a pragmatic—and perfectly legitimate—all-of-the-above energy strategy, one that continues to expand and modernize fossil fuel infrastructure as well as dispatchable power sources such as nuclear and hydropower.
Figure 2. China’s Primary Energy Consumption, by Source: 1985–2025
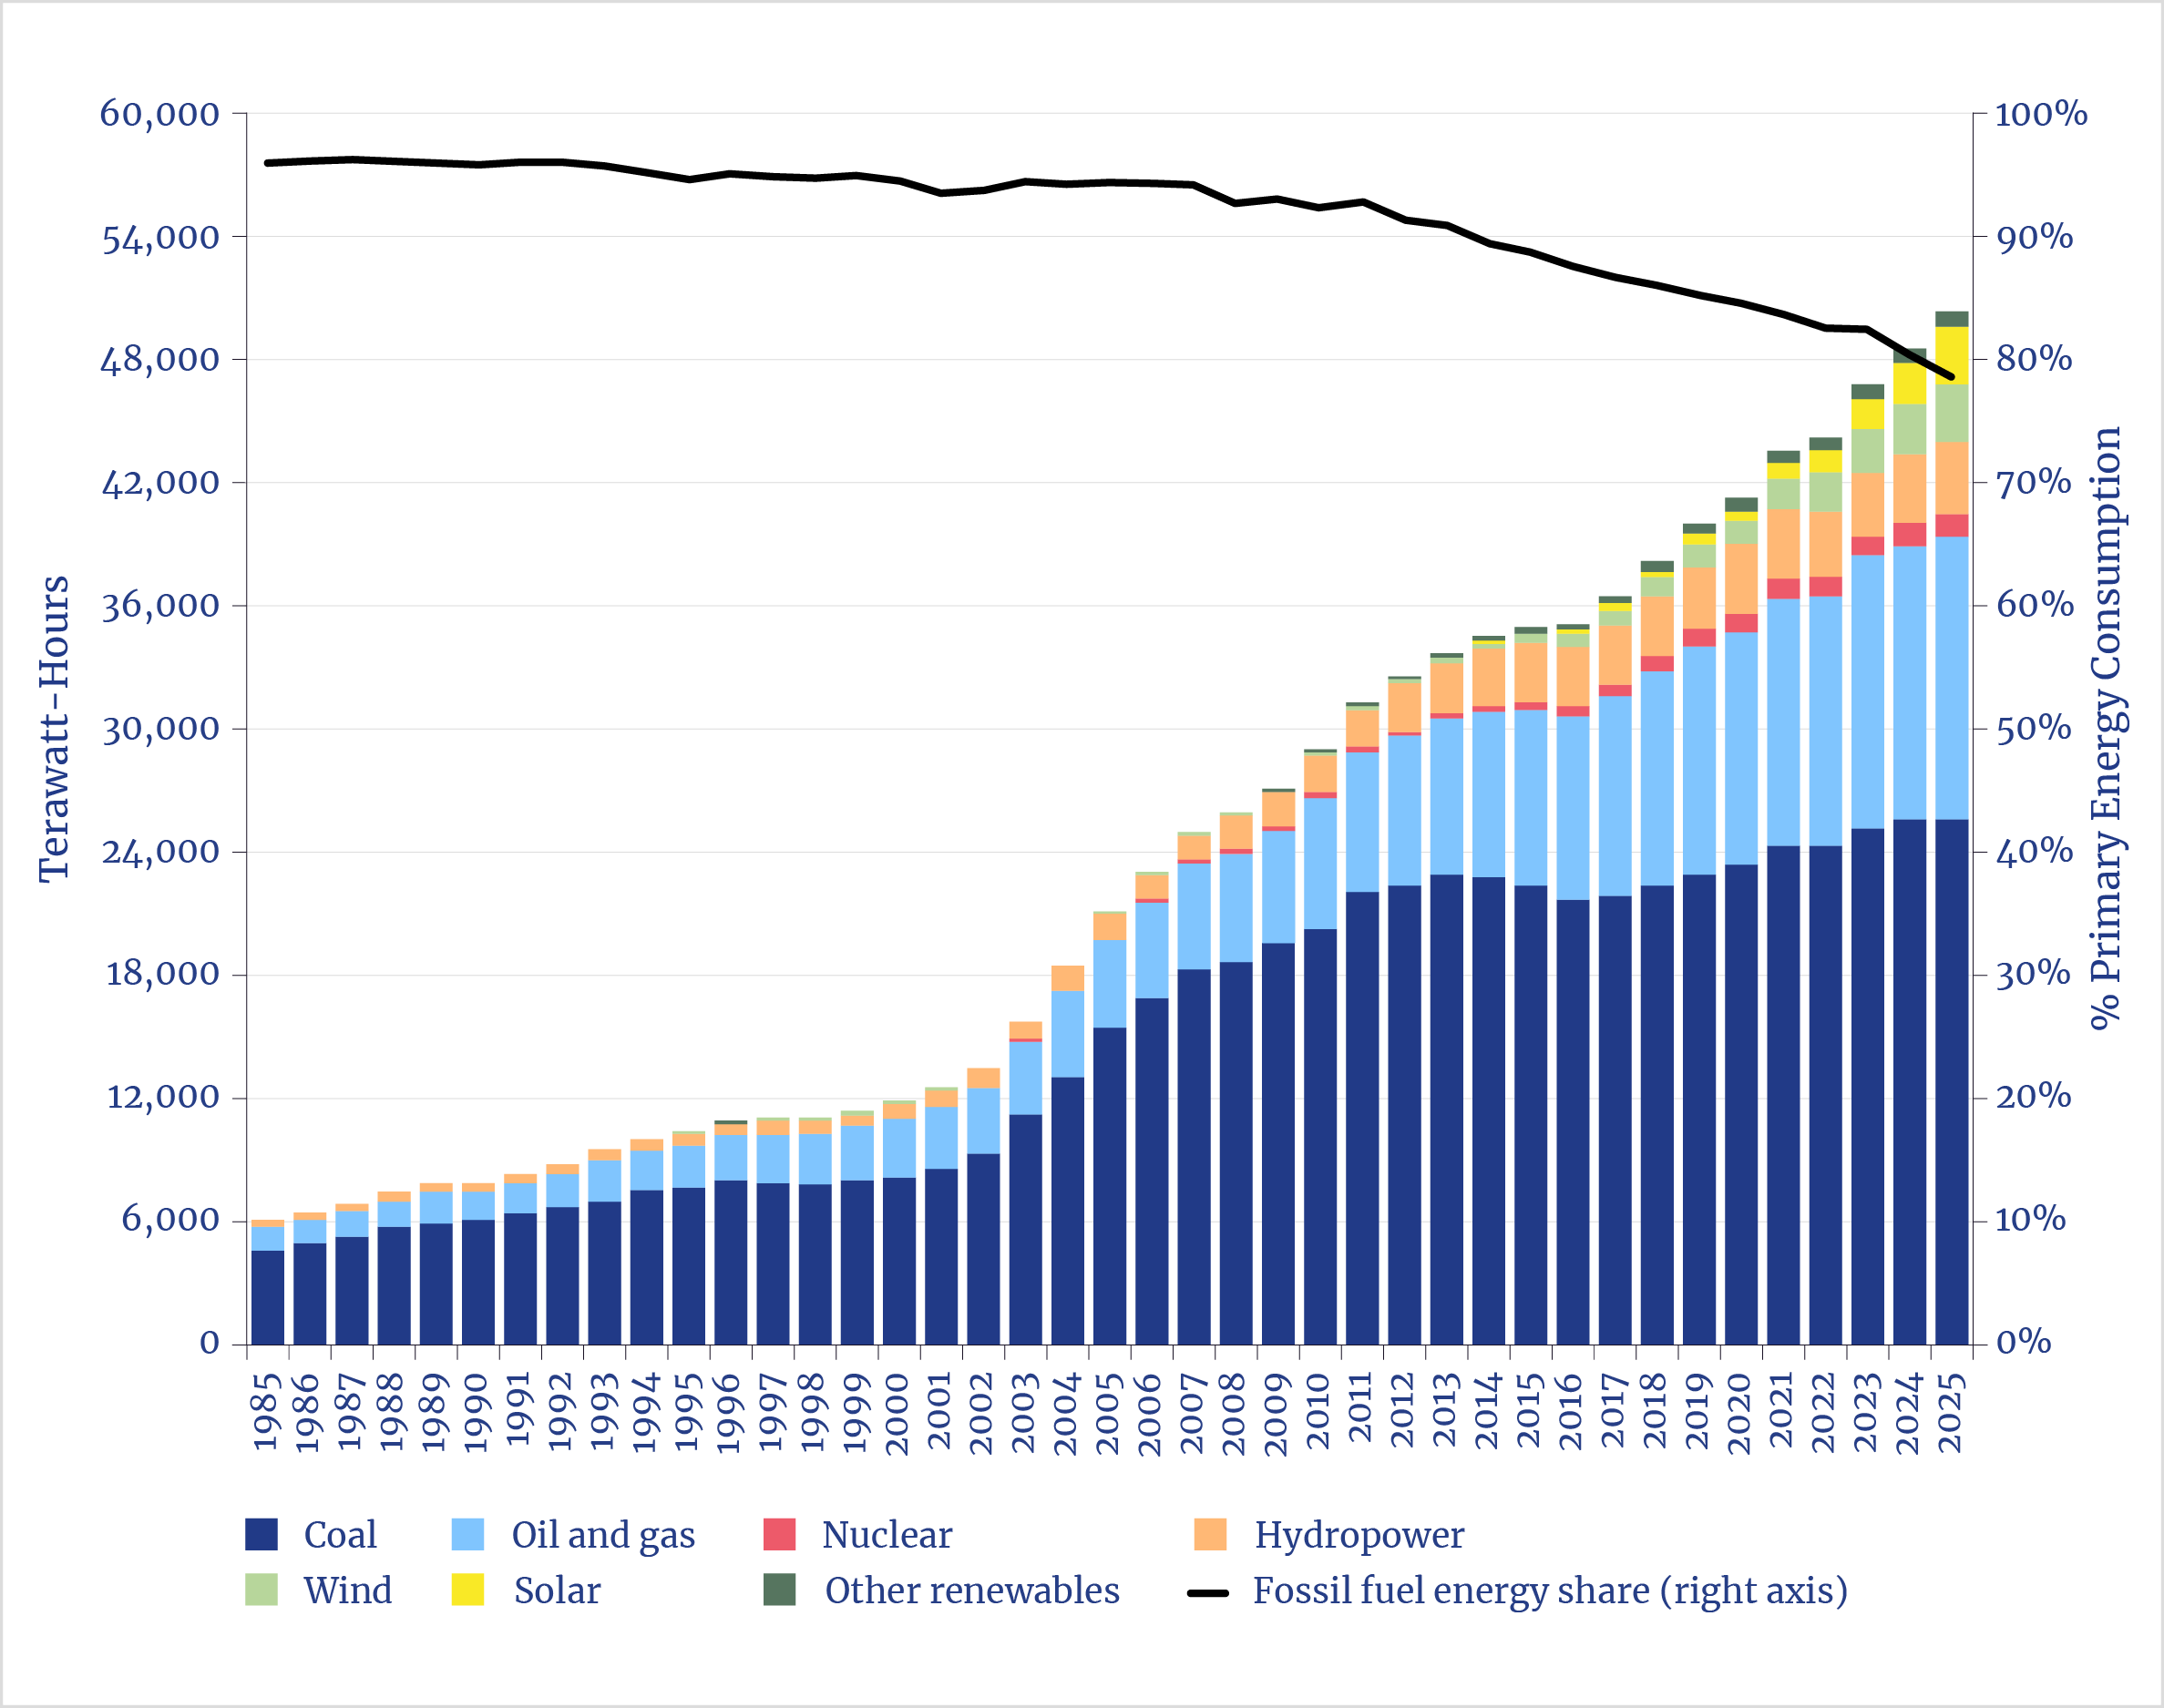
Note: Data were measured using the substitution method. Other renewables includes geothermal, biomass, and biofuels.
Sources: Data from “Energy Consumption by Source, China,” Our World in Data, accessed June 18, 2026, https://ourworldindata.org/grapher/energy-consumption-by-source-and-country?stackMode=absolute&country=~CHN; Energy Institute, 2025 Statistical Review of World Energy, 74th ed. (Energy Institute, 2025); and “National Data: Annual,” National Bureau of Statistics of China, accessed June 18, 2026, https://data.stats.gov.cn/dg/website/page.html#/pc/national/en/yearData.
Myth #3: China Is Becoming a Clean Electric Superpower
The third major energy myth to bust is the claim that China is rapidly electrifying its economy and increasingly running it on clean power. This two-part assertion does not hold up to scrutiny. Ember extolled China’s “green electrification,”30 the like-minded Rocky Mountain Institute hailed it as “the first major electrostate” that is “quietly electrifying all its end-use sectors,”31 and the International Energy Agency (IEA) noted that “electrification is progressing rapidly in China.”32 The IEA added that “a power sector dominated by renewables provides the foundation for China’s clean energy transition.”33
Figure 3 shows the 40-year trend in China’s total electricity generation in terawatt-hours (TWh) by fuel source. Between 1985 and 2025, China’s electricity generation grew more than sixfold and reached 10,536 TWh in 2025—more than double the U.S.’s record 4,430 TWh that same year.34 This four-decade surge accelerated after China’s accession to the World Trade Organization in 2001, which drove massive outsourcing of manufacturing capacity from the West to China as part of the cost-cutting globalization craze. China’s explosive growth in EV manufacturing over the past decade has added to this long-term trend by helping to electrify the transport sector on the margin, although gasoline demand has remained relatively unchanged at the national level.35 The growing proliferation of Chinese artificial intelligence data centers36 has provided a further boost to power demand in recent years. While the share of electricity in China’s primary energy consumption has increased from about 12% in 2001 to an estimated 24% in 2025, this remains only modestly above the U.S. level (19% in 2024),37although certain third-party climate organizations have estimated China’s electricity share much higher, in the 30%–35% range.38
Figure 3. China’s Electricity Generation, by Source: 1985–2025

Note: Electricity share of primary energy was measured as a percentage of total direct primary energy consumption (including inefficiencies and energy lost in the combustion of fossil fuels). Other renewables includes geothermal, biomass, and biofuels.
Sources: Data from “Electricity Production by Source, China,” Our World in Data, accessed June 18, 2026, https://ourworldindata.org/grapher/energy-consumption-by-source-and-country?stackMode=absolute&country=~CHN; “Electricity as a Share of Primary Energy, 1985 to 2024,” Our World in Data, accessed June 19, 2026, https://ourworldindata.org/grapher/electricity-as-a-share-of-primary-energy?tab=line&country=~CHN&mapSelect=~CHN; Energy Institute, 2025 Statistical Review of World Energy, 74th ed. (Energy Institute, 2025); and “Electricity Generation in China,” Electricity Data Explorer, Ember, accessed June 19, 2026, https://ember-energy.org/data/electricity-data-explorer/?entity=China.
Moreover, as figure 3 shows, China’s rising electricity demand continues to be largely met by fossil fuels—especially coal—rather than renewables. China’s annual coal-fired power generation has nearly tripled over the past two decades, even as coal plants were being shut down for climate reasons in the U.S. and much of the developed world. In 2025, coal, crude oil, and natural gas together still accounted for roughly 58% of China’s electricity production, while wind and solar combined reached 22%. Given China’s burgeoning coal capacity and the low capacity factors of many renewable plants, fossil fuels—particularly coal—are likely to remain the backbone of China’s grid for many years to come.
As seen in figure 4, China has a massive pipeline of projects aimed at expanding its already-enormous 2025 electricity-generation capacity—which is nearly three times larger than that of the United States39—by approximately 83%, to keep pace with projected domestic demand. Notably, this planned capacity is roughly evenly split between dispatchable sources (coal, natural gas, nuclear, and hydropower) and variable renewables (wind and solar). Even after these additions, China’s total dispatchable generation capacity is projected to increase by 73% even as renewables increase from 47% to a pro forma 50% of nameplate capacity. Despite headlines suggesting that renewables are taking over China’s electricity system, the reality is that China continues to aggressively expand its coal-fired and other dispatchable power generation. This serves to anchor its grid and compensate for the intermittency and relatively low average capacity factors of its renewable stack—especially its heavy weighting toward distributed rooftop solar photovoltaic (PV) generation, which currently makes up roughly 46% of solar capacity and operates at much lower utilization rates.40
Figure 4. China’s Electricity-Generation Capacity, Pro Forma: 2025

Note: 2025 operating capacity includes distributed (less than 1 megawatt [MW]) and utility-scale (1 MW or greater) capacity, while planned solar capacity additions include only utility-scale projects. In development includes projects that have been announced or permitted or those currently under construction.
Source: Data from “Global Integrated Power Tracker,” Global Energy Monitor, accessed June 12, 2026, https://globalenergymonitor.org/projects/global-integrated-power-tracker.
Perspective
China sits at the very center of the global climate and energy transition narrative, which explains the intense focus on the country as the milestone year of 2030 approaches. As shown in figure 5, China remains the world’s largest greenhouse gas emitter and the largest consumer of fossil fuel energy, while simultaneously dominating global manufacturing of key clean-energy technologies such as EVs, solar panels, and wind turbines. As the IEA stated nearly five years ago, “There is no plausible path to limiting the global temperature rise to 1.5 degrees Celsius [2.7 degrees Fahrenheit] without China”41 making substantial progress in reducing its emissions. By the same logic, there is no credible narrative of a global energy transition that does not heavily feature China’s renewables statistics. In 2025, global clean-energy investment totaled $2.3 trillion, of which China accounted for roughly $800 billion (35%).42 From an energy perspective, China is best described as a two-headed dragon: It pursues a deliberately bifurcated strategy that aggressively promotes both fossil fuels and low-carbon alternatives. The latter, while impressive in scale, remains largely additive and performative rather than truly transformative.
Figure 5. China’s Share of the Global Energy Narrative, 2025
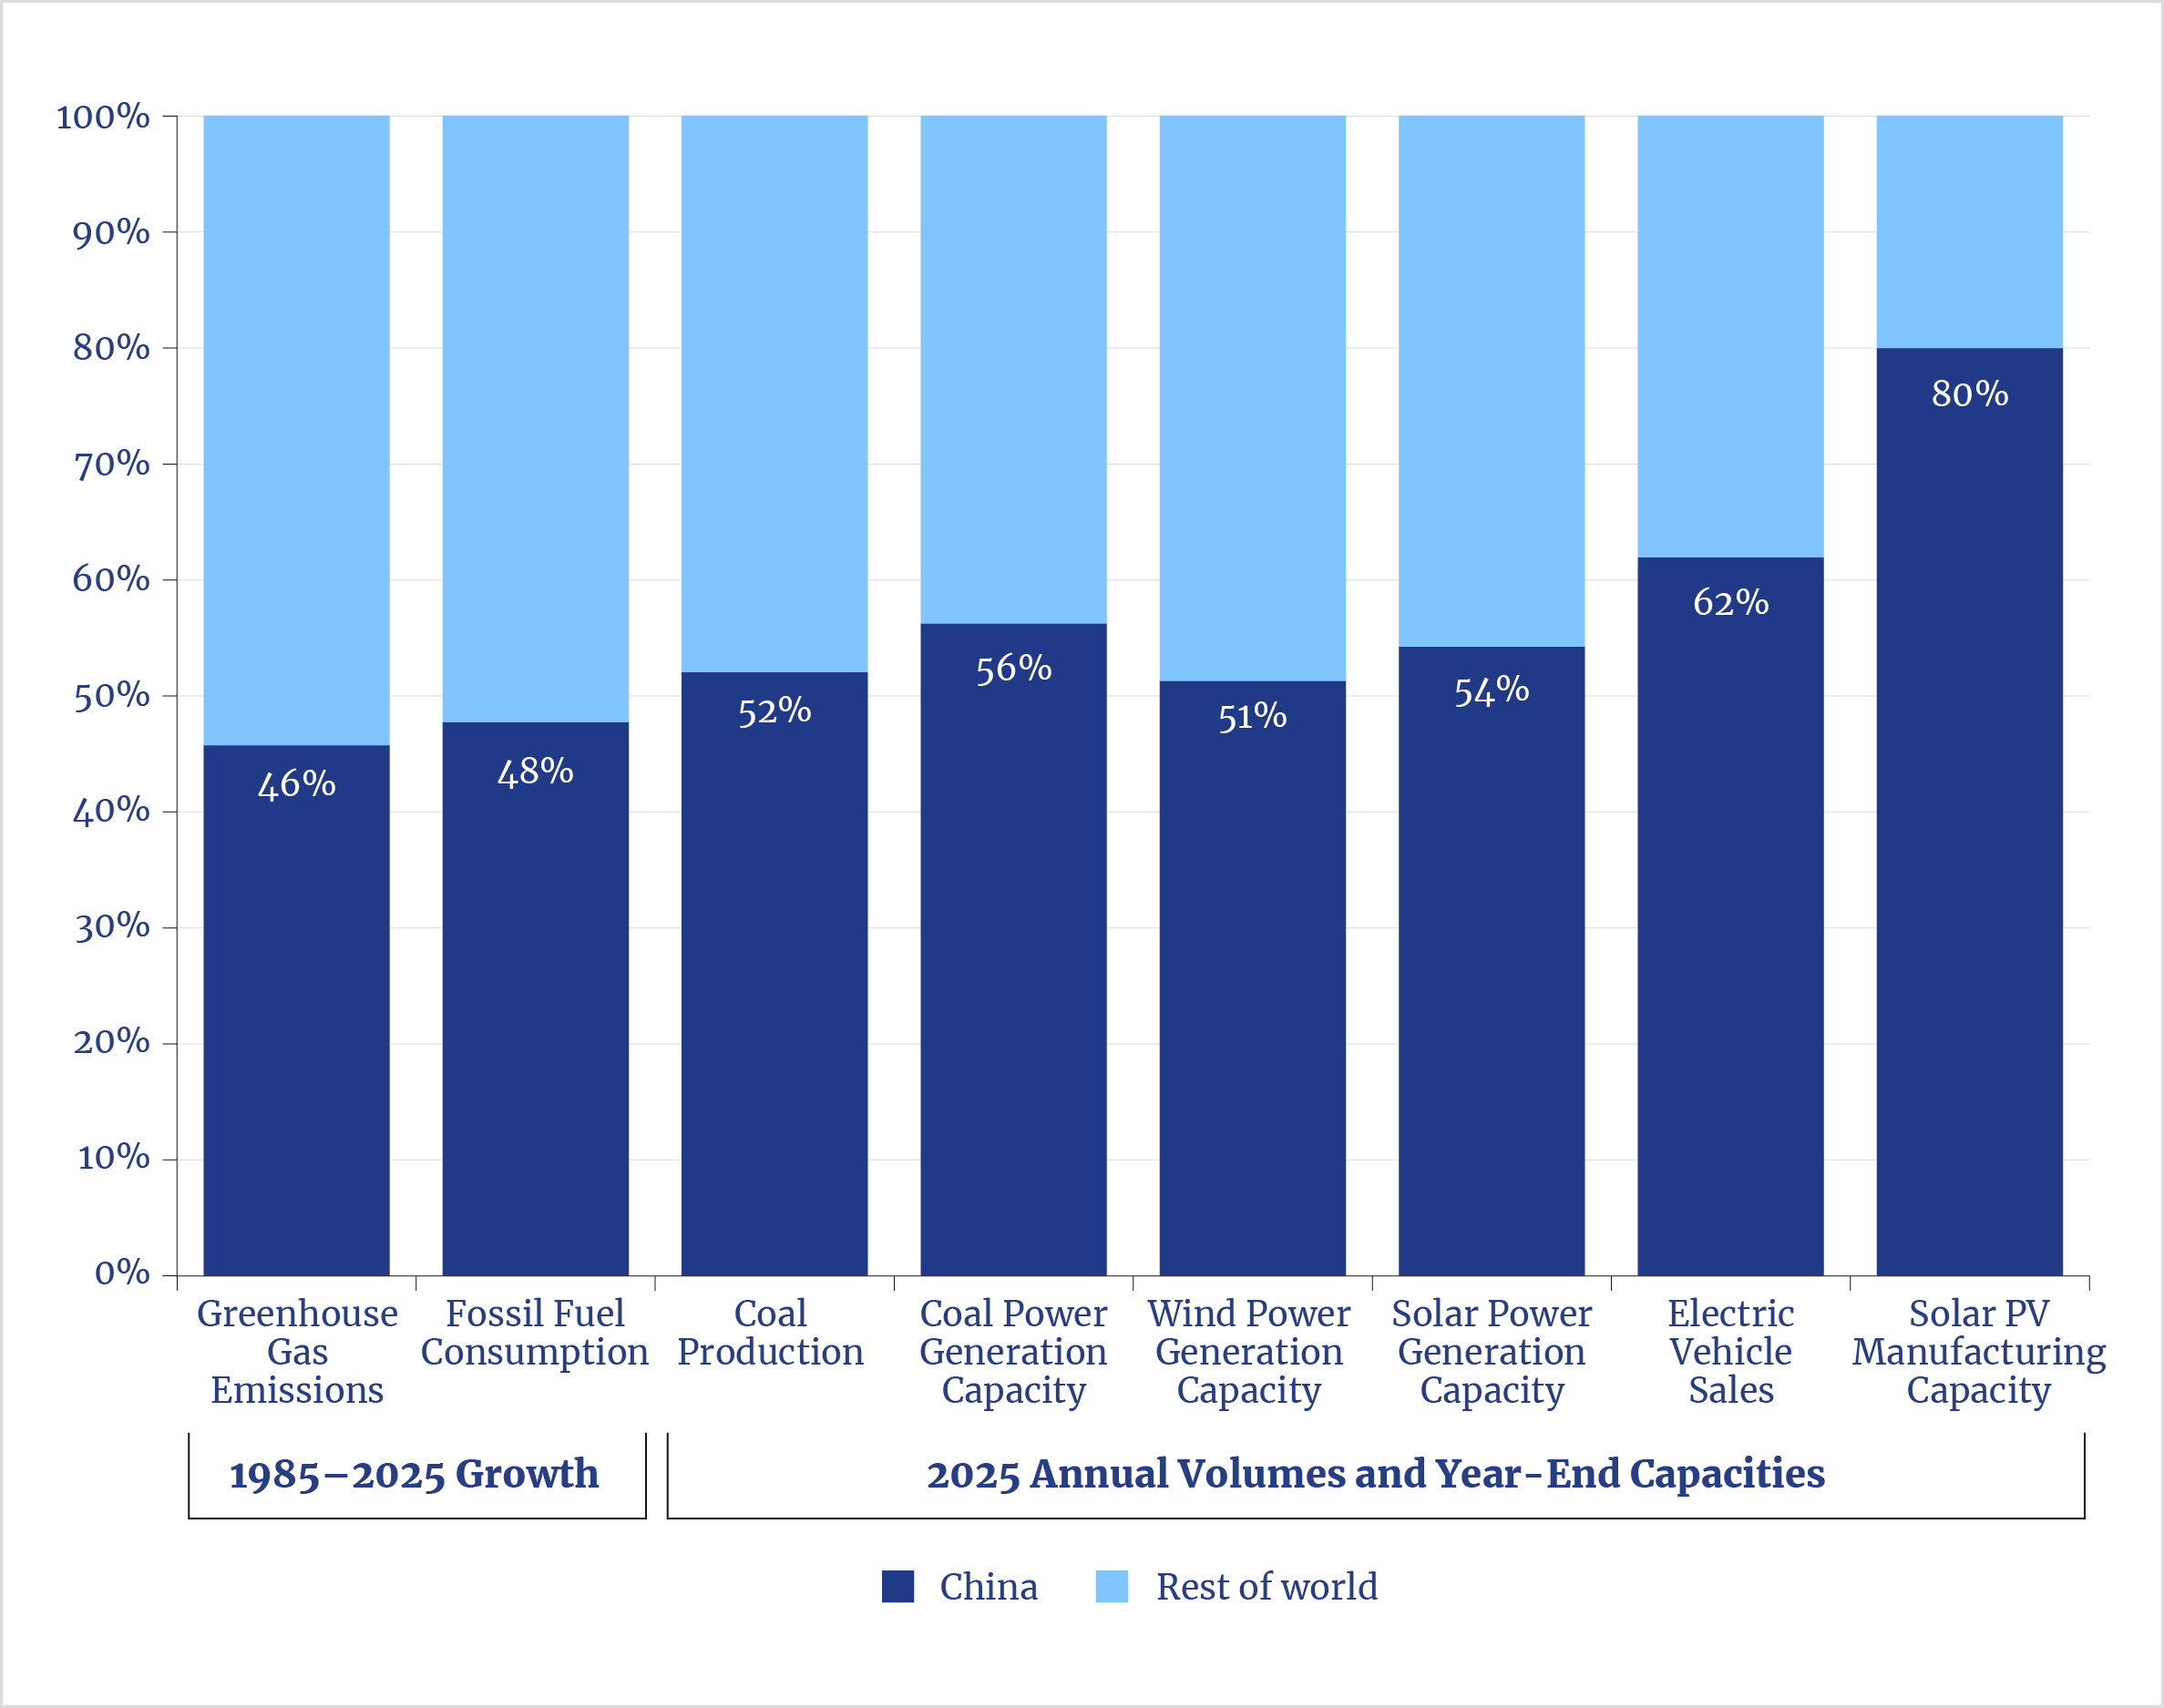
Note: Greenhouse gas emissions excludes emissions from land use, land-use change, and forestry. Fossil fuel consumption was calculated using the substitution method. Solar power generation capacity includes distributed (less than 1 megawatt [MW]) and utility-scale (1 MW or greater) projects. Coal production and solar PV manufacturing capacity percentages were based on 2025 estimates.
Sources: Data from “China Country Fact Sheet,” EDGAR – Emissions Database for Global Atmospheric Research, Joint Research Centre, European Commission, accessed June 18, 2026, https://edgar.jrc.ec.europa.eu/country_profile/CHN; “Country/Territory Inventory: China,” Climate TRACE, accessed June 18, 2026, https://climatetrace.org/inventory?region=China+%28CHN%29%3A1%3ACHN%3Acountry; “Energy Consumption by Source, China,” Our World in Data, accessed June 18, 2026, https://ourworldindata.org/grapher/energy-consumption-by-source-and-country?stackMode=absolute&country=~CHN; Energy Institute, 2025 Statistical Review of World Energy, 74th ed. (Energy Institute, 2025); “National Data: Annual,” National Bureau of Statistics of China, accessed June 18, 2026, https://data.stats.gov.cn/dg/website/page.html#/pc/national/en/yearData; International Energy Agency (IEA), “Supply,” in Coal Mid-Year Update 2025 (IEA, 2025), 13–15; “Global Integrated Power Tracker,” Global Energy Monitor, accessed June 12, 2026, https://globalenergymonitor.org/projects/global-integrated-power-tracker; The EV Report Staff, “Global EV Sales Hit Historic Milestone in 2025: A Country-by-Country Breakdown,” The EV Report, January 20, 2026; and IEA, “Executive Summary,” in Solar PV Global Supply Chains (IEA, 2022), 7–12.
Climate and renewable-energy advocates who urge the U.S. to follow China’s clean-energy path overlook a fundamental contradiction: Despite its green veneer, China’s economy still runs overwhelmingly on coal, crude oil, and natural gas. The Chinese government’s overriding priorities remain rapid economic growth, industrial development, and raising living standards—not world-leading decarbonization. Moreover, the argument for being like China ignores the profound differences between political and economic systems. China’s renewables push in recent years has been driven by top-down directives under its centrally planned state capitalism,43 not market demand. The result has been wasteful capital allocation, chronic overcapacity, and widespread industry consolidation. In addition to building redundant dispatchable generation capacity to back up intermittent renewables, China has been forced to build long-distance high-voltage transmission lines to connect remote wind and solar farms to population centers.
Today, China faces significant domestic oversupply problems in both EVs and solar PV panels. Nearly 400 Chinese EV makers have gone out of business since 2018,44 while more than 40 solar companies went bankrupt, merged, or were delisted in 2024 alone, resulting in roughly 87,000 job losses.45 Much of this excess production of EVs and solar PV panels is now being dumped onto global markets at below-cost prices46—which, in turn, helps to increase technological and economic dependency on China, much like the debt-trap model employed in its Belt and Road Initiative.47 It makes little economic sense for the U.S. private sector to effectively build a domestic clean-energy industry from scratch while competing against heavily subsidized Chinese overcapacity—especially given that current federal climate policy is shifting away from large-scale subsidies for renewables. Nor is it prudent for American companies to become reliant on Chinese technology, components, or critical minerals, given existing supply-chain vulnerabilities and cybersecurity issues with China.
- The Economist, “China’s Clean-Energy Revolution Will Reshape Markets and Politics,” The Economist, November 6, 2025.
- Amy Hawkins, “China’s CO2 Emissions Have Peaked or Will in 2025, Say 44% of Experts in Survey,” The Guardian, November 26, 2024.
- Muyi Yang et al., China Energy Transition Review 2025 (Ember, 2025).
- Alex Kimani, “China Is on Its Way to Becoming World’s First ‘Electrostate’,” OilPrice.com, May 22, 2025.
- Jo Lauder, “Why China Is Becoming the World’s First Electrostate,” ABC News, August 12, 2025.
- Christian Shepherd and Jinpeng Li, “How China Came to Dominate the World in Renewable Energy,” The Washington Post, March 3, 2025.
- Pep Canadell et al., “The World’s Carbon Emissions Continue to Rise. But 35 Countries Show Progress in Cutting Carbon,” The Conversation, November 12, 2025. This article was republished by the Commonwealth Scientific and Industrial Research Organisation on November 13, 2025.
- Ilaria Mazzocco, “Rethinking Competition with China on Clean Technologies,” in Staying Ahead in the Global Technology Race: A Roadmap for Economic Security, edited by Navin Girishankar (Center for Strategic & International Studies, 2024), 37–39.
- The Economist, “Green Leap Forward: China’s Renewables Revolution,” The Economist, November 10, 2025.
- Bryan Dawson, “Powering Security: Renewable Energy Is a National Defense Imperative,” Armed with Reason (blog), January 26, 2026.
- Lauri Myllyvirta, “Analysis: China’s CO2 Emissions Have Now Been Flat or Falling for 18 Months,” Carbon Brief, November 11, 2025.
- Lauri Myllyvirta, “Analysis: China’s CO2 Emissions Have Now Been ‘Flat or Falling’ for 21 Months,” Carbon Brief, February 12, 2026.
- Data series from the European Commission and Climate TRACE were broadly consistent with the 2014 country-level emissions reported by China in its Second Biennial Update Report on Climate Change, which was submitted to the secretariat of the United Nations Framework Convention on Climate Change. Since 2015, Climate TRACE data have included international aviation and shipping emissions and granular subsector detail.
- Jeremy Mark, “China’s Property Slump Deepens—and Threatens More than the Housing Sector,” Atlantic Council, January 28, 2026.
- Jia lun Ong, “China’s Cement Output Declines amid Weak Demand; Indonesia Sees Similar Trend,” S&P Global, September 24, 2025.
- The Straits Times, “China’s Waste Import Ban Upends Global Recycling Industry,” The Straits Times, January 21, 2018.
- Dominique Mosbergen, “China No Longer Wants Your Trash: Here’s Why That’s Potentially Disastrous,” HuffPost, January 24, 2018.
- “China’s 2035 Nationally Determined Contribution Report,” Law and Environment Assistance Platform, United Nations Environment Programme, November 3, 2025, https://leap.unep.org/en/countries/cn/national-legislation/chinas-2035-nationally-determined-contribution-report.
- Arendse Huld, “The Path to Peak Emissions: Climate and Environmental Policy in China’s 15th Five-Year Plan,” China Briefing, April 23, 2026.
- Institute for Governance & Sustainable Development, “A First Look at China’s 2035 NDC: Headline Targets and Non-CO2 Action,” November 3, 2025.
- China has only committed to lowering the PM2.5 air concentration (i.e., fine inhalable particles with diameters of 2.5 micrometers and smaller) in its largest cities (i.e., municipalities above the prefectural level) from 28 ug/m3 in 2025 to below 27 ug/m3 by 2030. For perspective, this compares with an actual median PM2.5 level in the United States of 7.3 ug/m3 in 2024, down from 13.5 ug/m3 in 2000, based on air-quality data tracked by the U.S. Environmental Protection Agency (EPA); see “Particulate Matter (PM2.5) Trends,” EPA, last updated February 19, 2026.
- Yang et al., China Energy Transition Review 2025, 6.
- The substitution method for calculating primary energy consumption applies a thermal efficiency factor (0.46, as applied by the Energy Institute in 2024) to non–fossil fuel energy sources such as renewables to adjust for the energy lost in the form of wasted heat during the combustion of coal, crude oil, and natural gas. The effect of this adjustment, which corrects nuclear and renewables to their primary input equivalents, is to gross up the contribution of wind and solar power in China’s total primary energy mix—more than doubling it from 4.29% when measured directly as a straight percentage to 9.24% in 2024 using the substitution method.
- Bloomberg News, “China’s Coal Output Hits Record in 2025 Even as It Burns Less,” Mining.com, January 19, 2026.
- “China: Coal,” Countries & Regions, International Energy Agency (IEA), https://www.iea.org/countries/china/coal.
- Energy Institute, 2025 Statistical Review of World Energy, 74th ed. (Energy Institute, 2025), 26, 34, 37, 42.
- Energy Institute, 2025 Statistical Review, 31.
- Bella Weetch, “China Became the World’s Largest LNG Importer in 2021,” Hydrocarbon Engineering, April 8, 2022.
- Huld, “The Path to Peak Emissions.”
- Muyi Yang et al., “Powering China’s New Era of Green Electrification,” Ember, May 13, 2025.
- Sam Butler-Sloss et al., “The Race to the Top in Six Charts and Not Too Many Numbers,” Rocky Mountain Institute, July 1, 2024.
- IEA, Electricity 2025 (IEA, 2025), 7.
- IEA, An Energy Sector Roadmap to Carbon Neutrality in China (IEA, 2021), 15.
- Kimberly Peterson, “U.S. Electricity Generation in 2025 Hit a Record, Again,” Today in Energy, March 5, 2026.
- “China Gasoline: Actual Consumption,” CEIC Data, accessed June 12, 2026, https://www.ceicdata.com/en/china/gasoline-apparent-consumption--actual-consumption/cn-gasoline-actual-consumption.
- Simeng Deng et al., “China’s Data Center Capacity Set to Top 60 GW by 2030, Driving a Doubling of Power Demand,” Rystad Energy, April 29, 2026.
- “Electricity as a Share of Primary Energy, 2024,” Our World in Data, accessed June 12, 2026, https://ourworldindata.org/grapher/electricity-as-a-share-of-primary-energy.
- Yang et al., China Energy Transition Review 2025, 14.
- “Table 4.3. Existing Capacity by Energy Source, 2024,” Electric Power Annual, U.S. Energy Information Administration, https://www.eia.gov/electricity/annual/table.php?t=epa_04_03.html.
- “Global Solar Power Tracker,” Global Energy Monitor, accessed June 12, 2026, https://globalenergymonitor.org/projects/global-solar-power-tracker.
- IEA, An Energy Sector Roadmap to Carbon Neutrality in China (IEA, 2021), 13.
- BloombergNEF, “BloombergNEF Finds Global Energy Transition Investment Reached Record $2.3 Trillion in 2025, Up 8% from 2024,” press release, January 26, 2026.
- Scott Kennedy and Jude Blanchette, Chinese State Capitalism: Diagnosis and Prognosis (Center for Strategic & International Studies, 2021).
- Editorial Board, “400 Chinese EV Companies Ceased Operations Between 2018–2025, Only a Few Will Dominate Towards 2030,” EVBoosters, April 29, 2025.
- OGE Journal, “China’s Solar Boom Turns Sour, Triggering $60 Billion Industry Collapse and Massive Job Cuts,” OGE Journal, August 7, 2025.
- Rebecca Picciotto, “Yellen Warns China’s Surplus of Solar Panels, EVs Could Be Dumped on Global Markets,” NBC News, March 28, 2024.
- Alex Shaw, “China’s Belt and Road: A Global Debt Trap,” Global Business & Economics Journal, October 19, 2025.
-6%20(9).png)
-6%20(8).png)