Batteries and the Grid: Hype, Hope, and Economic Reality
-6%20(9).png)
A PJM-based analysis finds a wind-solar-battery grid is physically implausible and cost-prohibitive—costing ratepayers over $4 trillion, roughly six times a natural gas and nuclear system.
Listen
Executive Summary
Can electric grids that are powered primarily by wind and solar power provide reliable and affordable electricity when coupled with battery storage? Although advocates insist that it is feasible, this study demonstrates that a wind-solar-battery policy to meet electricity demand is physically implausible, cost-prohibitive, and unjustifiable on the basis of goals to reduce CO2 emissions.
While the quantity of battery storage has grown rapidly, it remains a minuscule share of total U.S. electricity consumption. At the beginning of 2026, total grid-scale battery storage could supply about 15 minutes of average U.S. electricity demand.
This study evaluated the physical and economic feasibility of building a reliable electric system primarily powered by wind, solar, and battery storage. The analysis used a model of the PJM Interconnection system, the nation’s largest grid operator, which covers 13 states and the District of Columbia and serves more than 67 million people.
Using PJM’s long-term forecast through 2045, the study estimated the quantities of wind, solar, and storage batteries that would be needed under three scenarios: renewables only (RO), which consisted of wind, solar, batteries, and existing nuclear plants while retiring all coal and natural gas generation; natural gas and nuclear (NGN), which comprised existing and new natural gas generators along with new nuclear plants; and NGN+B, which added battery storage to replace gas-fired generators during peak demand periods.
The analysis showed that to compensate for the intermittency of solar and wind, roughly tenfold more total generating capacity would be required by 2045 under the RO scenario than the NGN scenario. The additional capacity would be needed not only to serve daily or seasonal variations in supply and demand but also to accommodate well-documented wind and solar droughts—that is, multiday periods with little to no sunshine or wind.
The study also estimated the total ratepayer electricity costs. For the RO scenario, the total costs paid by PJM ratepayers over the next 20 years would exceed $4 trillion—even after accounting for savings on fossil fuels (see table ES-1).
Table ES-1. Total PJM Customer Costs ($ Billions)
.png)
Source: Data from PJM Resource Adequacy Planning Department, 2025 PJM Long-Term Load Forecast Report (PJM, 2025); authors’ calculations.
Because the central rationale for pursuing an RO-type grid is to reduce carbon emissions, the study estimated the cost per ton of avoided emissions. The annual costs reached as high as $771 per ton of carbon avoided. For comparison, recent estimates of the social cost of carbon (i.e., the putative future impacts of carbon emissions) have ranged from about $180 per ton in 2025 to nearly $320 per ton in 2045.
Introduction
In the past decade, large, utility-scale battery storage facilities have been touted by wind and solar advocates as a key solution to the inherent intermittency of wind and solar power. According to the U.S. Energy Information Administration (EIA), at the end of March 2026, battery storage capacity exceeded 47,000 megawatts (MW), capable of providing about 130,000 megawatt-hours (MWh) of electricity.1 Another 66,000 MW of capacity is planned over the next five years.2
Thirteen states have battery storage targets or mandates. The largest is New York, which has mandated 6,000 MW of storage by 2030 under the Climate Leadership and Community Protection Act.3 Massachusetts is close behind, with a target of 5,000 MW of storage by 2030 that includes 2,500 MW by July 2026 under the state’s Energy Affordability, Independence, and Innovation Act.4 Virginia has a 3,100-MW mandate by 2035, to be acquired by that state’s two investor-owned electric utilities. Michigan has mandated 2,500 MW of storage by 2030, while New Jersey has mandated 2,000 MW by that same year.5
The quantities of deployed battery storage have increased rapidly, owing not only to state mandates but especially to federal subsidies. Those subsidies were first introduced under the Inflation Reduction Act of 2022 and continue to be offered under the One Big Beautiful Bill Act of 2025. Nevertheless, the amount of storage relative to electricity consumption is minuscule.
Total installed battery capacity in California as of March 2026 was 15,070 MW, or almost one-third of total U.S. battery storage capacity.6 That capacity corresponds to less than 60,000 MWh of electricity supply because it is composed primarily of four-hour batteries—that is, batteries designed to discharge their stored energy over four hours.7
Although these quantities of battery storage capacity may seem large, they pale in comparison with average daily electricity consumption and, further, with peak consumption. For example, through the first 10 months of 2025, electricity consumption in California totaled about 202 million MWh and averaged 665,000 MWh each day.8 Hence, the state’s existing battery storage could meet only about two hours of average daily electricity consumption. On days of highest electricity demand—such as on August 21, 2025, when demand peaked at over 54,500 MW9—existing battery storage could supply less than one hour of consumption.
Or consider PJM Interconnection, the regional transmission operator (RTO) that oversees electric generation and transmission within an area that comprises 13 states and Washington, DC.10 On July 29, 2025, electricity consumption totaled 2.5 million MWh. From 6:00 to 7:00 p.m. that evening, consumption peaked at over 153,000 MWh.11 Supplying the electricity consumed in that single hour would have required 50% more battery storage than currently exists in the entire country.
Advocates for a zero-emissions electric grid insist that wind, solar, hydroelectric, and batteries can not only meet the country’s electricity demand but also do so at a low cost.12 However, they are less clear about whether such a portfolio can meet demand at current reliability standards. This matters because increased reliance on electricity, including mandates that will deepen that reliance (e.g., electric vehicles, heat pumps), is incompatible with reduced access when it is most needed.13
Moreover, both wind and solar generation are often unavailable when electricity demand is at its highest. Solar photovoltaics (PV) do not generate electricity at night or on cloudy days.14 And wind droughts—periods during which there is little or no wind—can persist for days at a time. But existing battery storage facilities, which use the same technology as electric vehicle batteries, are designed only for short-duration responses. Most installations provide a maximum of four hours of electricity. Consequently, they cannot accommodate multiday periods of cloudy and windless days without duplicating energy storage systems and overbuilding the electricity grid; this, in turn, raises electricity costs.
Although there have been frequent announcements of new battery storage breakthroughs, these often come at the expense of other factors that inhibit their large-scale adoption, including efficiency factors, safety, and cost. Moreover, most of these “breakthroughs” are existing technologies that have not yet proven amenable to large-scale commercial development, including vanadium flow batteries, sodium-ion batteries, iron-air batteries, solid-state batteries, and sand batteries. Of course, true technological breakthroughs are always possible. But the path from the lab bench to large-scale commercialization is long and arduous. Hence, large-scale commercialization of new storage technologies, however promising they may be, is likely to take decades.
This report explains the economic and physical infeasibility of deploying large-scale battery storage to overcome the inherent intermittency of wind and solar energy. As will be demonstrated, the quantities of wind and solar generation and battery storage that are needed to meet existing reliability standards would cost trillions of dollars, cause electricity prices to skyrocket, and require vast amounts of land—all of which would adversely affect rural communities and agricultural production.
Ultimately, battery storage is needed only because of the push to meet growing electricity demand and to replace retiring thermal power facilities with intermittent wind and solar power, which remain uneconomic without subsidies and mandates. In effect, battery storage is an answer in search of a question. Given current technologies and costs, the quantities of storage required to ensure that electricity is available—especially when demand is greatest—make a wind-solar-battery future physically unrealistic and its pursuit economically ruinous.
Intermittency and Meeting Customers’ Electricity Needs
To ensure that electricity is available virtually at all times, U.S. electric (and gas pipeline) systems have been designed to meet customer demand when it is greatest. This means having enough generating resources to produce the required electricity, plus transmission and distribution lines with the capacity to deliver that electricity to customers.
Although it is impossible to guarantee that electricity will still be available under all circumstances, the U.S. has a planning standard that specifies how often periods of high electricity demand or equipment failures (e.g., a sudden loss of one or more generating plants or transmission lines) might result in an outage, such as a blackout.15 This standard, called loss of load probability or loss of load expectation, is set at an outage of one day every 10 years and commonly referred to as the one-in-10 standard. (That’s approximately equivalent to two hours per year.)
These standards are known collectively as reliability standards. They are crucial for evaluating the cost-effectiveness of an electric system that relies primarily on wind and solar generation, existing hydroelectric plants, and large-scale battery storage because providing increased reliability comes with additional costs, such as more generators that can be activated to meet higher than expected customer demand or be ready in case other generators suddenly fail.
If society is willing to accept less reliability and endure more frequent outages, it can reduce electric system costs. The trade-off, however, is the costs that customers must bear when there is an outage. For example, residential customers and grocery stores could incur costs due to food spoilage resulting from a lack of refrigeration. Many businesses would be unable to stay open, resulting in lost sales and reduced wages for employees. Collectively, these and other costs form what can be called the social cost of outages. These social costs, known broadly as the value of lost load (VOLL), can be quite large. For example, a study prepared for the Electric Reliability Council of Texas estimated VOLL between $1.09 per kilowatt-hour (kWh) and $3.96 per kWh for residential customers, depending on the duration of an outage. VOLL estimates for commercial and industrial customers were much larger.16 Moreover, in conjunction with state policies to promote electrification—such as mandates to increase the percentage of new electric vehicle sales and to convert the existing gas- and oil-fired space and water heating in multifamily and commercial buildings to electricity—the value of a highly reliable electric system will increase over time. Consequently, this report assumes that existing reliability standards will remain in effect.
Traditionally, meeting peak electricity demand has been achieved through a mix of three types of generating resources: baseload resources that are designed to operate continuously, intermediate resources that supplement baseload as demand rises, and peaking resources that are available when demand reaches its highest level. Historically, baseload resources primarily consisted of coal-fired plants (and large hydroelectric dams in areas such as the Pacific Northwest and upstate New York), with nuclear plants joining the mix starting in the 1960s. Later, natural gas–fired generators began to be added, initially as intermediate resources but more recently as baseload and peaking units because of their high efficiency. Previously, most traditional peaking generators burned fuel oil. Some of these continue to operate; most have been replaced by natural gas peaking generators, which are more efficient and emit fewer pollutants. Although less fuel-efficient than their larger baseload and intermediate counterparts, natural gas peaking generators are much cheaper to build. (In effect, natural gas peaking generators can be regarded as much larger versions of the backup generators that many homes and businesses install for power outages caused by storms.)
There are several alternatives to using generators to meet peak electricity demand. Two approaches favored by environmentalists are to enact time-of-use pricing and direct load controls. The first reduces demand by raising prices in the late afternoon and early evening hours when electricity demand is typically greatest. The second approach enables electric utilities to remotely control electric appliances, such as air conditioners and water heaters, by turning them off to reduce demand. Consumers embrace neither approach. A third possibility—meeting peak demand with battery storage—will be evaluated in this report.
An electric system based primarily on wind and solar generation, however, requires far more battery storage than that needed to meet peak demand, as the inherent intermittency of these generating resources is not confined to peak hours alone. How much more depends on numerous factors, including the specific load profile—that is, the pattern of electricity use, which may change over time, depending on the scope of electrification policies and changes in how electricity is priced; the availability and output of wind and solar in different parts of the country; and weather conditions. It also depends on the ability to deliver electricity from one region to another. For example, the Southeastern U.S. has relatively poor wind resources when compared with those of the Midwest. If electricity generated by wind in the Midwest can be transported cost-effectively to the Southeast, then a wind- and solar-based system in the Southeast could be more easily developed than by relying solely on local generating resources. Similarly, there is more sun and thus more solar power potential in the Desert Southwest than in New England. Again, this raises the question of whether electricity can be transmitted cost-effectively over thousands of miles. Given current technologies, the simple answer is that it cannot. Though new technologies such as superconducting transmission lines that do not suffer electrical losses may be developed, those technologies do not yet exist.
Analytical Framework
Modeling the entire U.S. electric grid is enormously complex. Besides the geographic differences, the electric grids in different regions operate in distinct ways. For example, the Midwest, the mid-Atlantic, New York, and New England all have RTOs17 that coordinate electric generators and high-voltage transmission lines to improve overall system reliability and provide electricity at the lowest possible cost. However, other than California, Western states do not have such a single entity. Instead, they operate under the Western Electricity Coordinating Council (WECC), along with British Columbia, Alberta, and northern Baja California. Although the WECC helps coordinate planning activities, it does not control grid operations. Similarly, the Southeastern states—including Florida—lack an RTO but have voluntary planning organizations.18 In these latter regions, individual electric utilities and generation owners coordinate operations among themselves.
Hence, to evaluate the physical and economic feasibility of an electric system composed primarily of wind, solar, and battery storage (along with existing nuclear plants), this study examines PJM, which covers 13 states and the District of Columbia and includes 21 separate utility operating zones (see figure 1). PJM’s territory serves more than 67 million people—almost 20% of the entire U.S. population—and represents the largest RTO in the United States in terms of population served, peak load reached, and electricity generated. It also includes states such as Maryland and New Jersey that have committed to replacing fossil-fuel energy with electricity generated primarily from wind and solar power.
Figure 1. PJM and Operating Zones
.png)
Source: Adapted from PJM Interconnection, PJM Zone Map (PJM, 2023).
Because PJM coordinates operations across a large region and has prepared forecasts of electricity demand through 2045, it provides an excellent vehicle for evaluating the physical and economic feasibility of a wind-solar-battery system. Given that PJM also has 18 operating nuclear plants (and several that may be restarted), it is prudent to examine a scenario in which electricity demand is met primarily with natural gas and nuclear power.19 (Hydroelectric plants account for less than 2% of generating capacity in the PJM service area.)20
Forecast PJM Load Growth
The 2025 forecast prepared by PJM shows both peak load and total electricity consumption growing rapidly over the next 20 years (see figure 2).21 Although PJM forecast peak demand in summer 2025 at just over 154,000 MW, the actual peak was slightly more than 160,000 MW.22
Figure 2. PJM Forecast Energy and Peak Demand, 2025-45
.png)
Source: Data from PJM Resource Adequacy Planning Department, 2025 PJM Long-Term Load Forecast Report (PJM, 2025).
As shown in figure 2, total electricity consumption is expected to almost double from about 833,000 gigawatt-hours (GWh) in 2025 to 1.48 million GWh in 2045. That is equivalent to around 4 million MWh per day, or 165,000 MW every hour. In other words, by 2045, forecast energy consumption on an average day will be greater than the highest-demand day in 2025.23
Summer and winter peak electricity demand is also forecast to increase by almost 50% to 229,000 MW and 219,000 MW, respectively. (The summer peak forecast reflects a reduction from projected behind-the-meter or distributed solar generation of almost 6,700 MW.)
A wind-solar-battery–based electric system must also accommodate large variations in consumption throughout the day. In summer, load is typically lowest in the predawn hours and peaks between 5:00 and 6:00 p.m. (see figure 3).
Figure 3. PJM Summer Load Profiles
.png)
Source: Data from PJM Resource Adequacy Planning Department, 2025 PJM Long-Term Load Forecast Report (PJM, 2025).
Figure 3 shows the average daily load profile for the summer months (June–August) for 2022 and 2025, which reveals overall consumption growth. The figure also shows the load profile for June 23, 2025, which had the highest peak demand for the summer; the difference between the minimum and maximum hourly demand was exacerbated on that day. A key problem with this load pattern is that solar generation rapidly decreases from its midday maximums when demand peaks in the early evening hours, which increases the quantity of battery storage that must be available.
The winter (December–February) load profile differs from that of the summer. Rather than a single early evening peak, there are dual peaks in the early morning and early evening; figure 4 also shows growth between 2022 and 2025. For the 2024–25 winter season, the highest-demand day occurred on January 22, 2025. Demand peaked first between 8:00 and 9:00 a.m. and then again between 7:00 and 8:00 p.m. Both peak hours correspond to minimal solar generation.
Figure 4. PJM Winter Load Profiles
.png)
Source: Data from PJM Resource Adequacy Planning Department, 2025 PJM Long-Term Load Forecast Report (PJM, 2025); authors’ calculations.
The winter and summer load profiles can be compared with the wind and solar average generation profiles (see figures 5 and 6). Figure 5 shows the average hourly combined wind and solar generation for summers 2024 and 2025.
Figure 5. Average Hourly Wind and Solar Generation, Summers 2024 and 2025
.png)
Sources: Data from PJM Resource Adequacy Planning Department, 2025 PJM Long-Term Load Forecast Report (PJM, 2025); “Solar Generation,” Data Miner 2, PJM, accessed May 11, 2026, https://dataminer2.pjm.com/feed/solar_gen/definition; and “Wind Generation,” Data Miner 2, PJM, accessed May 11, 2026, https://dataminer2.pjm.com/feed/wind_gen/definition. Authors’ calculations.
As shown in figure 5, solar generation peaks between noon and 1:00 p.m., and it decreases rapidly thereafter. Wind generation is relatively constant but, on average, is greatest around midnight. When summer demand is greatest—generally between 6:00 and 7:00 p.m.—solar still contributes some generation.
Figure 6. Average Hourly Wind and Solar Generation, Winters 2024 and 2025
.png)
Sources: Data from PJM Resource Adequacy Planning Department, 2025 PJM Long-Term Load Forecast Report (PJM, 2025); “Solar Generation,” Data Miner 2, PJM, accessed May 11, 2026, https://dataminer2.pjm.com/feed/solar_gen/definition; and “Wind Generation,” Data Miner 2, PJM, accessed May 11, 2026, https://dataminer2.pjm.com/feed/wind_gen/definition. Authors’ calculations.
As demonstrated in figure 6, average hourly wind generation in the winter months is more than twice as great as during the summer months, while solar generation is far lower. Comparing figure 6 with the average hourly load profile for the winter months shows that solar provides virtually no generation when load peaks in the early morning and early evening hours.
The Impacts of Additional Electrification
The generation patterns of wind and solar in both the winter and summer months show that large quantities of battery storage will be required to meet peak demand. Additional electrification will likely exaggerate both the winter and summer load profile extremes, necessitating more storage capacity as well as surplus wind and solar capacity to provide sufficient electricity for charging storage batteries.
In winter, replacing existing gas and oil furnaces—the dominant heat sources in the PJM states—with electric heat pumps will increase early-morning and -evening loads. Throughout the year, vehicle electrification will increase early-evening loads when electric vehicle owners typically want to recharge their vehicles. In the aggregate, these electrification trends mean that without load controls, load profiles—such as those shown in figures 3 and 4—will become more pronounced, with relatively higher peaks than the overall average daily load.
Electric Vehicle Charging Profiles
Electric vehicle owners typically charge their vehicles at night, after returning from work. This charging pattern increases peak demand. The U.S. Department of Energy (DOE) maintains a database of weekday and weekend charging patterns by state and major city, using models developed by the National Renewable Energy Laboratory. The resulting load profiles are based on assumptions about the types of charging stations at homes and at workplaces, average trip distances, climate, and so forth.
For example, the load profile for 1,000 EVs in Washington, DC—half of which are all-electric and half of which are hybrids—would peak slightly after 7:00 p.m. at just over 1,170 kilowatts (kW), or roughly 1.17 kW per electric vehicle (see figure 7).24
Figure 7. Average Weekday Load Profile for Electric Vehicles: Washington, DC
.png)
Source: Data from “Electric Vehicle Infrastructure Toolbox,” Alternative Fuels Data Center, U.S. Department of Energy, accessed May 5, 2026, https://afdc.energy.gov/evi-x-toolbox#/evi-pro-loads.
Heat Pump Load Profiles
A 2017 study in Great Britain examined the load profiles of a sample of 696 installed electric heat pumps, primarily in low-income apartment buildings.25 The study examined the aggregated load profiles at different average temperatures. The findings were consistent with the observed PJM average winter profile shown in figure 4: Heat pump load first peaked between 6:00 and 9:00 a.m. and then again between 4:00 and 7:00 p.m. On colder winter days, defined in the study as days with an average temperature of 31 degrees Fahrenheit, peak consumption for individual heat pumps averaged 1.8 kW. On medium-temperature days, which the study defined as an average temperature of 41 degrees Fahrenheit, peak heat pump consumption averaged 1.2 kW.
A 2019 study prepared by the Pacific Northwest Utilities Conference Committee and the Northwest Gas Association utilized a simulation model known as the simplified energy enthalpy model to estimate load profiles for heat pumps in single-family homes at various average temperatures (see figure 8).26
Figure 8. Heat Pump Daily Load Profiles
.png)
Source: Adapted from PNUCC/NWGA Power & Natural Gas Planning Taskforce and PNUCC System Planning Committee, A Discussion on Electrifying Light Duty Vehicles and Natural Gas Heating in the Northwest (Pacific Northwest Utilities Conference Committee; Northwest Gas Association, 2019), 15, figure 9.
As figure 8 shows, load peaked in the evening on days with the coldest average temperatures, with a smaller peak in the early morning hours. The profiles are based on average daily temperatures in 2023 for Seattle; Portland, Oregon; and Spokane, Washington. The lowest daily average for these three cities was 23 degrees Fahrenheit. At that average temperature, the individual heat pump load peaked at averages of 6.3 kW from 6:00 to 7:00 a.m. and 5.3 kW from 7:00 to 8:00 p.m.27
Estimating the Additional Cost of a Wind-Solar-Battery System in the PJM Grid
Three scenarios were considered to meet the forecast PJM winter and summer loads that are shown in figure 2. (Meeting summer and winter loads will automatically meet those of fall and spring, as these seasons have lower loads.) The renewables-only (RO) scenario assumed that no new fossil-fuel generation had been built. Instead, by 2045, electricity demand would be met by additional wind, solar, and battery storage, along with existing hydroelectric and nuclear plants.28 All existing fossil-fuel generation would be retired after 60 years of operation or by 2040, whichever comes first.
The alternative natural gas and nuclear (NGN) scenario assumed that no additional wind and solar generation had been built and that existing wind and solar were gradually retired as units came to the end of their useful lives. Instead, electric demand would be met with a combination of natural gas and nuclear generation. Additionally, while coal would retire on the same schedule as in the RO scenario, the NGN scenario assumed that other existing thermal units did not have a strict 2040 retirement deadline. Finally, a third scenario (NGN+B) was considered in which battery storage would be used to help meet short-term peak demand rather than conventional natural gas–fired combustion turbines.
Although total generating capacity in PJM has increased since 2020, fossil-fuel generating capacity decreased by about 5,500 MW between 2020 and 2026 (see table 1).
Table 1. Existing PJM Generating Capacity, by Fuel Type, as of March 2026
.png)
Source: Data from “Preliminary Monthly Electric Generator Inventory (Based on Form EIA-860M as a Supplement to Form EIA-860),” Analysis & Projections, U.S. Energy Information Administration, released April 23, 2026, https://www.eia.gov/electricity/data/eia860m.
In contrast, all existing biomass, hydroelectric, and nuclear generating plants were assumed to remain available through the end of the study period in 2045. Existing wind and solar generating plants were retired when they reached the end of their expected lives and were assumed to be replaced with new facilities of the same type. The model assumed that sufficient surplus wind and solar would be added to charge the required storage battery capacity. To maintain existing reliability standards, there would have to be enough storage capacity to provide electricity when wind and solar power are unavailable, especially over prolonged periods.
Consistent with observed data and forecasts, the model assumed that the average effective capacity factors of wind and solar would decrease over time. For example, the Midcontinent Independent System Operator estimated that wind and solar capacity values in that RTO will plummet over the next 20 years.29 PJM also estimated that, by 2035, wind capacity values will drop by half while solar PV will fall by 20%.30 These capacity values refer to the total installed capacity that can be relied on to meet peak demand in a given hour and maintain reliability standards. As more of these resources are added, their ability to meet peak demand in a given hour declines. For instance, suppose electricity demand peaks at 8:00 p.m. on a winter night. Regardless of the amount of solar capacity installed on the grid—whether 1,000 MW or 1 million MW—none of that capacity will contribute to meeting peak demand.
The wind, solar, and battery storage capacity requirements were determined using an hourly model that was designed to meet forecast loads at all hours of each year. Hourly demand in each year was based on PJM’s projected hourly demand profiles through 2045. Hourly wind and solar generation profiles were based on PJM’s published historical wind and solar generation data for the six-year period of 2019–24.
These historical wind and solar data were also used to identify wind and solar drought periods. A wind drought is a period during which wind generation is less than 10% of total installed capacity. For example, between January 1, 2022 and October 31, 2025, the longest consecutive period with less than 1,000 MW of wind generation was 113 hours—just under five days—between July 18, 2024 and July 23, 2024. During that period, PJM’s total installed wind capacity was approximately 11,400 MW. Similarly, wind generation was less than 2,000 MW, or 20% of total installed capacity, for 185 hours—almost eight days—between July 18, 2024 and July 25, 2024. Over those eight days, wind generation provided less than 2% of total PJM load. A solar drought is defined similarly. For example, there was a two-day period in 2024 when solar PV generation fell below 1,500 MW, or 10% of total installed solar capacity.31
Finally, this study evaluated periods when both wind and solar generation were below 10%–20% of their total installed capacity. For example, over February 11–12, 2024, there was a 36-hour period during which both wind and solar generation were below 10% of their total installed capacity, and the average generation was just 5% of total capacity. In that period, PJM load averaged over 80,000 MW and peaked at more than 89,000 MW. Similarly, over January 25–27, 2024, total wind and solar generation was less than 20% of their combined total capacity, averaging just 10%. During that period, total PJM load averaged 86,400 MW and peaked at more than 100,000 MW.32
To determine the required battery storage capacity to maintain system reliability, the model used a generic battery storage resource to meet every unserved megawatt of demand in each hour. This generic battery resource is depleted as it serves demand, and it is recharged during periods of excess wind and solar generation. To be conservative, the model assumed that the installed battery capacity was fully charged at the start. The hourly model determined the lowest point of depletion for this generic battery resource, which is the required megawatt-hour rating to serve demand. The new battery storage resources were assumed to be four-hour battery storage systems. Although there are longer-duration storage resources—for example, eight-hour battery storage—they are commensurately more costly or are not sufficiently developed to be cost-effective (see box 1).
Box 1. Battery (and Other) Grid-Storage Technologies
Large hydroelectric dams, such as those on the Columbia and St. Lawrence Rivers, were the first grid-storage technology. The amount of water stored behind a dam governs the amount of electricity that can be generated; the release rate determines the instantaneous power flow. However, there are few—if any—suitable new sites for large hydroelectric dams, and many environmentalists oppose existing dams and have successfully forced the removal of several, such as those on the Klamath River.
Pumped hydroelectric is another long-standing storage technology. Pumped storage facilities use low-cost electricity—available during periods of low demand—to pump water into a reservoir, which can then be released to generate electricity when demand is highest. Some new pumped storage facilities are under development, but they are costly, geographically limited, and subject to environmental opposition.
Utility-scale storage batteries are the most touted new grid-storage technology. Lithium-ion batteries—the same technology used in the majority of electric vehicles—are the dominant utility-scale battery technology. Within that general class, there are different electrolyte chemistries—that is, the material the lithium ions travel through from the anode to the cathode. The latter can also be manufactured from various materials. For example, cell phones commonly use a lithium cobalt oxide cathode, whereas electric vehicle batteries typically use a lithium manganese oxide cathode. The anodes are typically made from graphite. When the battery is charging, the current flows from the cathode to the anode. The positively charged lithium ions migrate through the electrolyte to the anode, forming a lithium-carbon compound. When the battery discharges, the process reverses; the current then flows from the anode to the cathode (see figure B-1).
Figure B-1. How a Battery Works
.png)
Today, most utility-scale batteries installed are referred to as four-hour batteries because they are designed to fully discharge over a four-hour period. Some eight-hour batteries have recently been installed, although they are more costly on a per-MWh basis than the four-hour ones.
Longer-Term Storage Alternatives
Although numerous other battery technologies have been proposed to solve the problem of storing sufficient surplus wind and solar power to overcome those resources’ inherent intermittency and multiday periods when neither wind nor solar power is available, these technologies remain problematic.a
For example, iron-air batteries have been touted as a safe, noncombustible alternative that will provide electricity for 100 hours. First developed over a half-century ago by NASA, iron-air batteries have suffered from myriad problems, especially low discharge rates and low round-trip efficiency, which measures the electricity a battery can supply relative to the amount of electricity required to charge it fully. Recently, a new company, Form Energy, claims to have overcome some of the technological challenges.b However, one key issue remains: The company admits that its new iron-air batteries still have a round-trip efficiency of less than 40%.c That means it takes 2.5 MWh of electricity to discharge 1 MWh. In contrast, lithium-ion batteries have a round-trip efficiency of around 85%.
Another technology that has been touted for long-term storage is flow batteries. These use liquid anodes and cathodes rather than solid ones. Like iron-air batteries, flow batteries are not a new technology, having first been developed in 1879 using a mixture of zinc and bromine.d A technological breakthrough took place in the 1980s with the development of vanadium-based flow batteries. However, flow batteries have low energy density because they require large liquid storage tanks and are slow to charge and discharge. Nevertheless, a 2024 DOE report touted technological breakthroughs that could reduce the cost of flow batteries from their current $0.16 per kWh to just $0.05 per kWh by 2030.e This goal appears to be overly optimistic.
Liquid-metal batteries (LMBs) are another proposed long-duration storage technology. The best-known developer of LMBs was Ambri, a company founded in 2010 by two professors from the Massachusetts Institute of Technology. An LMB uses molten metals for the anode and cathode, separated by a molten salt electrolyte.f The Ambri LMB would have used a liquid calcium alloy as the anode and a solid antimony-based cathode, separated by a molten salt electrolyte. Although the Ambri technology was promoted heavily, the company filed for bankruptcy in May 2024 and shut down permanently in October 2025.
Compressed air energy storage (CAES) is yet another storage medium. The concept was developed in the 1940s and first deployed commercially in the late 1970s. Air is compressed and stored in an underground cavern. When electricity is needed, the air is heated and then run through a combustion chamber, typically one burning natural gas. Hence, CAES operates similarly to a standard combustion turbine. The difference is that using compressed air improves the overall efficiency of the generating process.g Advanced CAES systems do not use a gas turbine to generate electricity. Instead, they use electricity to compress the air into a liquid in a tank. To generate electricity, the liquid under high pressure is run through a turbine, much like a conventional hydroelectric plant. Although small CAES systems can use aboveground tanks, large-scale systems require impermeable caverns to prevent air from leaking out. That requirement limits where CAES systems can be deployed.
Hydrogen manufactured from surplus wind and solar electricity is also envisioned as an energy storage resource.h The manufactured hydrogen would be stored and then burned in generators, such as existing gas turbines that have been converted to burn hydrogen. But so-called green hydrogen suffers from myriad problems. First, it takes far more energy to manufacture hydrogen than hydrogen can provide—a consequence of the second law of thermodynamics. Second, storing and transporting hydrogen is costly. Third, generators that can burn pure hydrogen do not yet exist. Fourth, pure hydrogen cannot be transported in existing natural gas pipelines because most are made from steel, which hydrogen embrittles. Consequently, transporting pure hydrogen would require developing an entirely new pipeline infrastructure.
a Paul Denholm et al., Moving Beyond 4-Hour Li-Ion Batteries: Challenges and Opportunities for Long(er)-Duration Energy Storage (National Renewable Energy Laboratory, 2023). See also Taoli Jang et al., “Battery Technologies for Grid-Scale Energy Storage,” Nature Reviews Clean Technology 1 (2025): 474–92.
b Jonathan Lesser, “Iron-Air Batteries: Green Energy Advocates’ Newest Shiny Object,” RealClearEnergy, February 24, 2025.
c Andrew Rapin, “Form Energy Multiday Energy Storage Technology and Pilot Project,” presented at the Midwest Reliability Organization 2023 Annual Reliability Conference, St. Paul, MN, May 17, 2023.
d Yuriy V. Tolmachev, “Flow Batteries from 1879 to 2022 and Beyond,” Qeios, January 10, 2023.
e U.S. Department of Energy (DOE), Achieving the Promise of Low-Cost Long Duration Energy Storage (DOE, 2024).
f Xuelin Guo et al., “Design Principles and Applications of Next-Generation High-Energy-Density Batteries Based on Liquid Metals,” Advanced Materials 33, no. 29 (2021): 2100052.
g Xinjing Zhang et al., “Advanced Compressed Air Energy Systems: Fundamentals and Applications,” Engineering 34 (2024): 246–69. The authors reviewed numerous CAES technologies.
h The amount of elemental hydrogen contained in the Earth’s crust is unknown, but hydrogen proponents claim that there is enough to enable a green energy transition. See also Sarah Gelman et al., Prospectivity Mapping for Geologic Hydrogen, ver. 1.2, Professional Paper 1900 (U.S. Geological Survey, 2025).
For each scenario, the model selected the least-cost mix of generating resources that would meet projected hourly demand in each year through 2045. (A more detailed description of how the model operates can be found in Technical Appendix: Model Methodology.)
Battery storage costs are often expressed in terms of levelized costs.33 (A mortgage with a fixed interest rate is an everyday example of a levelized cost.) Although common, expressing battery storage costs on a levelized basis is the least accurate way to evaluate their overall costs, as it requires numerous assumptions. These include the frequency of charging and discharging—the fewer charging-discharging cycles per year, the higher the levelized cost of storage (LCOS); the battery’s lifetime, or how many charging-discharging cycles it can undergo before requiring replacement; the rate of battery degradation, an inherent characteristic of aging that affects how fully a battery can be charged, its instantaneous output, and how much electricity it can discharge; the battery’s round-trip efficiency, or the difference between the amount of electricity required to charge the battery and the amount of electricity discharged; the costs to maintain the battery; the battery’s initial capital cost; and the cost of the electricity used to charge the battery. Another crucial assumption is the discount rate, which is similar to a mortgage interest rate: The higher the discount rate, the greater the LCOS.
Because small changes in these assumptions can result in large swings in LCOS values, a better approach to evaluating the economics of grid storage is to examine the total costs of the quantity of storage required to meet reliability standards. This is the approach used in this analysis.
For each scenario, this analysis estimated retail consumers’ costs, which were lower than the total system costs. This approach reflects the fact that individuals and businesses are affected most directly by what they pay on their electric bill, not by the present value of total system costs. The full costs of generating resources are recouped over their lifetimes through depreciation charges, while the un-depreciated portion of those investment costs earns a regulated rate of return. Consumers also pay for the income taxes paid by privately owned electric utilities (see box 2).
Box 2. How Retail Electricity Rates Are Seta
All investor-owned electric utilities are regulated. The rates they are allowed to charge retail customers must first be approved by state regulators. (Additionally, the Federal Energy Regulatory Commission regulates rates for transmission on the high-voltage, bulk-power grid.) Virtually all regulation in the U.S. is based on a utility’s cost of service (COS). A utility’s COS is the sum of its fixed operating and maintenance costs—that is, costs that are the same regardless of how much electricity it sells (e.g., poles and wires); its variable operating costs, such as fuel for generating units; its depreciation allowance on capital assets; its taxes; and its return on the depreciated value of its capital investment, known as rate base.
Once these costs are totaled, they are allocated among the utility’s various customer groups (residential, commercial, industrial, etc.). Allocating variable costs is almost always based on each group’s consumption. Allocating fixed costs is more controversial and can be based on a variety of methods that assign responsibility for those costs to each customer group, usually based on their peak electricity demand during the previous year. After all costs have been allocated, the rates are calculated. These usually incorporate three charges: a fixed, ready-to-serve charge—that is, an amount the utility collects from a customer simply for being connected; a per-kilowatt-hour charge for how much electricity is consumed over the billing period; and, for commercial and industrial customers, a per-kilowatt charge that reflects their peak demand during the period. Using forecast consumption and peak demand, the rates are designed to collect the estimated COS.
a For a detailed discussion, see Jonathan Lesser and Leonardo Giacchino, Fundamentals of Energy Regulation, 3rd ed. (Regulatory Economics Publishing, 2024).
Analysis Results
After retiring all the existing coal, natural gas, and petroleum resources by 2040, while using existing nuclear, hydroelectric, and other resources, the least-cost capacity mix in the PJM system by 2045 under the RO scenario consisted of 991,002 MW of wind; 550,657 MW of solar; and 510,702 MW of four-hour battery storage capacity (see table 2 and figure 9).34 In total, over 2 million MW of new capacity would need to be added to meet load growth by 2045. The large battery storage capacity requirement is essential to compensate for the inherent intermittency of wind and solar—especially when electricity demand peaks—and to recharge the battery storage facilities after they are depleted during wind and solar droughts.
The massive overbuilding of wind and solar results in large amounts of curtailed output. While wind and solar can produce electricity at 40% and 22% of their total nameplate capacity, respectively, their effective grid capacity factors are 10.2% and 5.6%.35 By contrast, well-run nuclear facilities operate at a 90%–95% capacity factor. A grid must serve demand at any hour—something wind and solar cannot guarantee without enormous overbuild and storage backup.
Table 2. Capacity Requirements in 2045, by Scenario (MW)
.png)
* Includes coal, natural gas, and oil.
† Excludes behind-the-meter solar PV.
‡ Includes pumped hydroelectric and battery storage.
§ Includes biomass.
|| Assumes that the 835-MW Three Mile Island nuclear plant is restarted in 2028.
Source: Data from PJM Resource Adequacy Planning Department, 2025 PJM Long-Term Load Forecast Report (PJM, 2025); authors’ calculations.
Figure 9. Installed Capacity, by Resource Type: RO Scenario
.png)
Source: Data from PJM Resource Adequacy Planning Department, 2025 PJM Long-Term Load Forecast Report (PJM, 2025); authors’ calculations.
Under the NGN scenario, far less additional capacity would be needed each year to meet forecast PJM demand (see figure 10). As shown in table 2, by 2045, the total capacity requirement would exceed 330,000 MW—roughly one-sixth as much capacity as that added under the RO scenario. Under the NGN+B scenario, slightly less natural gas capacity is added, but overall capacity increases (see figure 11).
Figure 10. Installed Capacity, by Resource Type: NGN Scenario
.png)
Source: Data from PJM Resource Adequacy Planning Department, 2025 PJM Long-Term Load Forecast Report (PJM, 2025); authors’ calculations.
The mix of generating resources needed to meet peak demand during a January wind drought under the RO scenario (see figure 12) illustrates the massive quantity of battery storage required. In contrast, meeting summer peak loads under the NGN and NGN+B scenarios requires far less capacity (see figures 13 and 14).
Figure 11. Installed Capacity, by Resource Type: NGN+B Scenario
.png)
Source: Data from PJM Resource Adequacy Planning Department, 2025 PJM Long-Term Load Forecast Report (PJM, 2025); authors’ calculations.
Total Ratepayer Costs
Ratepayer costs for the additional capacity required to meet demand under each scenario were based on EIA data (see table 3). The reported costs in table 3 were assumed to remain constant over time in nominal dollars—in other words, the model did not increase costs over time to account for inflation.36 The reported costs also included the additional transmission capacity needed to serve the increased demand. Excluded from this analysis were other ratepayer costs, including those associated with local distribution system maintenance and upgrades, administrative and general expenses, and specific state policies that may be added to ratepayer bills.
Under the RO scenario, ratepayer costs totaled over $4 trillion through 2045 (see table 4). By comparison, costs under the NGN scenario totaled approximately $668 billion, less than one-fifth the amount under the RO scenario. The NGN+B scenario would cost an additional $768 billion—15% more than the NGN scenario but still less than one-fifth the cost of the RO scenario.
Table 3. Capacity and Operating Costs of New Generating Resources
.png)
* Overnight capital costs exclude all financing costs.
† Uses the average of PJM regions in the assumptions from EIA’s Annual Energy Outlook.
‡ Operations and maintenance costs.
Source: Data from EIA, Capital Cost and Performance Characteristics for Utility-Scale Electric Power Generating Technologies (EIA, 2024).
Table 4. Total PJM Customer Costs Through 2045
.png)
* Includes generation and transmission costs.
† Operations and maintenance costs.
‡ Includes fuel costs (savings).
§ Based on Dominion Energy’s current capital structure and approved cost of capital; includes financing costs and return on equity.
Source: Data from PJM Resource Adequacy Planning Department, 2025 PJM Long-Term Load Forecast Report (PJM, 2025); authors’ calculations.
Hourly Load Shapes During Wind Droughts and Peak Demand
The ability to serve electricity demand for each scenario was modeled using projected load profiles in 2045 and historical wind and solar performance data.
Figure 12 shows how the RO scenario is heavily reliant on storage for meeting demand during wind drought events on the system. Even with over 500 GW of battery storage resources on the system, the RO scenario still experiences significant curtailing as the battery storage facilities become fully charged and unable to store more electricity. This is due to the balance that must be struck to cost-optimize the system between overbuilding wind and solar and overbuilding battery storage on grids that are heavily dependent on weather-based resources.
Figures 13 and 14 show how the NGN scenarios can meet peak demand using dispatchable and fuel-based resources, with the NGN+B scenario utilizing battery storage as a peaking resource.
Figure 12. Hourly Generation During January Wind Drought: RO Scenario
.png)
Source: Data from PJM Resource Adequacy Planning Department, 2025 PJM Long-Term Load Forecast Report (PJM, 2025); authors’ calculations.
Figure 13. Hourly Generation During July Peak Hours: NGN Scenario
.png)
Source: Data from PJM Resource Adequacy Planning Department, 2025 PJM Long-Term Load Forecast Report (PJM, 2025); authors’ calculations.
Figure 14. Hourly Generation During July Peak Hours: NGN+B Scenario
.png)
Source: Data from PJM Resource Adequacy Planning Department, 2025 PJM Long-Term Load Forecast Report (PJM, 2025); authors’ calculations.
Emissions
Because one of the stated reasons for replacing fossil-fuel generation with zero-emissions sources is to address climate change by reducing CO2 emissions, this analysis also calculated the implied costs of the emissions reductions under the RO scenario. Under that scenario, CO2 emissions would fall to zero by 2040, whereas under the NGN scenario, emissions would remain relatively constant despite rising PJM electricity demand (see figure 15). Consequently, under the NGN scenario, emissions per MWh would decrease by about 60%, from 0.44 tons per MWh to 0.28 tons per MWh (see figure 16). Over the period 2025–45, the overall reduction in CO2 emissions would be about 5.4 billion tons. By comparison, total energy-related U.S. CO2 emissions in 2025 were just over 5.2 billion tons and total world energy-related emissions were 39.4 billion tons.37 Hence, the overall CO2 reductions over the entire period would be the equivalent of just over seven weeks of 2025 world emissions.
This analysis also calculated the net cost of achieving CO2 emissions reductions in each year of the study under the RO scenario, based on the net difference in annual ratepayer costs between the RO and NGN scenarios divided by the difference in annual emissions (see figure 17). As this figure shows, the annual costs of CO2 reduction would range from just over $55 per ton in the early years and just over $771 per ton by 2045. By comparison, the 2023 update of the social cost of carbon (SCC),38 which quadrupled previous estimates, would increase from $195 per ton in 2026 to about $306 per ton in 2045. Thus, the cost of the emissions reductions under the RO scenario is two to three times higher than the SCC estimates in most years, demonstrating that the costs of the reductions far exceed the estimated social benefits.
Figure 15. Emissions, by Scenario
.png)
Source: Data from PJM Resource Adequacy Planning Department, 2025 PJM Long-Term Load Forecast Report (PJM, 2025); authors’ calculations.
Figure 16. Emissions per MWh, by Scenario
.png)
Source: Data from PJM Resource Adequacy Planning Department, 2025 PJM Long-Term Load Forecast Report (PJM, 2025); authors’ calculations.
Figure 17. Cost of Emissions Reductions Versus Social Cost of Carbon: RO Scenario
.png)
Sources: Data from PJM Resource Adequacy Planning Department, 2025 PJM Long-Term Load Forecast Report (PJM, 2025); and National Center for Environmental Economics, Report on the Social Cost of Greenhouse Gases: Estimates Incorporating Recent Scientific Advances (U.S. Environmental Protection Agency, 2023). Authors’ calculations.
Conclusions and Policy Recommendations
A number of U.S. states, including California and New York, have implemented zero-emissions mandates for electricity supplies to address climate change by eliminating fossil-fuel generation and reducing CO2 emissions. As this analysis shows, however, the cost of a zero-emissions wind, solar, and battery storage grid is prohibitive—roughly six times the cost of a grid composed of natural gas and nuclear plants. Moreover, the implied annual costs of reducing CO2 emissions far exceed the most recent SCC estimates. Hence, the RO scenario fails a cost-benefit test as a strategy to reduce CO2 emissions.
Moreover, because of the extremely low power density of wind and solar PV—about 1 MW per square kilometer for wind and 5 MW per square kilometer for solar PV39—the land requirements would be substantial. Installing 991,000 MW of wind would require 991,000 square kilometers, an area almost 20% larger than that of all PJM states combined.40
Finally, a frequently overlooked aspect of a zero-emissions grid is the materials requirements and the resulting environmental degradation from mining and processing operations. For example, as discussed in a recent NCEA issue brief, a single 250-MW, 1,000-MWh utility-scale battery installation requires about 770,000 tons of “mined, processed, and transported raw materials and consumes approximately 450 GWh of energy to manufacture.”41 Hence, the 510,000 MW of battery storage by 2045 under the RO scenario would require over 1.54 billion tons of raw materials and more than 900,000 GWh of energy.
Much of this material is mined and processed overseas, including in China, Indonesia, and the Democratic Republic of the Congo, where environmental standards are lax and environmental degradation has been severe.43 Thus, pursuing zero-emissions policies in the U.S. exacerbates pollution elsewhere, especially in developing countries.
This analysis demonstrates that a wind-solar-battery policy to meet electricity demand is physically implausible, cost-prohibitive, and unjustifiable on the basis of goals to reduce CO2 emissions. Should politicians and energy regulators refuse to recognize these physical and economic realities, they will continue to impose significant harm on consumers and the economy, while providing few benefits—if any.
Technical Appendix: Model Methodology
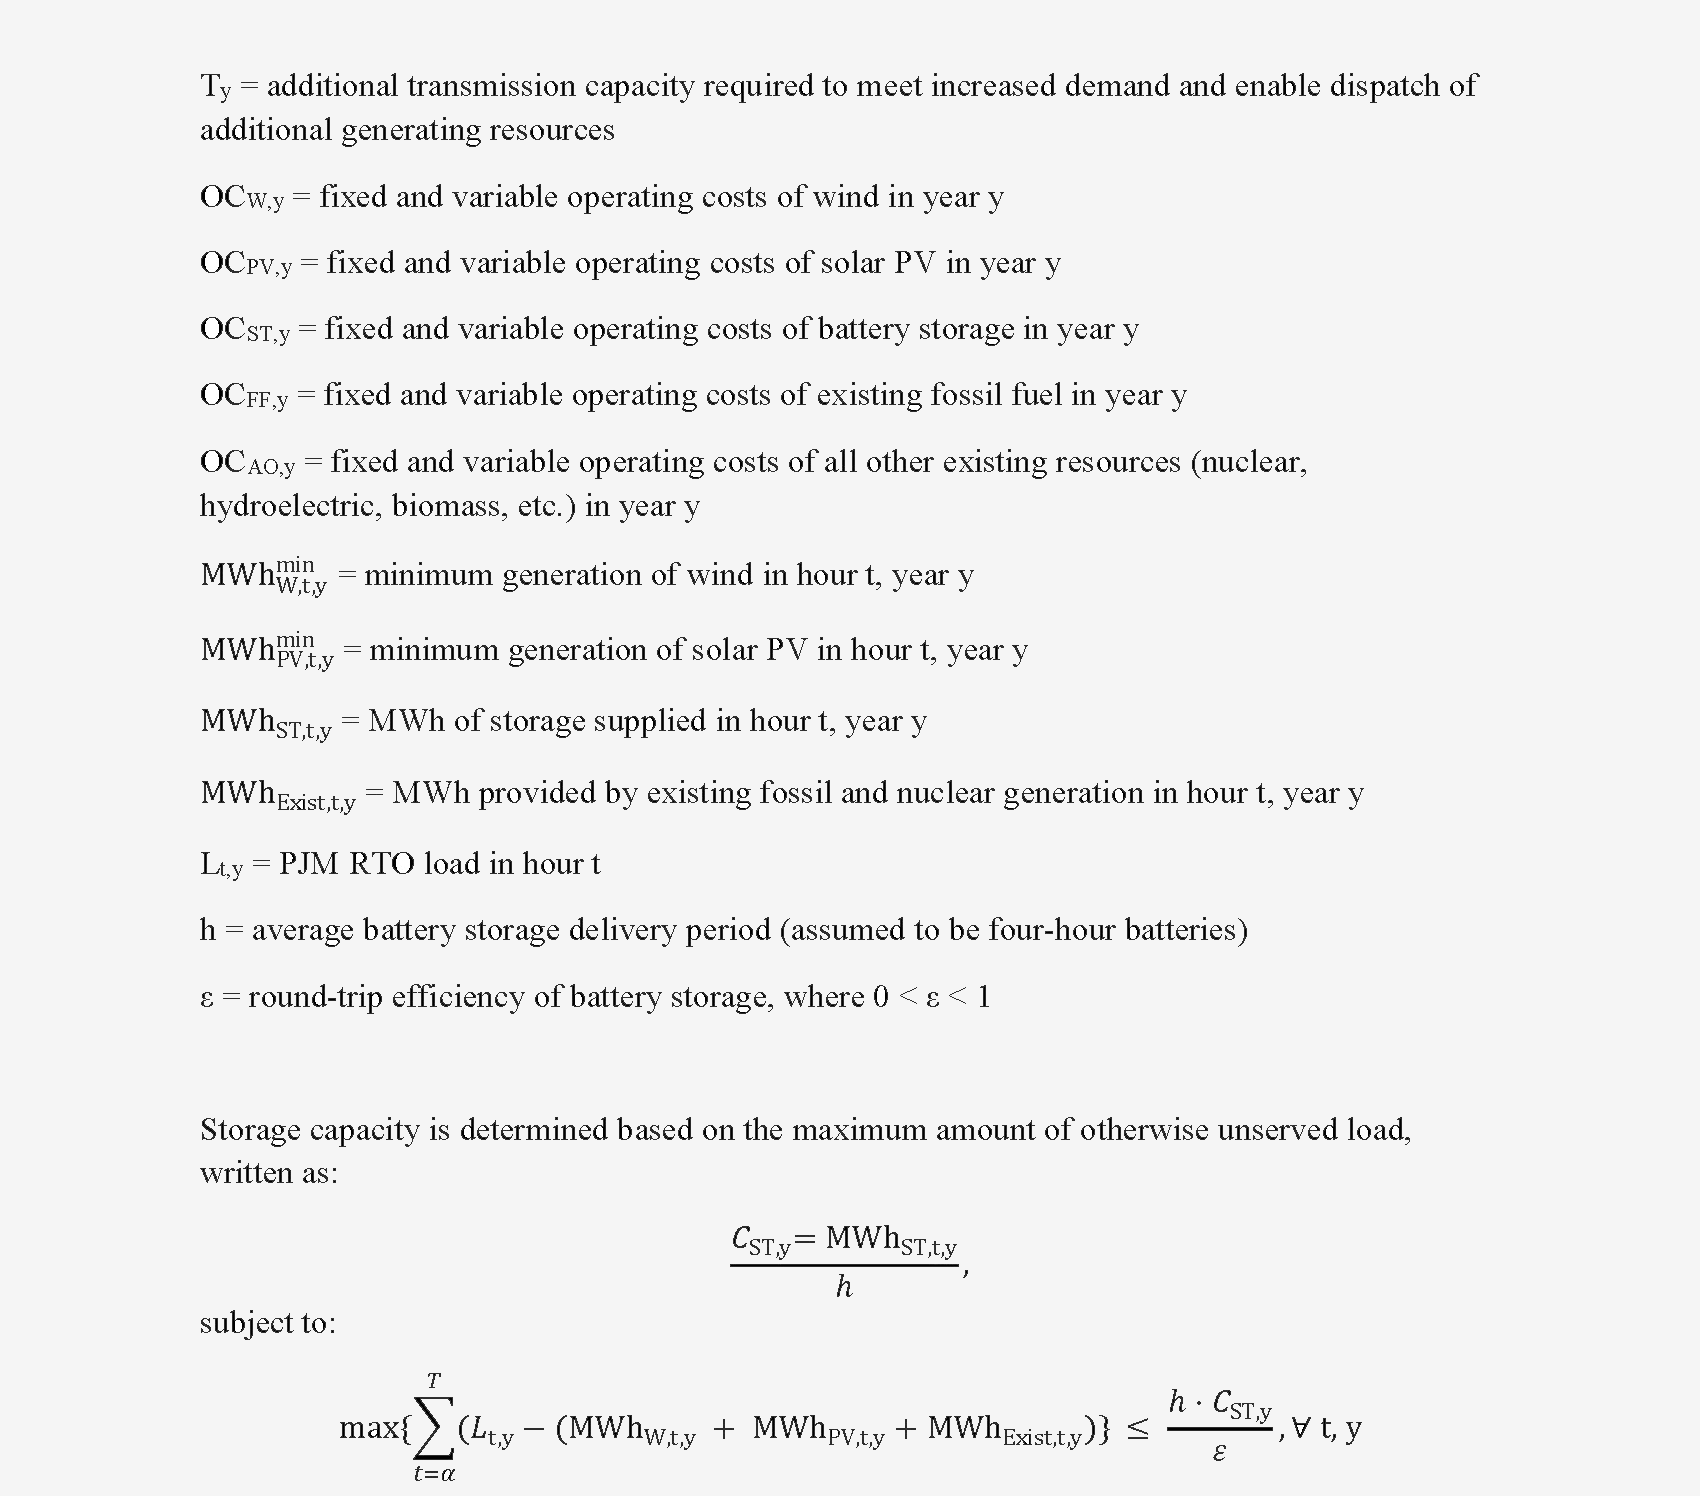
The model is designed to minimize the present value cost of meeting forecast hourly loads over the period 2026–45. The model evaluates different combinations of wind and solar capacity, along with existing fossil and nuclear capacity, to determine the storage capacity needed to meet hourly loads. Required storage capacity is further determined based on historical minimum generation periods of wind and solar. This encompasses both hourly minimums (e.g., solar generates 0 MWh at night) and extended periods of wind and solar droughts, during which these resources generate a minimum amount of electricity relative to their installed capacity.
In addition, for each hour (t), there must be sufficient surplus wind and solar generation accumulated over the preceding tchg hours to fully charge the storage batteries in anticipation of solar and wind droughts as well as hourly generation requirements. The model determines the minimum overbuilding of wind and solar to meet this criterion and is conservative in that it assumes the batteries are fully charged at the beginning of the modeling period.
The model uses the 2025 PJM RTO load forecast, including PJM’s forecast hourly load shapes for 2045, as its primary input.xliii PJM’s forecast incorporates expectations of future electrification, including electric vehicles and electric space- and water-heating loads.
Mathematically, the model is written as:

Existing fossil-fuel generation is assumed to be retired based on announced retirement dates, reaching 60 years of operation, or by 2040—whichever comes first. The Three Mile Island nuclear plant is assumed to restart in 2028, as currently scheduled. Existing nuclear plants are assumed to remain online throughout the modeling period, even if their relicensing periods have expired.
Capacity and operating costs are taken from the most recent U.S. Energy Information Administration (EIA) data. Capacity costs are assumed not to escalate in nominal terms, which implies a reduction of these costs in inflation-adjusted terms. Using the EIA’s inflation forecast of approximately 2% per year, this implies a reduction in real dollar costs of just under 50%.
The capital structure is based on Dominion Energy’s authorized return on equity and equity capitalization, which are 9.7% and 52.1%, respectively.44
Unit Lifespans
Different power plant types have varying useful lifespans, which this analysis takes into account for purposes of depreciation and repowering wind, solar, and battery storage facilities. Onshore wind turbines last 20 years, solar panels last 25 years, and battery storage facilities last 15 years. These facilities are rebuilt after reaching the end of their useful lifetimes. Natural gas plants depreciate over 30 years, while new nuclear facilities depreciate over 40 years.
Transmission interconnection costs for new resources range from $30,000 per MW for natural gas facilities to $50,000 per MW for nuclear and storage facilities; wind and solar interconnection costs are $48,000 per MW.
The model does not allow for the use of load modifying resources (LMRs) or demand response (DR) in determining how much reliable capacity will be needed to meet peak electricity demand in the PJM region. Instead, battery capacity and excess wind and solar capacity are built to provide enough power to supply electricity needs based on historical wind and solar capacity factor data provided by PJM from 2019 through 2024.45 Battery storage capacity is assumed to be 95% efficient and fully charged at the start of the test year.
For every scenario, all existing nuclear power plants are assumed to remain operational throughout the model run. This assumption greatly reduces the need for new onshore wind, solar, and battery storage resources and maintained system reliability.
- “Table 6.2.A. Net Summer Capacity of Utility Scale Units by Technology and by State, February 2026 and 2025 (Megawatts),” Electric Power Monthly, U.S. Energy Information Administration (EIA), accessed May 11, 2026, https://www.eia.gov/electricity/monthly/epm_table_grapher.php?t=table_6_02_a.
- “Table 6.5. Planned U.S. Electric Generating Unit Additions,” Electric Power Monthly, EIA, accessed May 11, 2026, https://www.eia.gov/electricity/monthly/epm_table_grapher.php?t=table_6_05.
- “Energy Storage Targets,” State Climate Policy Dashboard, accessed May 11, 2026, https://www.climatepolicydashboard.org/policies/electricity/energy-storage-targets.
- Massachusetts Bill H.4144.
- “Energy Storage Targets.”
- “Table 6.2.A.”
- Total storage battery energy is usually expressed as the number of hours the battery discharges multiplied by the battery capacity; in actuality, batteries are not drained below 20% of their energy because doing so shortens their operating lifetime.
- “Table 5.4.B. Sales of Electricity to Ultimate Customers by End-Use Sector, by State, Year-to-Date Through February 2026 and 2025 (Thousand Megawatthours),” Electric Power Monthly, EIA, accessed May 11, 2026, https://www.eia.gov/electricity/monthly/epm_table_grapher.php?t=table_5_04_b.
- California Independent System Operator, 2024 Statistics (California Independent System Operator, 2025).
- PJM, PJM—At a Glance (PJM, 2025).
- PJM Resource Adequacy Planning Department, 2025 PJM Long-Term Load Forecast Report (PJM, 2025). Unless otherwise indicated, all data used in calculating this analysis were drawn from this source. Underlying data files and supplementary materials are available in “Load Forecast Development Process,” Resource Adequacy Planning, PJM, last updated February 6, 2026, https://www.pjm.com/planning/resource-adequacy-planning/load-forecast-dev-process.
- Mark Z. Jacobson et al., “Low-Cost Solution to the Grid Reliability Problem with 100% Penetration of Intermittent Wind, Water, and Solar for All Purposes,” Proceedings of the National Academy of Sciences (PNAS) 112, no. 49 (November 2015): 15060–65. Jacobson’s paper was heavily criticized in Christopher T. M. Clack et al., “Evaluation of a Proposal for Reliable Low-Cost Grid Power with 100% Wind, Water, and Solar,” PNAS 114, no. 26 (June 2017): 6722–27. After that article was published, Jacobson sued the authors for libel. He withdrew the lawsuit in 2018, although he continued to insist that the criticisms were invalid.
- Jonathan Lesser, Electrification Without Electricity: An Epic Failure in Planning for Critical Infrastructure (National Center for Energy Analytics [NCEA], 2025).
- Depending on cloud opacity, solar PV can generate limited quantities of electricity.
- There are other standards regarding power quality that specify maintaining voltage levels and frequencies within well-defined ranges to prevent damage to customers’ equipment.
- The Brattle Group, Value of Lost Load Study Final Report (Public Utility Commission of Texas, 2024), 3, table ES-1.
- Previously, RTOs were referred to as independent system operators (ISOs), and three still include this term in their names: ISO New England, New York Independent System Operator, and Midcontinent Independent System Operator.
- These are Southeastern Regional Transmission Planning and Florida Reliability Coordinating Council.
- The 18 nuclear plants that currently provide about one-third of the electricity generated are two in New Jersey (Salem and Hope Creek); four in Pennsylvania (Beaver Valley, Limerick, Peach Bottom, and Susquehanna); five in Illinois (Braidwood, Byron, Dresden, LaSalle, and Quad Cities); two in Ohio (Davis-Besse and Perry); two in Virginia (North Anna and Surry); and one in Maryland (Calvert Cliffs). The youngest of these plants (Limerick Unit 2) is 36 years old and the oldest (Dresden Unit 2) is 56 years old.
- “Preliminary Monthly Electric Generator Inventory (Based on Form EIA-860M as a Supplement to Form EIA-860),” Analysis & Projections, Electricity, EIA, released April 23, 2026, https://www.eia.gov/electricity/data/eia860m.
- Note that the winter peak load corresponds to periods spanning two years (e.g., December 2024 to February 2025 is shown as the 2025 winter peak in the chart).
- This occurred on June 23, 2025 between 5:00 and 6:00 p.m. PJM’s 2026 long-term forecast shows even higher summer and winter peaks than those of the 2025 forecast. The 2026 forecast was not released until after the analysis for this report was completed.
- The forecasts include estimates of load associated with additional electrification, including increases in EVs as well as in space and water heat load.
- “Electric Vehicle Infrastructure Toolbox,” Alternative Fuels Data Center, U.S. Department of Energy (DOE), accessed May 5, 2026, https://afdc.energy.gov/evi-x-toolbox#/evi-pro-loads.
- Jenny Love et al., “The Addition of Heat Pump Electricity Load Profiles to GB Electricity Demand: Evidence from a Heat Pump Field Trial,” Applied Energy 204 (October 2017): 332–42.
- PNUCC/NWGA Power & Natural Gas Planning Taskforce and PNUCC System Planning Committee, A Discussion on Electrifying Light Duty Vehicles and Natural Gas Heating in the Northwest (Pacific Northwest Utilities Conference Committee; Northwest Gas Association, 2019), 15, figure 9. The simplified energy enthalpy model is described in appendix A.
- A 2018 study prepared by Energy + Environmental Economics estimated peak demand of around 7.8 kW using a different simulation model. See Dan Aas et al., Pacific Northwest Pathways to 2050 (Energy + Environmental Economics, 2018).
- This scenario assumes that the Three Mile Island nuclear plant is restarted in 2028.
- Midcontinent Independent System Operator (MISO), “Resource Adequacy Assumptions,” presented at MISO Series 2 Futures Workshop, March 19, 2025. For a detailed explanation of the methodologies used by MISO and other RTOs—including PJM—to estimate capacity values for wind and solar, see Isaac Orr and Mitchell Rolling, “More Is Less with Wind and Solar,” Energy Bad Boys (blog), October 18, 2025.
- PJM, “Preliminary ELCC Class Ratings for Period Delivery Year 2026/27—Delivery Year 2034/35,” June 19, 2025.
- “Form EIA-860 Detailed Data with Previous Form Data (EIA-860A/860B),” 2024 data, EIA, released September 9, 2025, https://www.eia.gov/electricity/data/eia860.
- “Generation by Fuel Type,” Data Miner 2, PJM, accessed May 11, 2026, https://dataminer2.pjm.com/feed/gen_by_fuel.
- Vilayanur Viswanathan et al., “Levelized Cost of Storage,” in 2022 Grid Energy Storage Technology Cost and Performance Assessment (DOE, 2022), 120–35.
- If the existing nuclear capacity were retired, an additional 148,000 MW of wind; 81,000 MW of solar; and 320,000 MW of battery would be required.
- Viswanathan et al., “Levelized Cost of Storage,” 120–35.
- Another way to interpret this assumption is that realized inflation is offset by decreases in the inflation-adjusted resource costs over time. For example, over a 20-year modeling period, a 2% annual inflation rate would result in a 49% increase. Hence, this analysis implicitly assumed that all inflation-adjusted costs decreased by 49% over the modeling period. This is calculated as: (1.02)20 − 1.00 = 0.49.
- Energy Institute, 2026 Statistical Review of World Energy, 75th ed. (Energy Institute, 2026), 26. Values have been converted from metric tons to U.S. short tons.
- National Center for Environmental Economics, Report on the Social Cost of Greenhouse Gases: Estimates Incorporating Recent Scientific Advances (U.S. Environmental Protection Agency, 2023).
- Vaclav Smil, Power Density: A Key to Understanding Energy Sources and Uses (MIT Press, 2018).
- This includes the total area of states in which PJM does not cover the entire state, including Illinois, Indiana, Kentucky, and North Carolina. (The small part of southern Michigan covered by PJM has been excluded.)
- Lars Schernikau, The Battery Storage Delusion: Utility-Scale Batteries Are No Silver Bullet (NCEA, 2025), 3. The original figure was 700,000 metric tons.
- See, for example, Evan N. Dethier et al., “A Global Rise in Alluvial Mining Increases Sediment Load in Tropical Rivers,” Nature 620 (2023): 787–93; Zexi Shen et al., “Mining Can Exacerbate Global Degradation of Dryland,” Geophysical Research Letters 48, no. 21 (November 2021): e2021GL094490; and Zipeng Lin et al., “Public Water Risk Concerns Triggered by Energy-Transition-Mineral Mining,” Resources, Environment, and Sustainability 19 (March 2025): 100196.
- This material was published as PJM Resource Adequacy Planning Department, Long-Term Load Forecast Report; supplemental information can be found at “Load Forecast Development Process.”
- Fitch Ratings, “Fitch Rates Dominion Energy’s Senior Notes ‘BBB+’,” FitchRatings.com, May 7, 2025.
- Wind and solar output data for PJM can be found using its datasets. See “Solar Generation,” Data Miner 2, PJM, https://dataminer2.pjm.com/feed/solar_gen/definition; and “Wind Generation,” Data Miner 2, PJM, https://dataminer2.pjm.com/feed/wind_gen/definition.
-2%20(15).png)
-6%20(8).png)
-3%20(1).png)