
U.S. Energy Security Comes Only with Maritime Strength
-2%20(7).png)
The closure of the Strait of Hormuz exposed the risks that energydisruptions pose to U.S. national security.
Listen
The Issue
The closure of the Strait of Hormuz exposed the risks that energy disruptions pose to U.S. national security. The United States may be energy-dominant, but maintaining that position depends on foreign-owned ships to transport energy commodities and other critical goods. Without access to those ships, U.S. energy dominance cannot be sustained—and national security is at greater risk.
The production of petroleum and other critical materials is useless if the output cannot reach consumers. This is the hidden risk facing the United States, which has only 188 U.S.-flagged vessels in its fleet1—nowhere near the number needed to move the liquefied natural gas (LNG), crude oil, agricultural products, and coal that it exports. Neither does the nation have sufficient ships to handle the critical imports of petroleum products, minerals, and other goods needed to keep the U.S. economy operating efficiently.
This vulnerability has been recognized by both Congress and the Trump administration, each of which has presented a plan to revitalize the U.S. shipbuilding and shipping industries. The SHIPS for America Act and the Maritime Action Plan are designed to spur new ship construction, expand and modernize shipyards, and increase the mariner workforce.2 Together, these efforts aim to rebuild the U.S. maritime industry and, in doing so, to advance the objectives outlined in the Merchant Marine Act of 1936: a commercial fleet that can handle the country’s internal shipping and a meaningful portion of its overseas trade, serve as a military and naval backup in wartime, and remain American-owned and -crewed.3
U.S. energy dominance is guaranteed only if the nation can control its critical exports and imports and prevent a shipping boycott from undermining its economic strength. Any vulnerability in this area could be exploited by adversaries. Only through rapid growth can the U.S.-flagged fleet ensure national security.
The Reality
In 2019, the success of the domestic fracking industry allowed the United States to become a net oil exporter. By May 2026, the United States was exporting 13.3 million barrels per day of crude oil and refined petroleum products yet importing only 7.4 million barrels per day, resulting in net exports of about 6 million barrels per day.4 The United States, currently the world’s largest petroleum exporter, is helping to ease the global petroleum shortage caused by the closure of the Strait of Hormuz.5
The United States has exported natural gas for years, with almost all exports transported by pipeline to Canada and Mexico. The United States began exporting LNG in 2016 and has since become the world’s largest LNG exporter. As with petroleum, the volume of LNG shipped abroad is growing; this increase has provided relief to nations affected by the loss of Persian Gulf supplies.6 Almost every barrel of oil or ton of gas travels in foreign-flagged vessels, as the U.S.-flagged fleet includes few oil tankers suited to carrying crude for export and only one LNG carrier.7
Furthermore, the closure of the Strait of Hormuz has affected not only oil and gas but also other strategic minerals. For example, sulfur—which is extracted from oil and used in fertilizers—is now in short supply, thus inflating food costs.8 The shortage of helium gas, a critical material in the manufacture of computer chips, is creating challenges for the global technology industry.9 The list is lengthy.
California offers an example of the economic disruptions that a shortage of U.S.-flagged ships could create. For years, the state’s political leaders have attacked the oil industry—not just with rhetoric but also with taxes and mandates that have made it costly and challenging to operate production and refining facilities. In response, oil companies have opted to shut down operations,10 in turn depriving the state’s oil business of domestic oil supplies and its consumers of refined petroleum product volumes. Demand, however, continues to increase, which has made the supply challenge more difficult.
Last year, California imported 61% of its refinery crude oil input. More importantly, because the state has lost an additional 17% of its refinery capacity in recent months, it must also import more gasoline, diesel, and jet fuel. In 2025, gasoline imports more than doubled from those of 2023.11 Approximately 12% of shipborne gasoline in 2025 came via the Bahamas, as the transshipment route has become a workaround for the lack of Jones Act–compliant oil tankers.12
With Asian countries now hoarding refined products for domestic consumption,13 California must seek greater supplies from other sources—primarily Gulf Coast outlets—to meet the state’s oil needs and allow it to fulfill its role in supplying approximately 50 U.S. Department of Defense facilities in Western states.14 The lack of U.S.-flagged tankers prompted the federal government to issue a waiver of Jones Act restrictions on foreign-flagged ships to move cargo between U.S. ports and thus avoid supply shortages.15
The shipping challenge facing the United States is a lack of U.S.-flagged vessels. In 2024, waterborne trade accounted for just over 42% of the value ($2.2 trillion) and about 79% of the weight (1.7 billion tons) of U.S. international trade. Yet the U.S.-flagged fleet transported only 0.2% of global container traffic, though the nation’s ports processed 6% of that trade.16
These statistics highlight how important waterborne trade is to the U.S. economy by underscoring the need to maintain a domestic shipping industry. This requirement is institutionalized in law. The Merchant Marine Act of 1936, as amended and now codified at 46 U.S.C. § 50101, states:
(a) Objectives.—It is necessary for the national defense and the development of the domestic and foreign commerce of the United States that the United States have a merchant marine—
(1) sufficient to carry the waterborne domestic commerce and a substantial part of the waterborne export and import foreign commerce of the United States and to provide shipping service essential for maintaining the flow of the waterborne domestic and foreign commerce at all times;
(2) capable of serving as a naval and military auxiliary in time of war or national emergency;
(3) owned and operated as vessels of the United States by citizens of the United States;
(4) composed of the best-equipped, safest, and most suitable types of vessels constructed in the United States and manned with a trained and efficient citizen personnel; and
(5) supplemented by efficient facilities for building and repairing vessels.
(b) Policy.—It is the policy of the United States to encourage and aid the development and maintenance of a merchant marine satisfying the objectives described in subsection (a).17
The current commercial shipping fleet fails to meet the first objective of the act. Neither the government nor the shipping industry has developed a plan to meet that objective, thus leaving the U.S. economy vulnerable to disruption by adversaries.
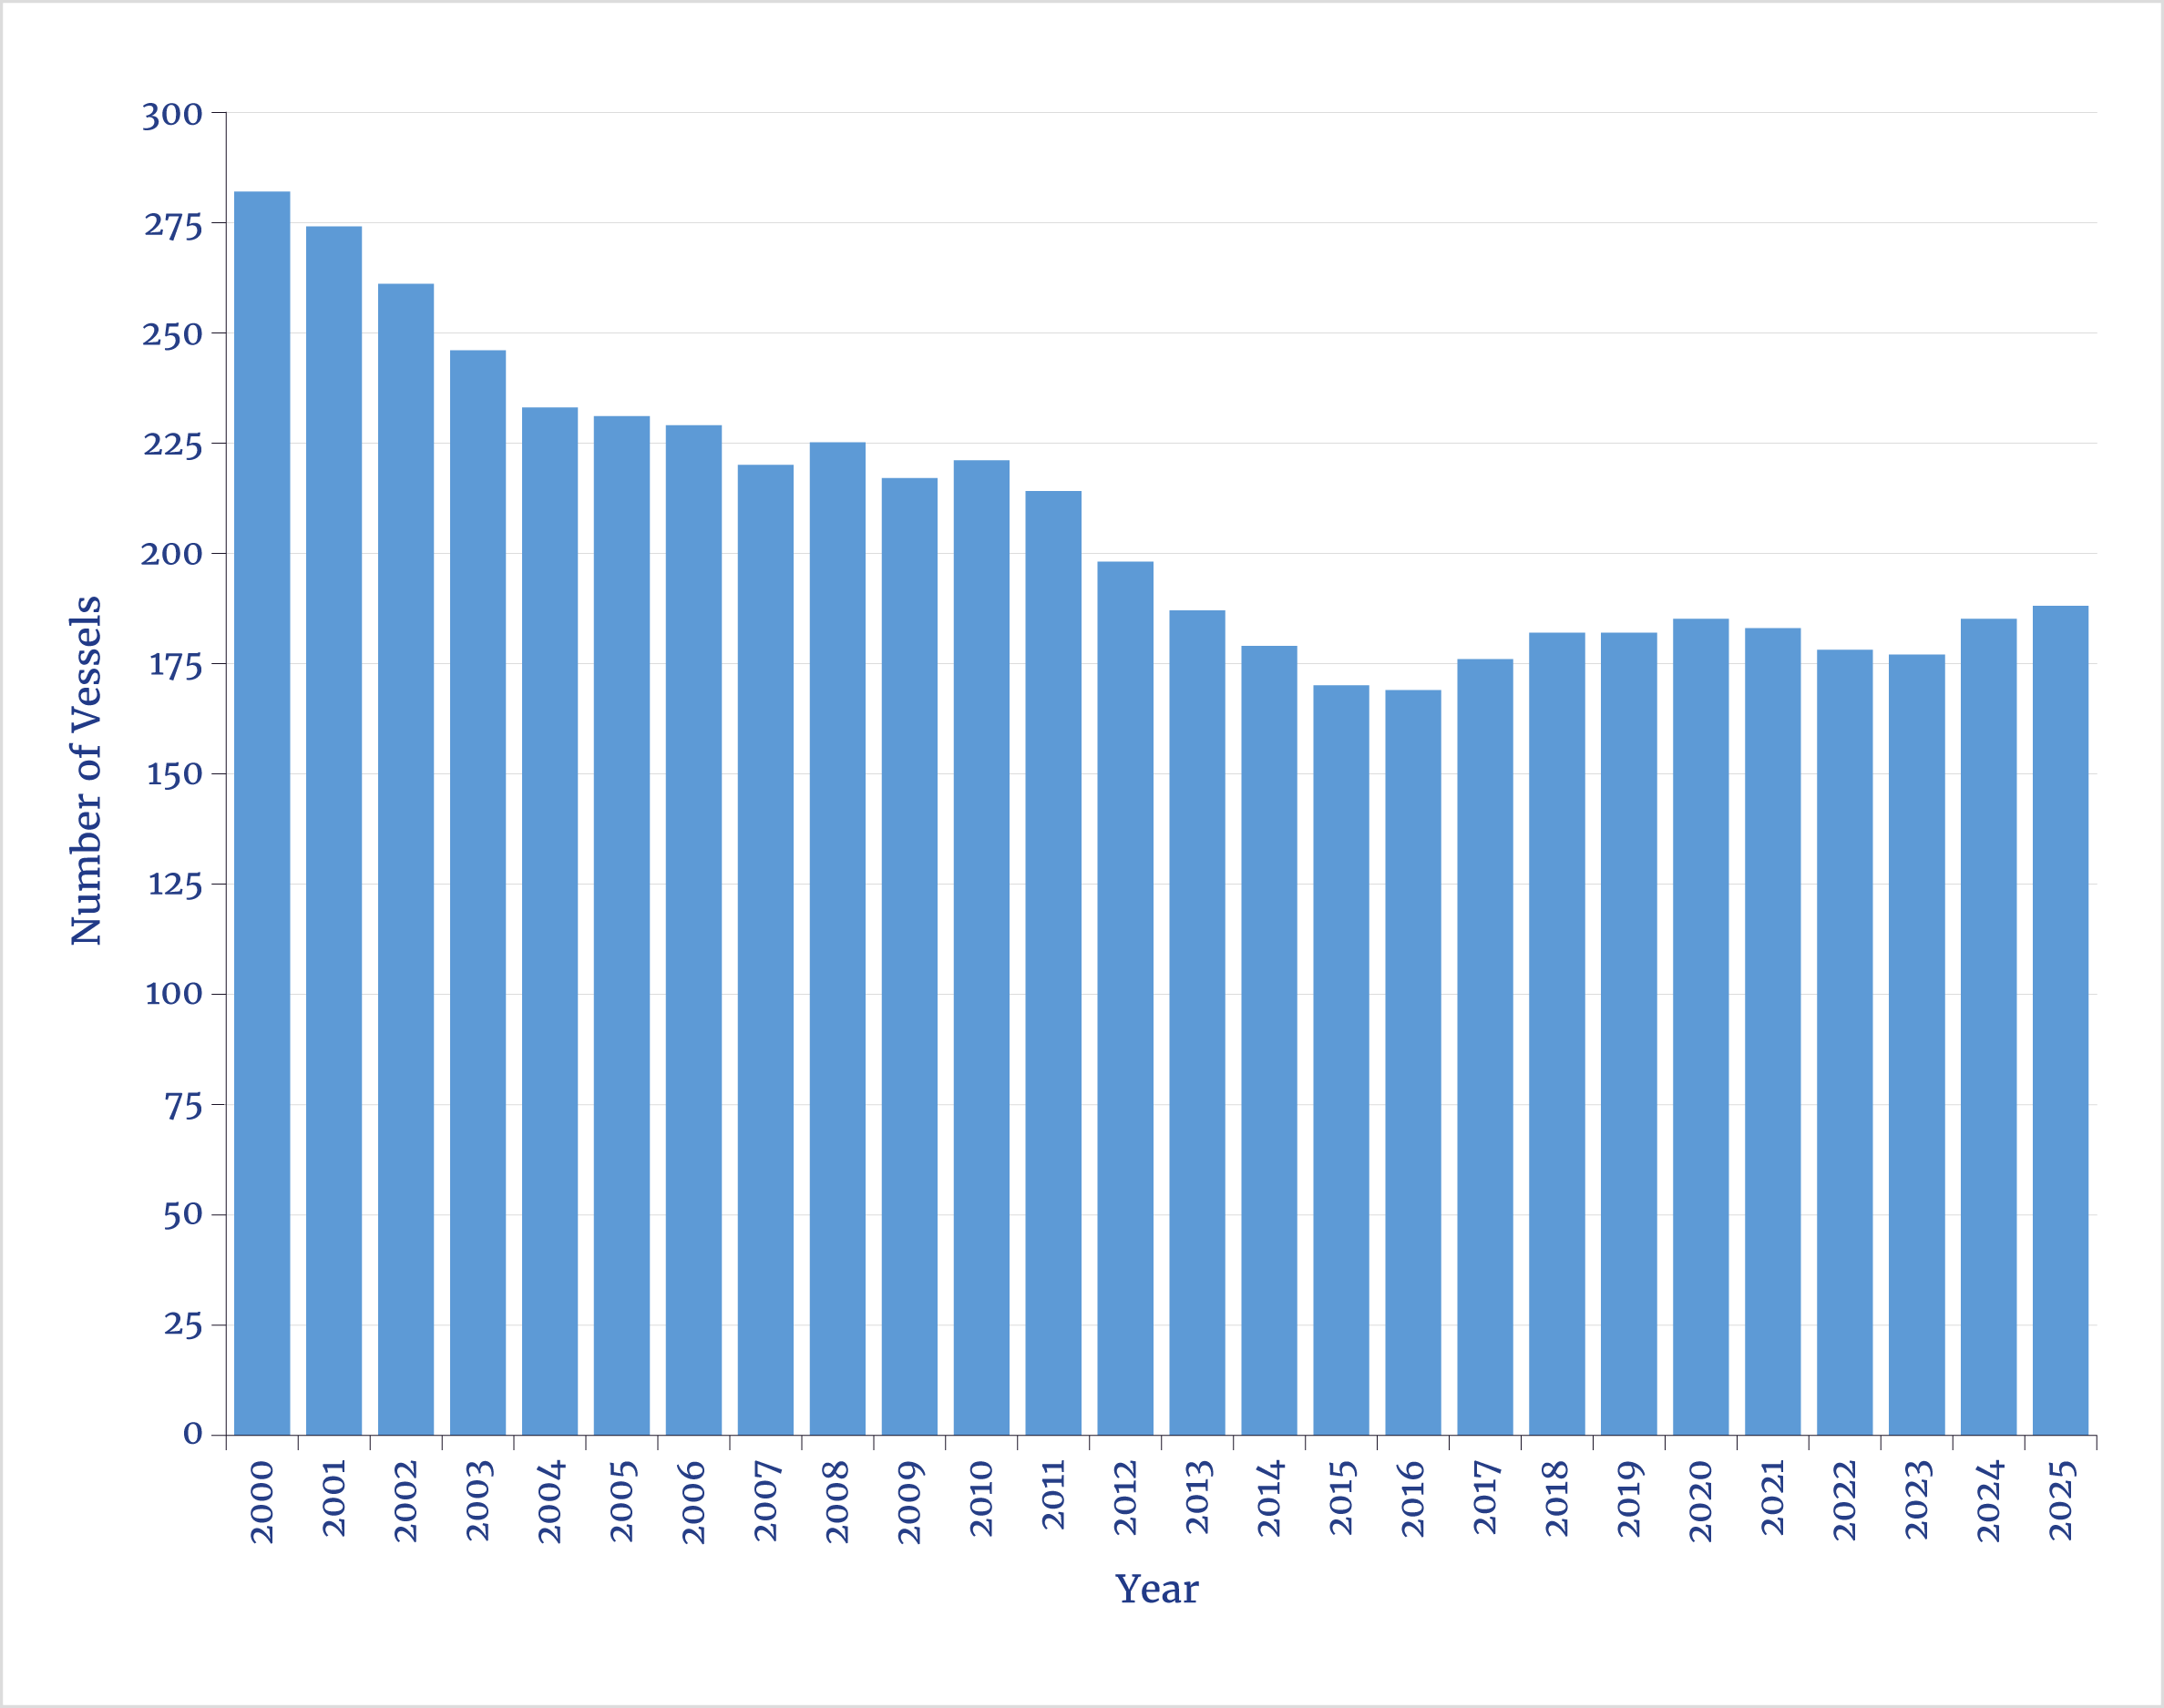
As shown in figure 1, the U.S.-flagged merchant fleet has declined substantially since 2000. In March 2026, the U.S.-flagged fleet comprised 188 vessels of 1,000 gross tons or more, dominated by tankers (75), container ships (58), vehicle carrier ships (22), and general cargo ships (18). There were a few each of roll-on/roll-off (Ro-Ro), container/Ro-Ro, and dry bulk ships.18These were all oceangoing vessels, not limited to coastal trade and Great Lakes operations.
Figure 1. Vessels of the U.S.-Flagged Merchant Fleet, by Year: 2000–2025
Source: Data from “Table 1-24: Number and Size of the U.S. Flag Merchant Fleet and Its Share of the World Fleet,” National Transportation Statistics, Bureau of Transportation Statistics, accessed July 17, 2026, https://www.bts.gov/content/number-and-size-us-flag-merchant-fleet-and-its-share-world-fleet.
In 2025, the U.S. registry of ships ranked seventh, accounting for 3% of the vessels in the world’s fleet. But by carrying capacity, which is measured as deadweight tonnage—the total weight a vessel can carry, including cargo, fuel, water, and stores—the U.S. ranked only 23rd.19 While the United States has many vessels in its fleet, most are comparatively small; the average U.S. vessel has a carrying capacity of about 3,800 deadweight tons, putting it in 34th place.20
However, the U.S.-flagged fleet is dominated by tankers and container ships. In 2024, there were 189 ships in the U.S.-flagged fleet. The 55 tankers represented 29% of the fleet, while the 24 container ships accounted for 13%.21
In 2025, an additional U.S.-flagged vessel was added to the fleet: the 32-year-old, Jones Act–compliant LNG carrier American Energy, which is owned by Crowley Maritime Corporation and dedicated to supplying LNG to Puerto Rico under a unique provision of the act.22 This ship, with its capacity of 130,400 cubic meters of LNG, has about half the carrying capacity of some larger modern LNG carriers.23 American Energy was built abroad but later reflagged and became Jones Act–compliant. It is the only LNG carrier in the U.S.-flagged fleet—underscoring the vulnerability that the United States, the world’s largest LNG supplier, would face if foreign-owned LNG ships were to boycott its trade.
There is only one order at present for an LNG carrier to be built in a U.S. shipyard, along with an option for a second vessel.24 The order was placed last summer by Hanwha Shipping, a U.S. subsidiary of Hanwha Ocean, at the Hanwha Philly Shipyard. This marks the first U.S. LNG ship order in 50 years.25
The LNG ship order was the first of multiple tanker vessel orders placed by Hanwha Shipping as part of the South Korean shipyard’s efforts to help revitalize the U.S. shipbuilding industry.26 This industry has been in steady decline since the end of World War I, though it was revived during World War II to build the merchant and naval vessels that were needed to transport fuel, materials, weapons, and personnel in support of the war effort.27
Since World War I, 80 U.S. shipyards have built vessels for U.S. military and commercial customers. Only five shipyards currently build naval vessels. There are 15 smaller shipyards that build commercial vessels, offshore drilling rigs, and support vessels, which are smaller, less complicated, and cheaper. Sixty shipyards are no longer in business due to decades of neglect in this critical industry.28 Commercial shipbuilding, once a dominant industry, has been allowed to atrophy for decades. U.S. shipbuilding in the 1970s represented roughly 5% of global new-build capacity, with domestic shipyards typically launching 15–25 vessels annually.29
In 1981, President Ronald Reagan ended the construction-differential subsidy that had been established by the Merchant Marine Act of 1936 and amended by the Merchant Marine Act of 1970. The subsidy was designed to support the domestic commercial shipping industry by covering up to 50% of shipbuilding costs.30 Subsidies, however, were not aligned with Reagan’s free-market principles and determination to reduce government intervention in the economy. The result of the policy shift was a dramatic decline in U.S. shipbuilding. The number of large, oceangoing commercial vessels on order fell from 69 in 1980 to zero by 1988. Shipyard employment never regained its 1981 peak—the highest level since the end of World War II.31 The United States now builds one to five new ships annually—a mere 0.003% of the global tonnage built in 2025.32
The shrinking output of U.S. shipyards would not be worrisome if not for China’s aggressive expansion into this sector. China State Shipbuilding Corporation, China’s largest shipbuilding company, delivered more commercial tonnage in 2024 than that of all U.S. shipyards combined since the end of World War II.33
China has made shipbuilding a national economic and military priority. It followed the game plan of Japan after World War II and South Korea after the Korean War. Each nation leveraged its economic and shipbuilding capabilities to create global industries that helped lift its economy out of the doldrums.
In 2024, China built 39 million gross tons worth of ships, or 55% of the world total. Three Asian economies—China, Japan, and South Korea—built 95% of the world’s ships. The United States accounted for a negligible share in 2024: just 0.04% of the world’s tonnage.34
Why has China been able to dominate the world’s shipbuilding industry? It is subsidized by the Chinese government, as are shipyards in Japan, South Korea, and other nations. U.S. shipyards no longer receive shipbuilding subsidies, which explains why commercial shipbuilding has evaporated. Subsidized ships are often a small fraction of the price of new U.S. ships; this has created a significant financial hurdle for owners and shipyards.35 Nevertheless, recent orders of U.S. ships have been remarkable, suggesting that the new shipyard owners are willing to subsidize new-build efforts to secure orders and begin modernizing the shipyards.
As of 2026, U.S. shipyards employed about 150,000 workers.36 In 2019, the industry generated $9.9 billion in direct labor income and contributed $12.2 billion to the nation’s gross domestic product (GDP).37 For each shipyard job, the associated domestic supplier base created about 2.6 additional jobs.38 In total, the industry accounted for nearly 400,000 jobs, $28.1 billion in labor income, and $42.4 billion in GDP.39 This is an economically important industry, but it is even more significant from a national security perspective.
The 2025 U.S. LNG industry can be examined as a case study in how the lack of ships creates vulnerability. The United States exported 24.6 billion cubic feet per day (Bcf/d) of natural gas, with 15.1 Bcf/d shipped worldwide and the remainder moved via pipeline. Forecasts anticipate U.S. LNG exports to reach at least 22 Bcf/d in 2029.40
At 15 Bcf/d of LNG, the industry needs three large LNG carriers per day and more than 1,000 trade journeys per year to transport the output.41 The number of LNG carriers required will depend on cargo destinations.
For example, Houston and Rotterdam are about 5,000 nautical miles apart, which would take 11 days to travel at a top speed of 19 knots. However, a shipment from Houston to Singapore—approximately 8,600 nautical miles—would take roughly 25 days at the same speed. Given the distances, an LNG tanker can make one and a half trips per month to Europe but only one round trip every two months for routes to Asia. At that rate, 60 ships would be needed to transport LNG to Rotterdam but 180 ships to transport LNG to Singapore. Thus, in order to serve Asian markets, far more ships must be built.42
A typical LNG carrier is more complex than a conventional commercial ship; because of that sophistication, a ship of this type generally requires about 51 months to build, compared with an average of 36 months for conventional vessels.43 Assuming that the U.S. shipbuilding industry could deliver five LNG carriers per year and that each requires over four years to construct, the final European-route ships would be delivered in 2042. Such a timetable means that the last of the new LNG carriers for an Asian-route-only fleet would arrive in the 2060s.
Waiting decades for the delivery of new-build LNG carriers does little to reduce U.S. shipping vulnerability. Furthermore, these lengthy timetables ignore the additional ships that are needed to meet increased LNG exports. Relying on foreign shipowners for the health of the nation’s entire LNG industry is a substantial economic risk that must be addressed. The U.S. oil and refined petroleum products industry has similar challenges: The nation needs ships to handle exports but also to carry crucial oil, coal, critical minerals, and product imports.
Perspective
Energy dominance can be assured only if the United States controls the export and import of energy fuels. A 2025 study projected that the U.S. LNG industry will contribute an additional $1.3 trillion to GDP by 2040 and create an average of 500,000 jobs annually.44 That economic benefit is at risk because the United States depends entirely on foreign LNG carriers to move those exports. A boycott by foreign LNG shipowners would shut down the industry and wreak havoc on the domestic energy sector. A lack of U.S.-flagged ships creates a similar risk for U.S. petroleum and coal industries as well as for the critical minerals sector.
Decades of neglecting the nation’s shipping and shipbuilding industries have created these economic vulnerabilities. Over the past 50 years, three-quarters of the U.S. shipbuilding industry has evaporated, and U.S. contribution to the world’s shipbuilding efforts is currently minuscule.
The U.S.-flagged fleet now consists of approximately 190 ships, many of which are beyond retirement age. They continue to operate, however, in order to support commercial trade and to be available to the U.S. military if needed.
The United States needs to modernize and grow its fleet. This goal can be achieved by building new vessels or by persuading foreign-flagged shipowners to reflag under the U.S. registry. However, new U.S.-built ships are more expensive than those constructed in other countries, where shipyards are often heavily subsidized. Reflagged vessels face higher operating costs because they must employ U.S. mariners and officers as well as comply with increased U.S. regulations.
Until the antiquated U.S. shipyards are upgraded and become more productive, it will take years to expand the U.S. fleet through construction. Reflagging ships would be faster than new construction, but enticing foreign owners to reflag will require guaranteed cargo commitments to offset their increased expenses. Persuading shipowners to build new vessels in U.S. shipyards will likely require subsidies to make domestic ship construction more price-competitive with subsidized foreign shipbuilding.
U.S. shipping and shipbuilding have a long and storied history—one that can be revitalized despite years of neglect.
- “U.S.-Flag Fleet Dashboard,” Maritime Administration, U.S. Department of Transportation, last updated March 2026, https://www.maritime.dot.gov/data-reports/us-flag-fleet-dashboard.
- SHIPS for America Act of 2025, S. 1541, 119th Cong. (2025); and The White House, America’s Maritime Action Plan (White House, 2026).
- Merchant Marine Act, 1936, ch. 858, § 101, 49 Stat. 1985 (codified as amended at 46 U.S.C. § 50101(a)).
- “Weekly Imports & Exports (Thousand Barrels per Day),” Petroleum & Other Liquids: Data, U.S. Energy Information Administration, released July 22, 2026, https://www.eia.gov/dnav/pet/pet_move_wkly_dc_NUS-Z00_mbblpd_4.htm.
- Organization of the Petroleum Exporting Countries, 2026 OPEC Annual Statistical Bulletin, 61st ed. (Organization of the Petroleum Exporting Countries, 2026), 52, table 5.5.
- Faouzi Aloulou et al., “Ten Years After First Sabine Pass Cargo, U.S. LNG Exports Are Still on the Rise,” Today in Energy, February 24, 2026.
- John Frittelli and Michael Ratner, “U.S. LNG Trade Rising, but No Domestic Shipping,” Congressional Research Service, May 4, 2018; John Frittelli, “Shipping U.S. Crude Oil by Water: Vessel Flag Requirements and Safety Issues,” Congressional Research Service, July 21, 2014; and Maritime Administration, United States-Flag Privately-Owned Merchant Fleet Report (U.S. Department of Transportation, 2026).
- Dawit Mekonnen and Kaltrina Temaj, “Food Prices Feel the Heat as War in the Middle East Rattles Commodity Markets,” World Bank Data Blog, May 22, 2026.
- Arshia Pasdar, “The Global Helium Crisis: What It Means for Semiconductor Manufacturing and Electronic Component Supply Chains,” J2 Sourcing, March 25, 2026.
- Institute for Energy Research, “California’s Refinery Situation Looks Like It Will Get Worse,” Institute for Energy Research, April 25, 2025.
- Shaheer Naveed and Eric Weiser, “As Reliance on Imported Gasoline Rises, California Adapts to a ‘New World’,” Oil Price Information Service, November 4, 2025; and “Annual Oil Supply Sources to California Refineries,” California Energy Commission, State of California, accessed July 23, 2026, https://www.energy.ca.gov/data-reports/energy-almanac/californias-petroleum-market/annual-oil-supply-sources-california.
- Institute for Energy Research, “California Turns to Imports as Its Refineries Close,” Institute for Energy Research, February 26, 2026. The Jones Act is section 27 of the Merchant Marine Act of 1920; see “Jones Act,” Legal Information Institute, Cornell Law School, accessed July 20, 2026, https://www.law.cornell.edu/wex/jones_act.
- Emma Ma, “As Iran War Drags On, China Keeps Tight Grip on Fuel Exports Despite Eased Curbs,” South China Morning Post, July 21, 2026.
- MilitaryBases.com, accessed August 11, 2026, https://militarybases.com.
- “Jones Act Waiver Tracker,” Cato Institute, accessed July 24, 2026, https://www.cato.org/jones-act-waiver-tracker.
- Bureau of Transportation Statistics, “U.S.-International Freight Trade by Transportation Mode,” in International Freight Gateways (U.S. Department of Transportation, 2025).
- 46 U.S.C. § 50101(a) (2018). This provision derives from the Merchant Marine Act, 1936, ch. 858, § 101, 49 Stat. 1985, as amended.
- “U.S.-Flag Fleet Dashboard”; and Maritime Administration, Merchant Fleet Report.
- “Deadweight Tons,” Glossary, U.S. Energy Information Administration, accessed July 21, 2026, https://www.eia.gov/tools/glossary/index.php?id=D; and “Merchant Fleet: World Fleet by Flag of Registration and Ship Type—Core Indicators—Annual (Analytical),” UNCTADstat, UN Trade and Development, last updated June 18, 2026, https://unctadstat.unctad.org/datacentre/dataviewer/US.MerchantFleet.
- United Nations Conference on Trade and Development, Review of Maritime Transport 2025: Staying the Course in Turbulent Waters (United Nations, 2025), 51, table II.2. The ranking was determined by re-sorting the table by deadweight tonnage.
- Maritime Administration, Fact Sheet—U.S. Domestic Shipping (U.S. Department of Transportation, 2024). Author’s calculations.
- Mike Schuler, “Crowley’s ‘American Energy’ Makes History as First U.S.-Flagged LNG Carrier Serving Puerto Rico,” gCaptain Daily, March 18, 2025.
- Raunek Kantharia, “Types of Tanker Ships: The Complete Classification Guide (Cargo, Size & Design),” Marine Insight, May 6, 2026.
- Nick Blenkey, “Hanwha Shipping Places Huge New Order at Hanwha Philly,” Marine Log, August 29, 2025.
- Hanwha Group, “Hanwha Shipping Orders LNG Carrier from Hanwha Philly Shipyard,” press release, July 23, 2025.
- Blenkey, “Hanwha Shipping Places Huge New Order.”
- “U.S. Merchant Shipbuilding Output, 1914–2023,” Global Output, U.S. Shipbuilding: The Record, accessed July 31, 2026, https://usshipbuilding.org/#chart-longrun-wrap.
- “Large or Otherwise Significant Shipbuilders,” Naval Marine Archive, accessed July 31, 2026, https://navalmarinearchive.com/sbh/shipyards/large.html.
- Congressional Research Service, U.S. Commercial Shipbuilding in a Global Context, In Focus (Congressional Research Service, 2023), 1.
- Merchant Marine Act, 1936, ch. 858, tit. V, 49 Stat. 1985 (formerly codified at 46 U.S.C. app. §§ 1151 et seq.); and Merchant Marine Act of 1970, Pub. L. No. 91-469, 84 Stat. 1018.
- Loren B. Thompson, “Heavy Seas: The U.S. Shipbuilding Industry Struggles to Stay on Course,” Lexington Institute, November 1, 1998. This article was originally published in Armed Forces Journal International.
- “Ship Building: Merchant Fleet Built—Annual (Analytical),” UNCTADstat, UN Trade and Development, last updated June 18, 2026, https://unctadstat.unctad.org/datacentre/dataviewer/US.ShipBuilding.
- Matthew P. Funaiole et al., Ship Wars: Confronting China’s Dual Use Shipbuilding Empire, Report of the Hidden Reach Special Initiative (Center for Strategic and International Studies, 2025).
- “Ship Building: Merchant Fleet.”
- Peter Tirschwell, “Questions of Need, Cost Dog U.S. Shipbuilding Ambitions,” Journal of Commerce, April 21, 2025.
- “All Employees, Ship and Boat Building,” U.S. Bureau of Labor Statistics, FRED, Federal Reserve Bank of St. Louis, updated August 7, 2026, https://fred.stlouisfed.org/series/CES3133660001.
- Maritime Administration, “Nation’s Shipyards Support $42.4 Billion in Gross Domestic Product,” press release, June 14, 2021.
- “Economic Security,” Shipbuilders Council of America, accessed August 12, 2026, https://shipbuildersusa.org/critical-issues-and-legislation/economic-security.
- Maritime Administration, “Nation’s Shipyards Support $42.4 Billion.”
- “United States LNG Market: The Global Export Leader,” United States, LNG.org, last updated March 24, 2026, https://liquefiednaturalgas.org/countries/usa.
- Kantharia, “Types of Tanker Ships.”
- “Port to Port Distance: Sea Distance Calculator,” OceanLook, accessed July 20, 2026, https://www.oceanlook.net/port/distance. Author’s calculations.
- [International Gas Union, 2025 World LNG Report (International Gas Union, 2025), 71; and AXSMarine, “Build Time for New Vessels Continues Rising,” AXSMarine (blog), November 8, 2024, last modified July 11, 2025.
- Commodity Insights and Market Intelligence, Major New U.S. Industry at a Crossroads: A U.S. LNG Impact Study—Phase 2 (S&P Global, 2025), 20.
About the author
Continue Reading
-2%20(14).png)
-2%20(10).png)
-2%20(9).png)
-2%20(8).png)
Regional Transmission Organizations: Problem or Solution?
The bulk power system—an interconnected network of generating plants and high-voltage transmission lines—is an often-overlooked part of the electric industry.