
U.S. Energy Security Index: Technical Appendix

Technical appendix to The Role of Energy in U.S. National Security, documenting the indicators, methodology, and data behind the U.S. Energy Security Index.
This is the Technical Appendix to The Role of Energy in U.S. National Security, the report that introduces NCEA’s U.S. Energy Security Index. It sets out the indicators, data sources, and calculation steps behind the index.
The National Center for Energy Analytics’ U.S. Energy Security Index (ESI) measures the geopolitical risks to the nation’s energy system, both historically and as a leading indicator of future trends based on current forecasts for the coming decade.
The methodology we employed and the indicators we selected for the index account for various aspects of geopolitical energy security. The goal is to create a single, overarching measure to answer a critical question: Is the nation’s energy security getting better or worse?
The process used to develop ESI was based on the following five steps:
1. Select a set of indicators that capture the salient geopolitical aspects of energy security.
To capture the energy security of the United States in a single index, we looked at 18 indicators—organized into six indicator groups—that address the key geopolitical vulnerabilities of the U.S. energy system. These groups are representative of the physical flow of fuels and minerals that support the major hydrocarbons; the minerals that are critical to new energy technologies and general energy infrastructure; and the cybersecurity threats to the energy system. In our view, these indicators provide a reasonably comprehensive picture of the foreign-based risks to the U.S. energy system.
We did not consider coal supplies in ESI, as the United States has always produced large volumes of both thermal and metallurgical coal and has long been a net exporter of both. Indeed, the risks surrounding coal are not geopolitical but rather domestically political and regulatory.1 Similarly, in measuring the risks associated with energy and mineral imports, we treated the highly integrated U.S., Canadian, and Mexican markets as a single domestic market.
2. Organize these indicators into groups representing different aspects of energy security.
ESI combines 18 risk indicators that measure U.S. energy security across a range of fuels,2 minerals,3 uranium,4 and systemic considerations.5 In general, the indicators we selected measure vulnerabilities associated with imports of traditional fuels, such as U.S. crude oil and natural gas; uranium and foreign enrichment services for nuclear power; aluminum, copper, and steel used in energy infrastructure; and cobalt, graphite, lithium, manganese, nickel, and rare earth elements used extensively in renewable technologies, batteries, and electric vehicles.
These 18 indicators were organized into six indicator groups, as shown in table A-1.
| Indicator Group | Indicator # | Risk to/from |
|---|---|---|
| Crude Oil | 1 | World Crude Oil and Natural Gas Plant Liquids Production |
| 2 | Net Crude Oil Imports | |
| Natural Gas | 3 | World Natural Gas Production |
| 4 | Net Natural Gas Imports | |
| Uranium | 5 | Net Uranium Imports |
| 6 | Uranium Enrichment Services | |
| Energy Technology Minerals | 7 | Net Cobalt Imports |
| 8 | Net Graphite Imports | |
| 9 | Net Lithium Imports | |
| 10 | Net Manganese Imports | |
| 11 | Net Rare Earths Imports | |
| Energy Infrastructure Minerals | 12 | Net Aluminum Imports |
| 13 | Net Copper Imports | |
| 14 | Net Nickel Imports | |
| 15 | Net Steel Imports | |
| Systemic | 16 | Cybersecurity |
| 17 | Crude Oil Price Volatility | |
| 18 | Strategic Petroleum Reserve Stocks |
3. Compile historical and forecast data for each indicator.
Nearly all of the data were drawn from government statistical agencies, such as the U.S. Energy Information Administration (EIA), the U.S. Geological Survey, and the British Geological Survey. To provide historical context, we gathered data going back to 1970, a few years before the Arab oil embargo made energy security a perennial political concern for Congress and U.S. presidents. The data used to develop the indicators are updated annually, which allows us to continue to track progress each year.
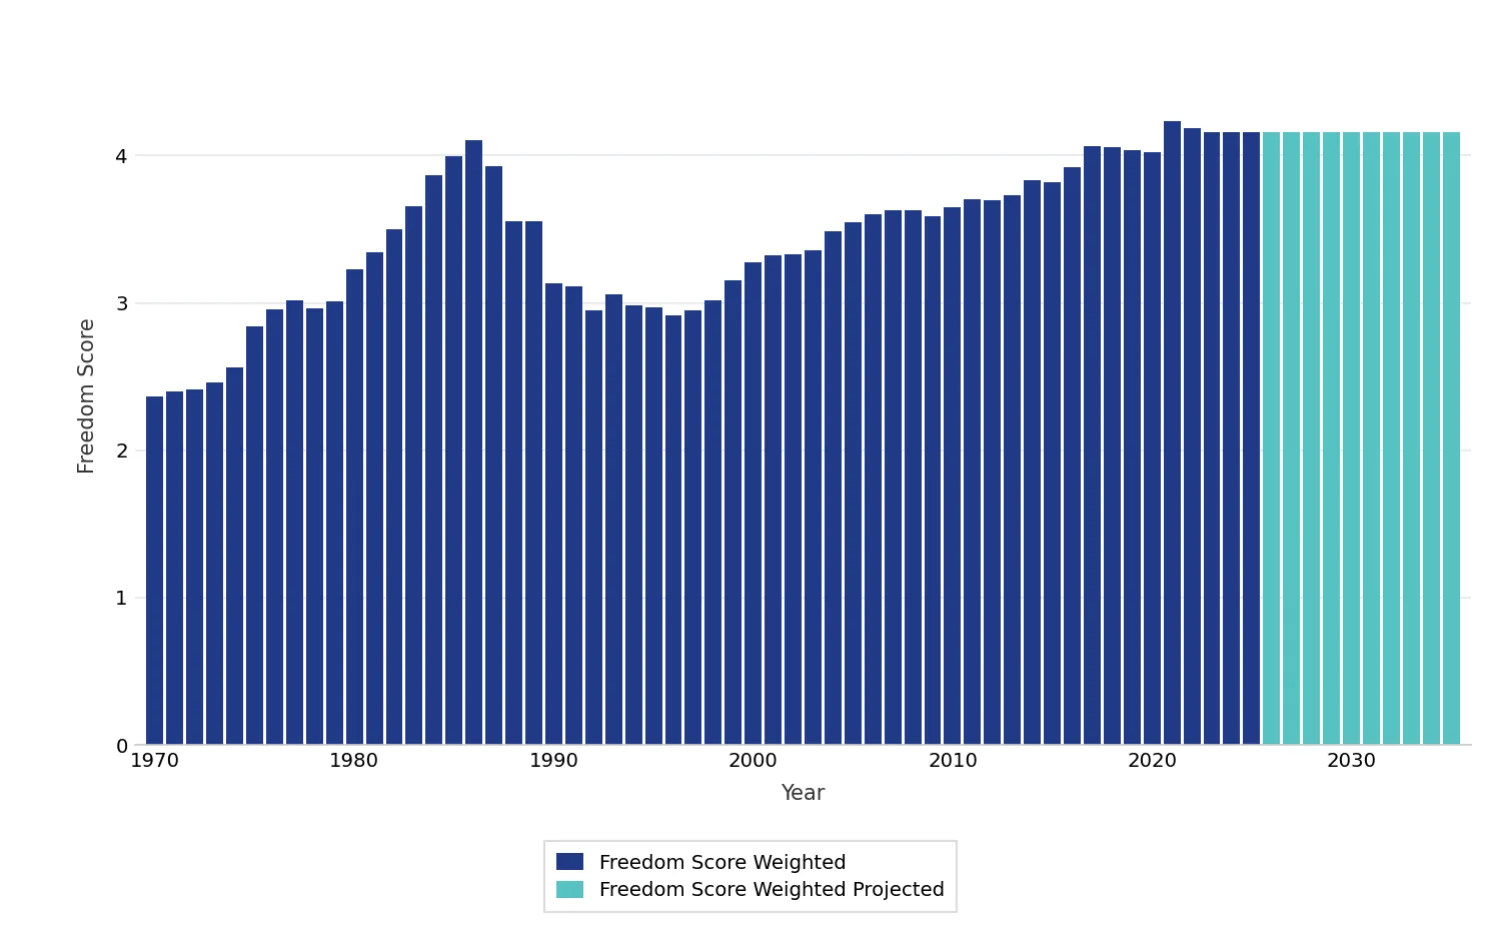
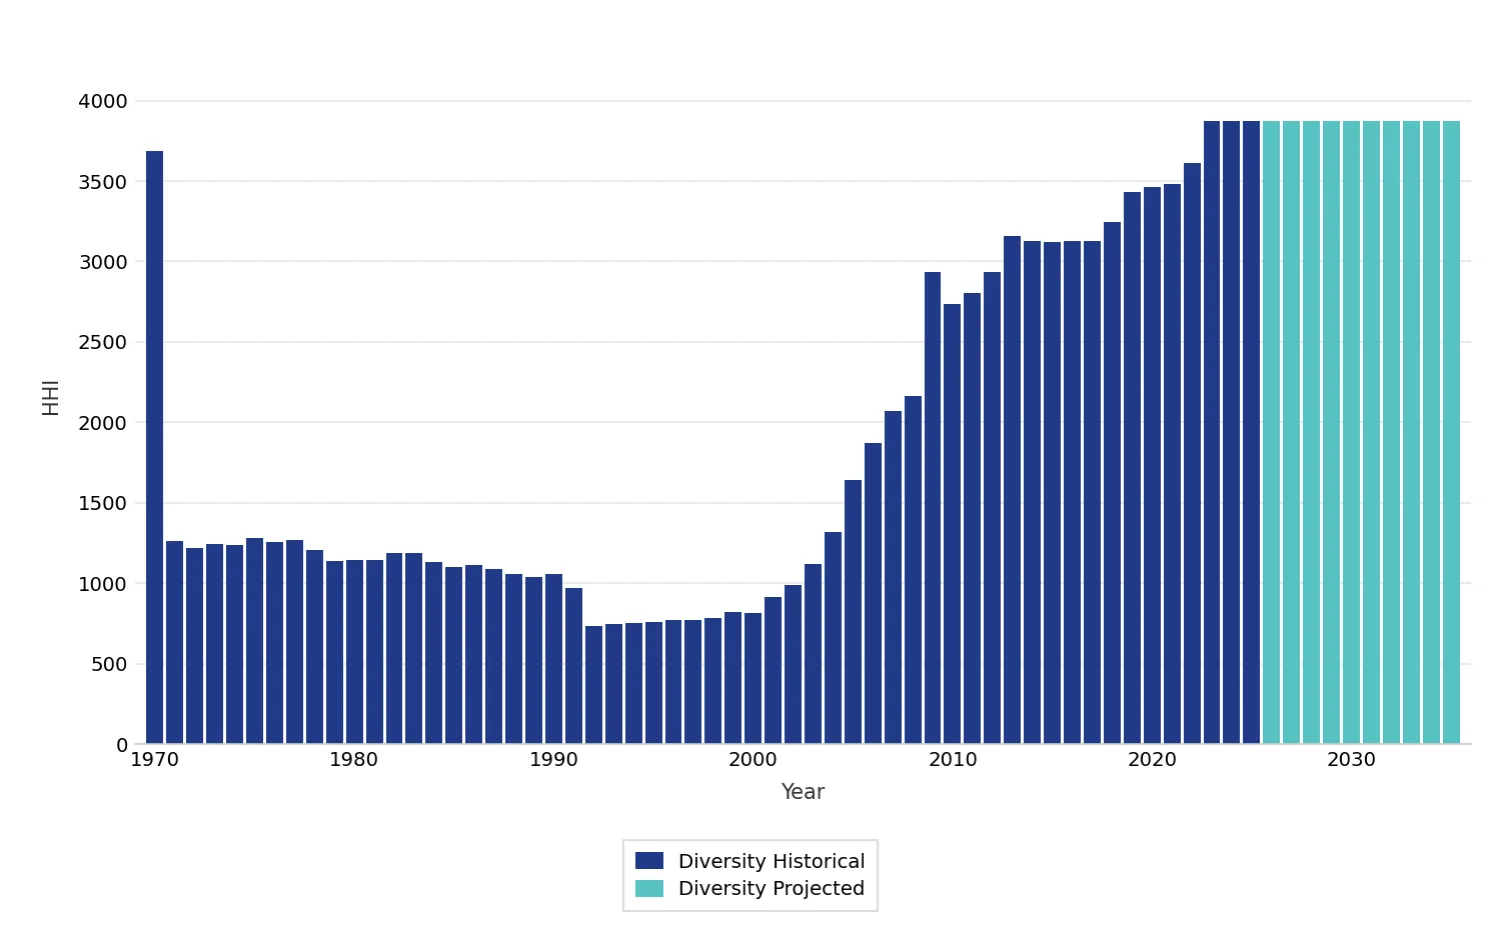
As a measure of the relative risk and security associated with global energy and mineral supplies, we used two of the primary elements of supply security: reliability and diversity of imports. To measure the reliability of supplies, we used scores of political and civil liberties developed by Freedom House in its annually published Freedom in the World series. To measure the diversity of supply, we employed the Herfindahl-Hirschman Index (HHI), a tool commonly used in antitrust analysis. This diversity component recognizes that greater supply diversity indicates greater competition and less volatility and, consequently, lowers risk.6
There also are risks attached to the transport of fuels and materials to markets, traditionally for oil but increasingly for natural gas and energy minerals. Large volumes of crude oil must pass through maritime chokepoints—most notably, the Strait of Hormuz, which handles about 20% of the world’s oil supply each day. To account for this vulnerability, we combined the market share of seven Persian Gulf States (Bahrain, Iran, Iraq, Kuwait, Qatar, Saudi Arabia, and United Arab Emirates) in the HHI calculations for oil and natural gas, as their crude oil exports transit the Strait of Hormuz.
Added to these market- and import-related indicators, ESI includes three systemic indicators designed to capture changing threats to the U.S. energy system that are not attached to the production or import of any particular commodity.
The Combined Crude Oil Price Volatility indicator increases the sensitivity of ESI to risks arising from global hostilities that affect energy production. The Strategic Petroleum Reserve Stocks indicator measures U.S. preparedness to manage disruptions in crude oil supplies. The Cybersecurity indicator measures the risks from cyberattacks on U.S. energy installations, which can originate from both malicious domestic actors and foreign governments hostile to the United States.
EIA’s Annual Energy Outlook (AEO) series was the primary source of the forecasts used in ESI. Where AEO projections were not available—such as the freedom weighting of international energy and mineral production—we applied a neutral assumption extended over the forecast period, using the most recent year of available data.
4. Normalize the data to allow adding them together for ESI.
When dealing with metrics expressed in different units, it becomes necessary to convert the data into comparable constituents that can be combined into a single index score. For ESI, each individual metric was normalized so that its maximum historical value—that is, its worst value—from 1970 to 2019 was set to 100. This system of normalization eliminates distortions that arise from using a single base year. It does not mean, however, that indicators’ risk scores cannot be greater than 100. For emerging risks in particular, there are instances of post-2019 indicator scores exceeding 100. With this in mind, a total ESI risk score approaching 100 or even 90 indicates very high levels of overall risk across many metrics. Also, it should be noted that there are no negative risk scores; the lowest possible risk score for both individual indicators and total ESI scores is zero.
5. Weigh and combine the data to create an overall score of geopolitical energy vulnerability.
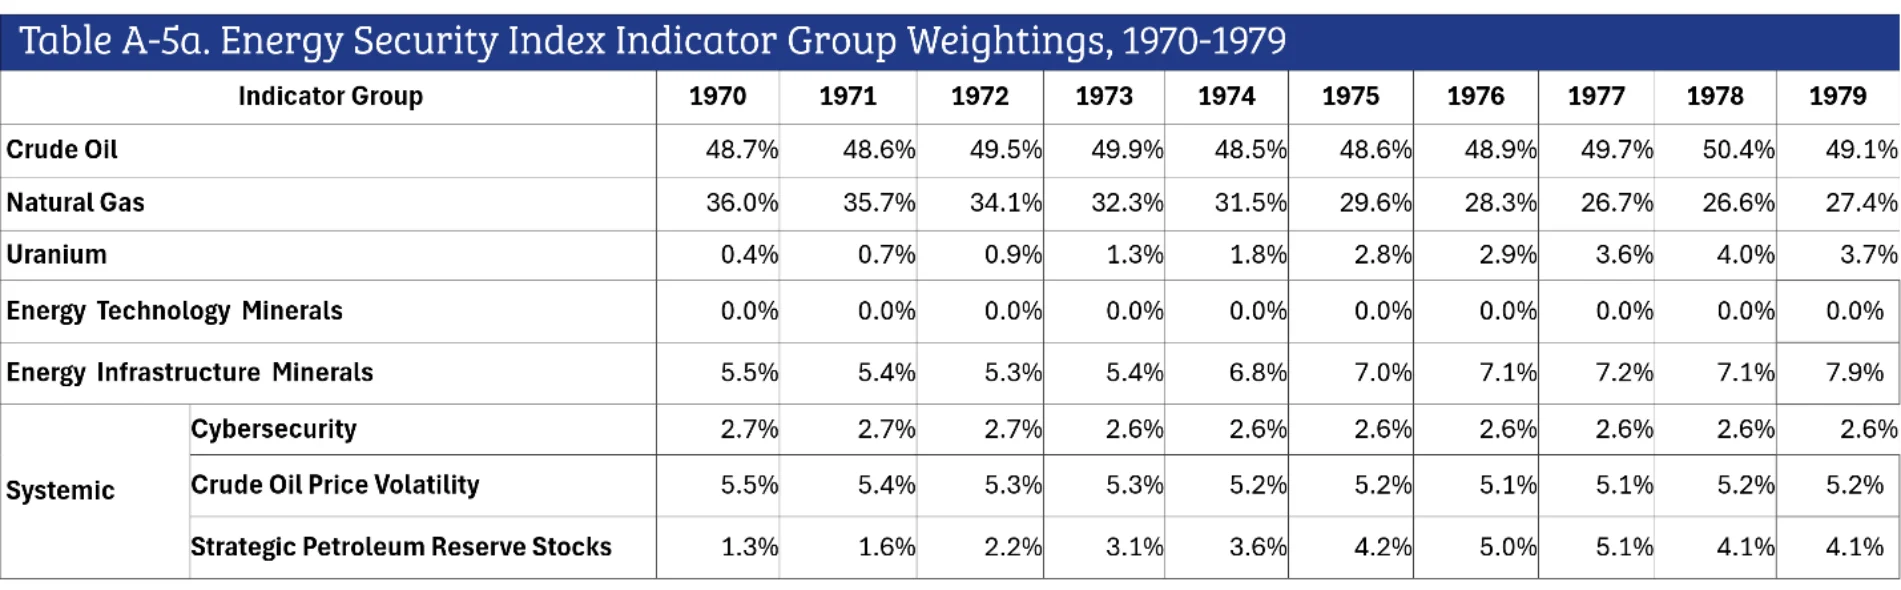
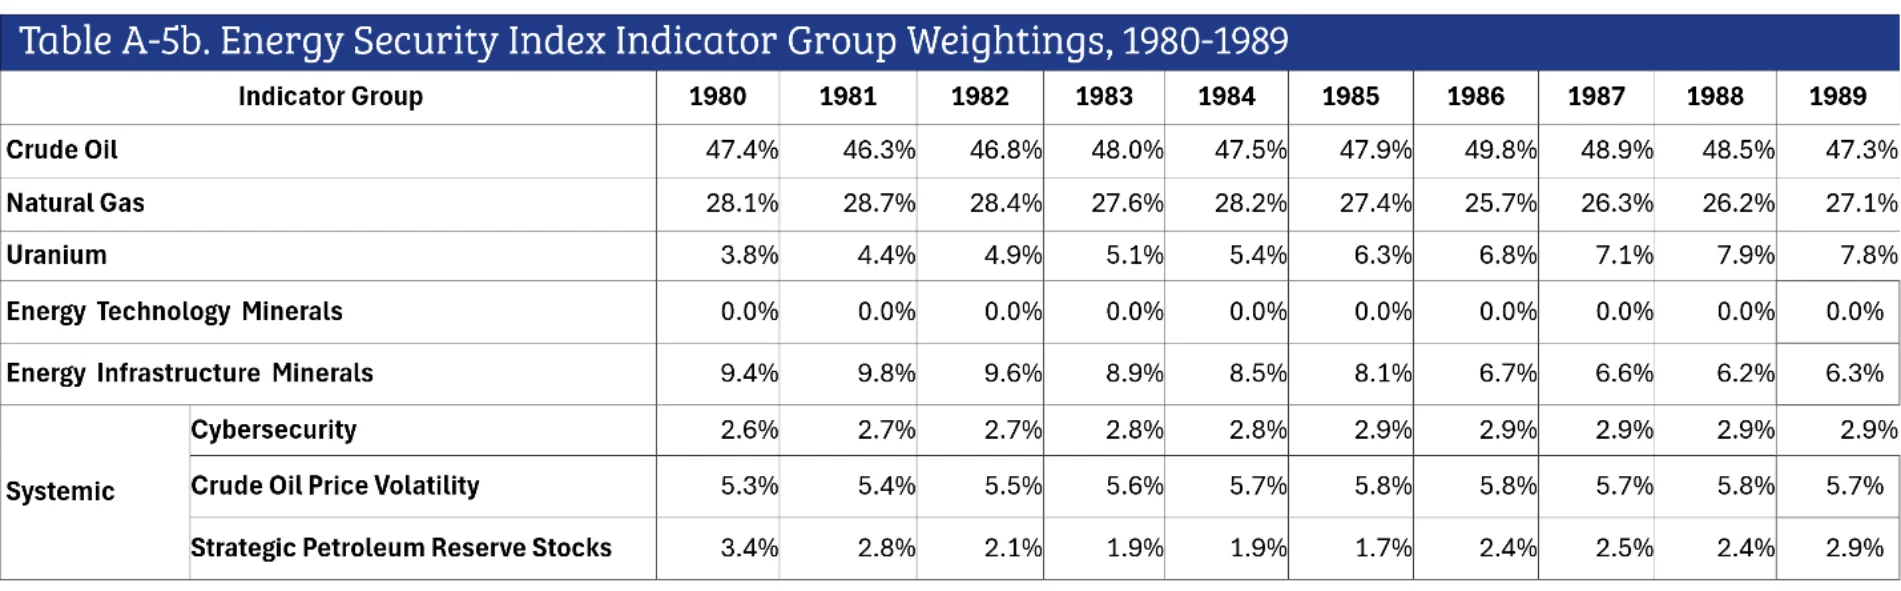
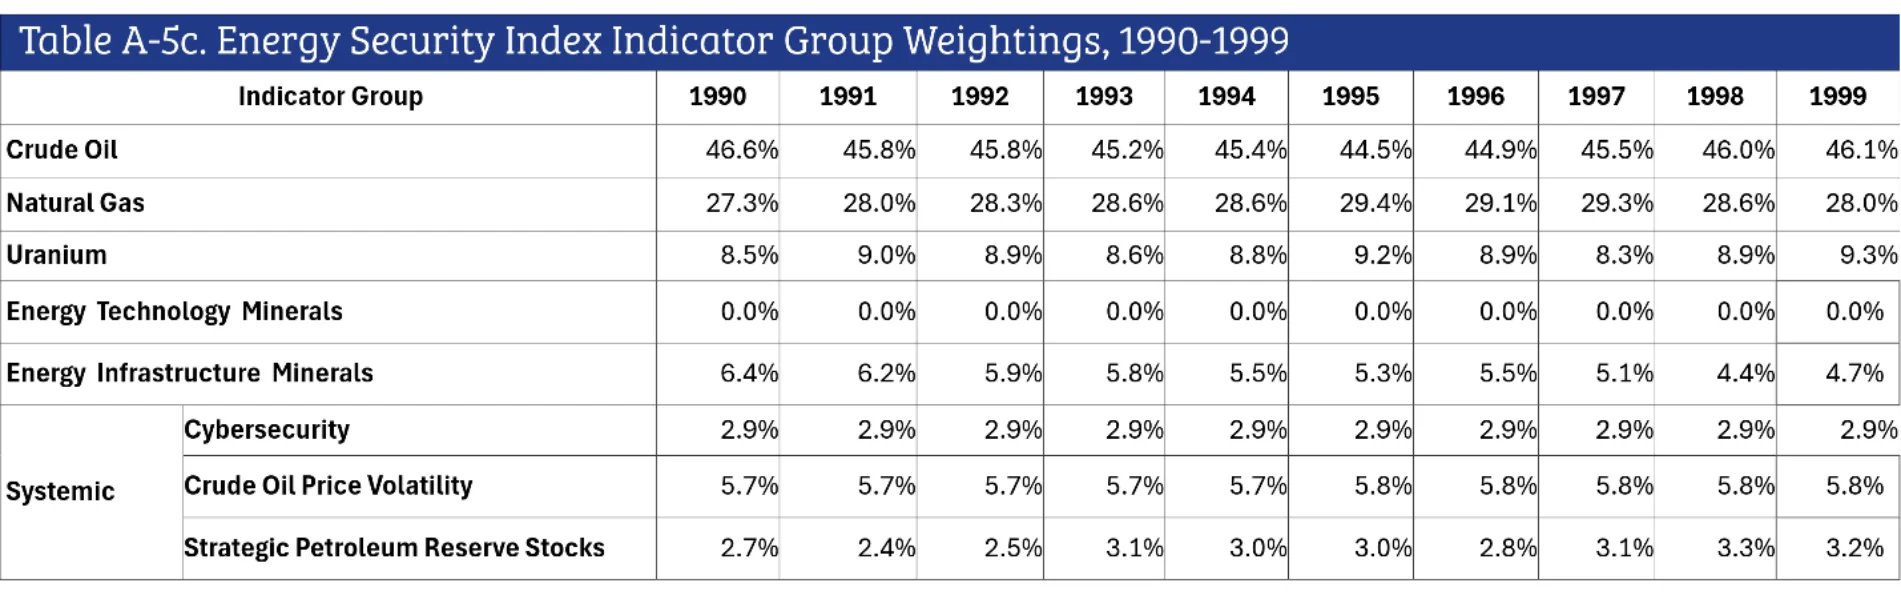
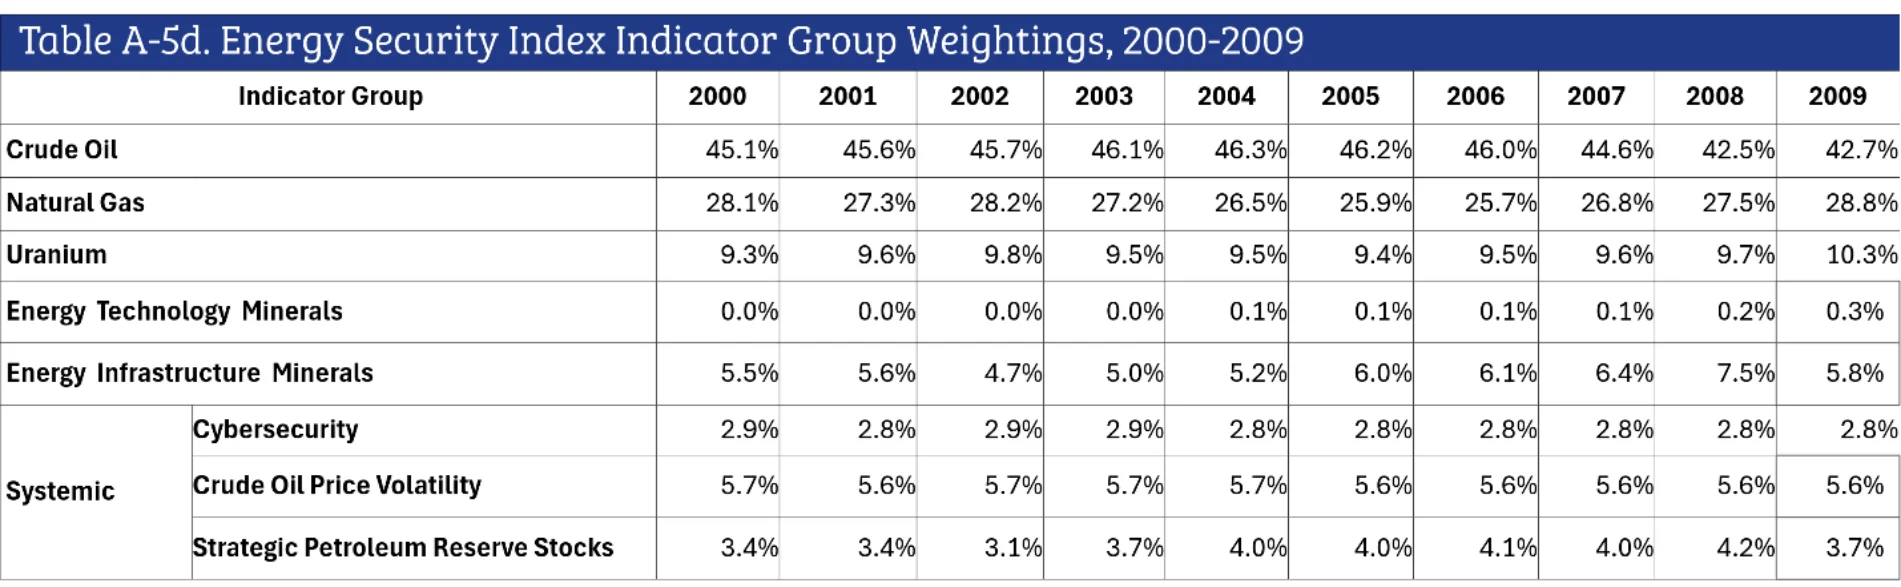
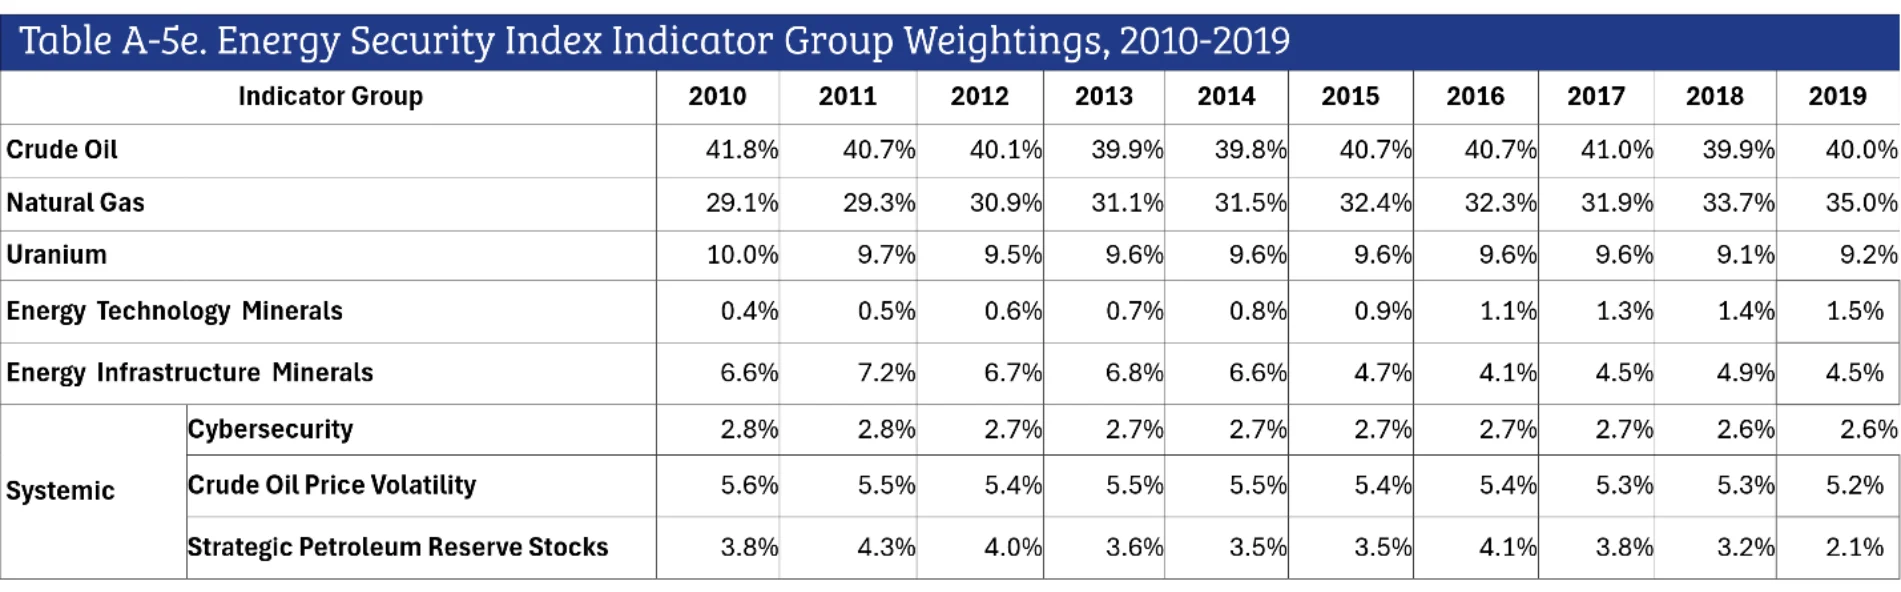
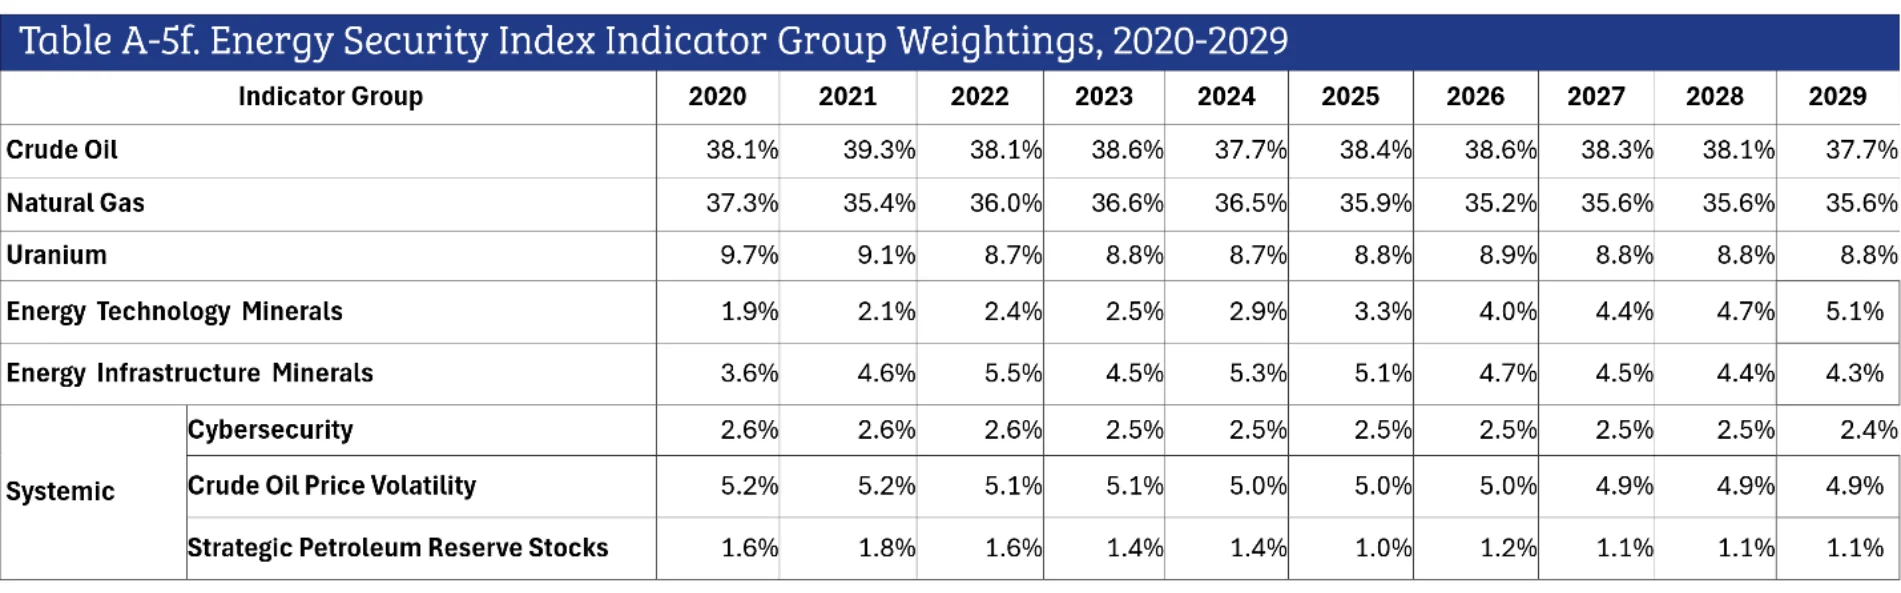
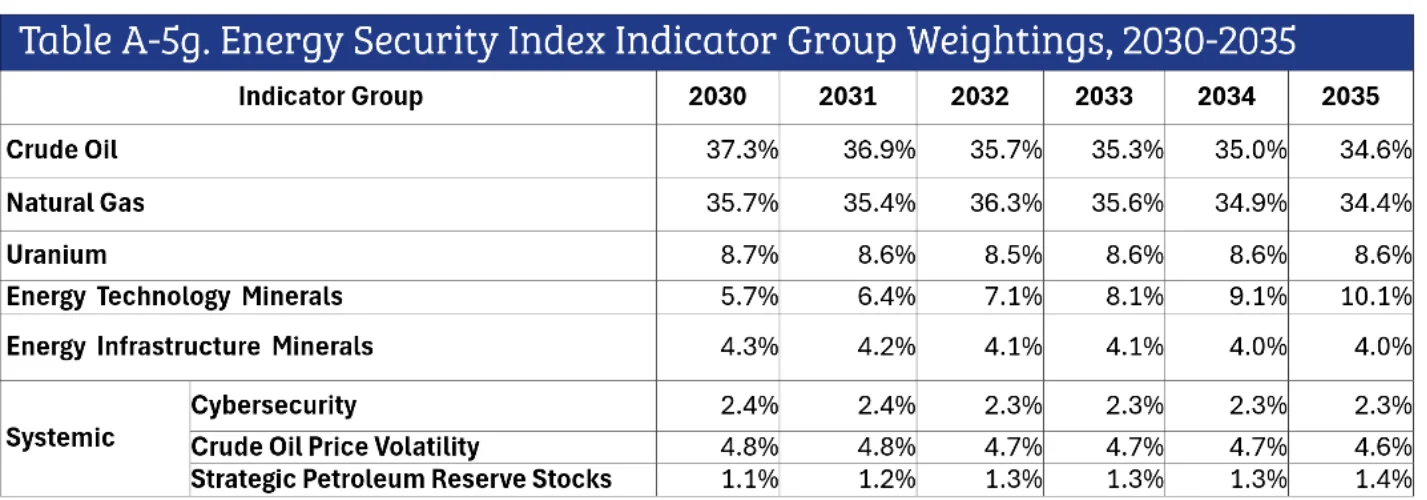
The final step in calculating ESI is to assign weights to the indicators. ESI employs a dynamic weighting scheme, as each indicator’s contribution to the final index varies annually. These weighted values reflect indicators’ importance to the U.S. energy system; the weights change over time. We assign weights to the various indicators based on their share of U.S. primary energy consumption, their contribution to the economy, or their estimated contribution to total risk. Table A-2 shows the weighting formulas used in ESI.
| Indicator Group | Indicators | Share of Weighting | Weighting |
|---|---|---|---|
| Crude Oil | World Crude Oil and Natural Gas Plant Liquids Production | 20% | Petroleum consumption as share of total U.S. energy consumption |
| Net Crude Oil Imports | 80% | ||
| Natural Gas | World Natural Gas Production | 10% | Natural gas consumption as share of total U.S. energy consumption |
| Net Natural Gas Imports | 90% | ||
| Uranium | Net Uranium Imports | 50% | Nuclear energy consumption as share of total U.S. energy consumption |
| Uranium Enrichment Services | 50% | ||
| Energy Technology Minerals | Net Cobalt Imports | 20% | Total of electricity generation from wind and solar and electricity going to battery storage and electric vehicles as share of total U.S. energy consumption |
| Net Graphite Imports | 20% | ||
| Net Lithium Imports | 20% | ||
| Net Manganese Imports | 20% | ||
| Net Rare Earths Imports | 20% | ||
| Energy Infrastructure Minerals | Net Aluminum Imports | 25% | Energy industries* as share of U.S. GDP |
| Net Copper Imports | 25% | ||
| Net Nickel Imports | 25% | ||
| Net Steel Imports | 25% | ||
| Systemic | Cybersecurity | 100% | 2.5% multiplied by the number of cyber incidents divided by the number of cyber incidents in 2012 |
| Combined Crude Oil Price Volatility | 100% | 5% | |
| Strategic Petroleum Reserve Stocks | 100% | 5% of Net Crude Oil Imports indicator |
Note: ESI weightings were proportionally adjusted to add to 100%.
*This includes oil and gas extraction; utilities; electrical equipment, appliances, and components; and petroleum and coal products.
Indicator Summaries
World Crude Oil and Natural Gas Plant Liquids Production
Indicator Group: Crude Oil
Why It Is Important: This indicates the level of risk tied to each barrel of crude oil and natural gas plant liquids (NGPL) produced globally.
What It Measures: This measures the reliability and diversity of global crude oil and NGPL supplies.
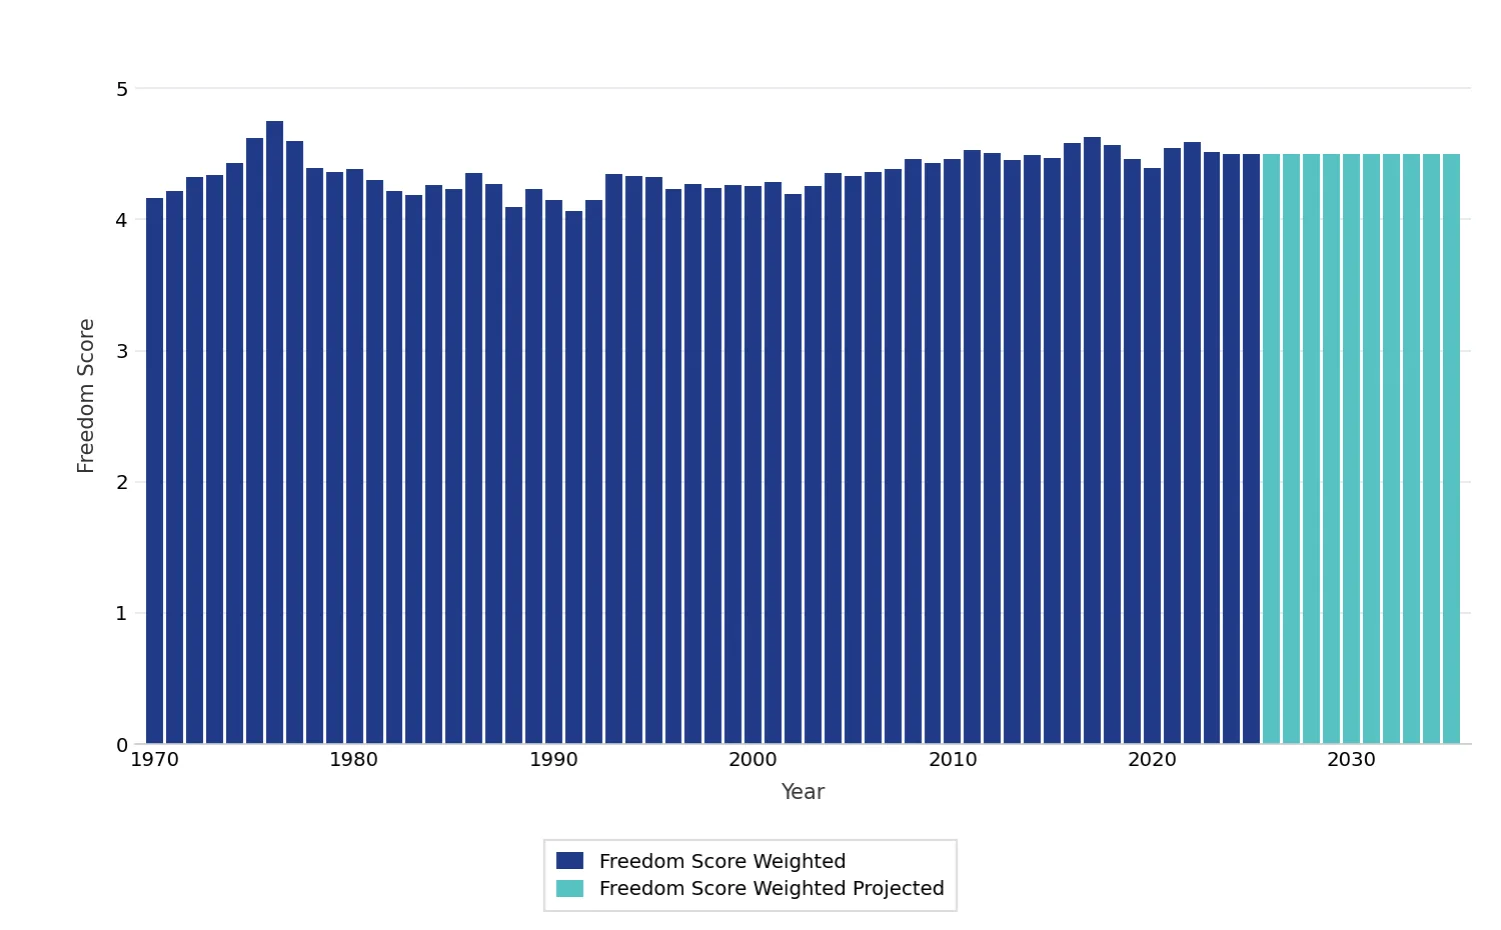
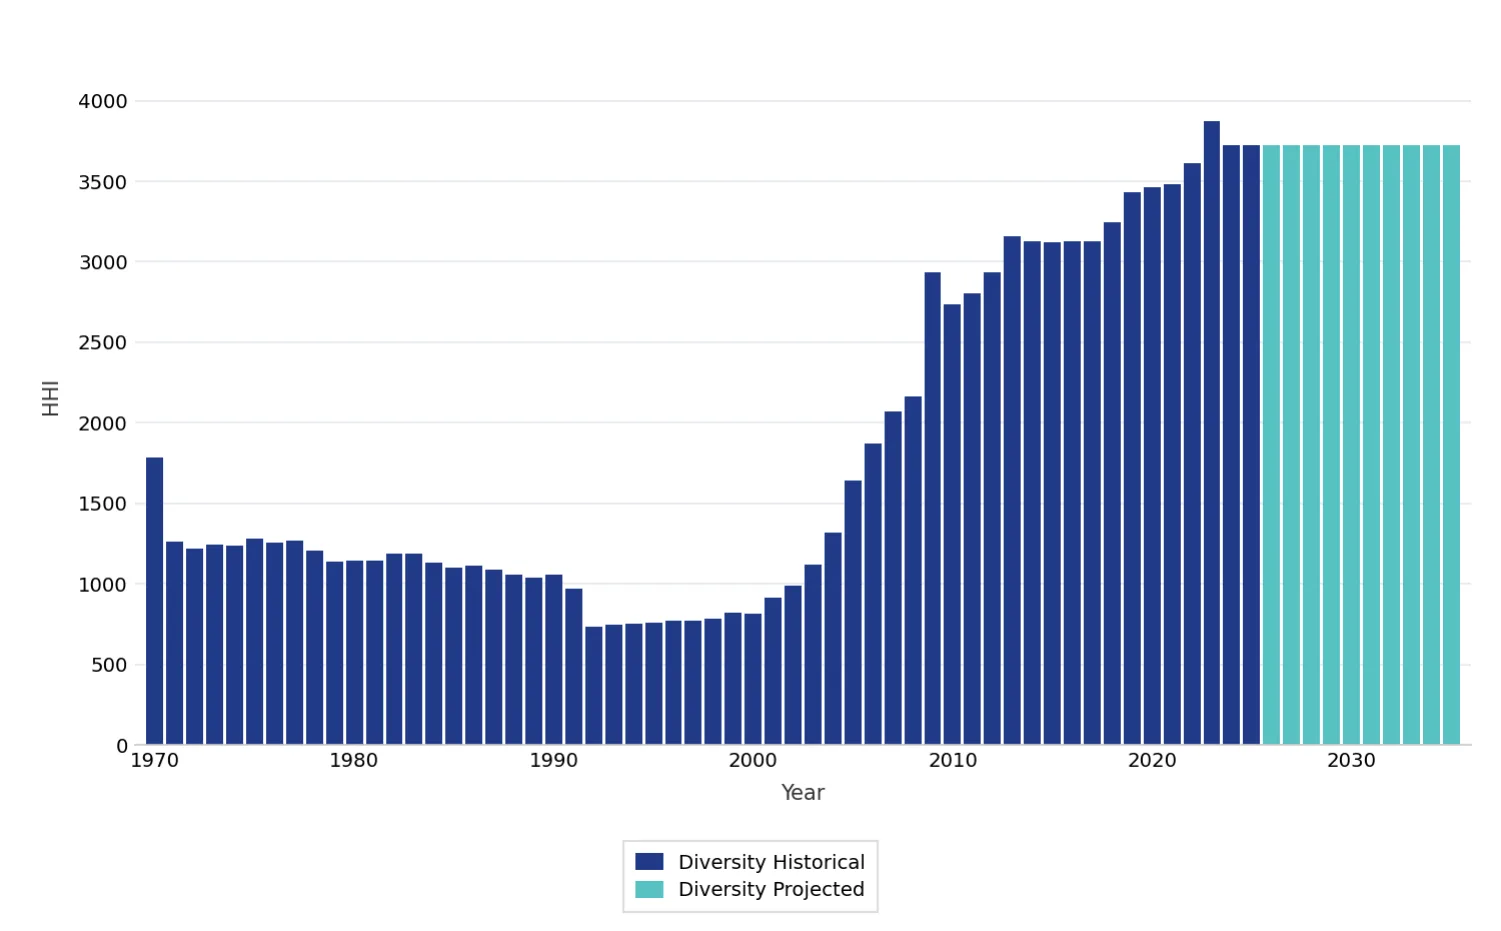
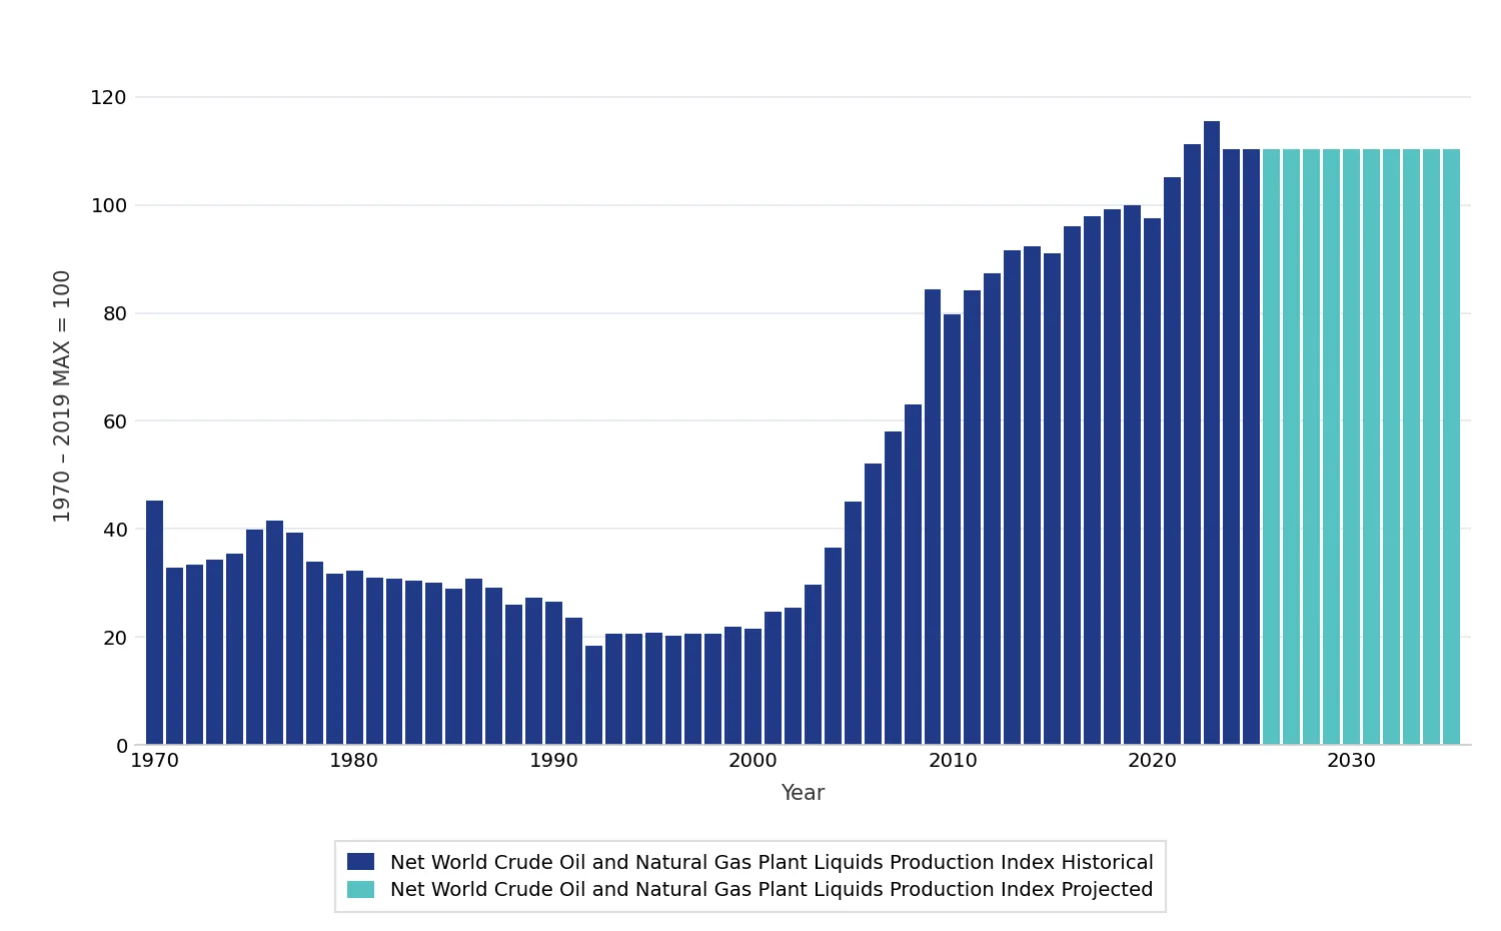
How It Is Calculated: This annual indicator is the product of: (1) the country-weighted average freedom score of each barrel produced (a proxy for geopolitical reliability); and (2) the concentration of production measured by the Herfindahl-Hirschman Index (a measure of market diversity), with Persian Gulf producer countries considered as a single producer, in order to capture the concentration of supplies passing through the Strait of Hormuz. The values for both were normalized (with Freedom House scores squared beforehand) so that the maximum (i.e., worst) historical value from 1970 to 2019 = 100. The product of these normalized values was calculated and normalized using the same procedure.
Data Sources: Freedom House’s Freedom in the World series; EIA
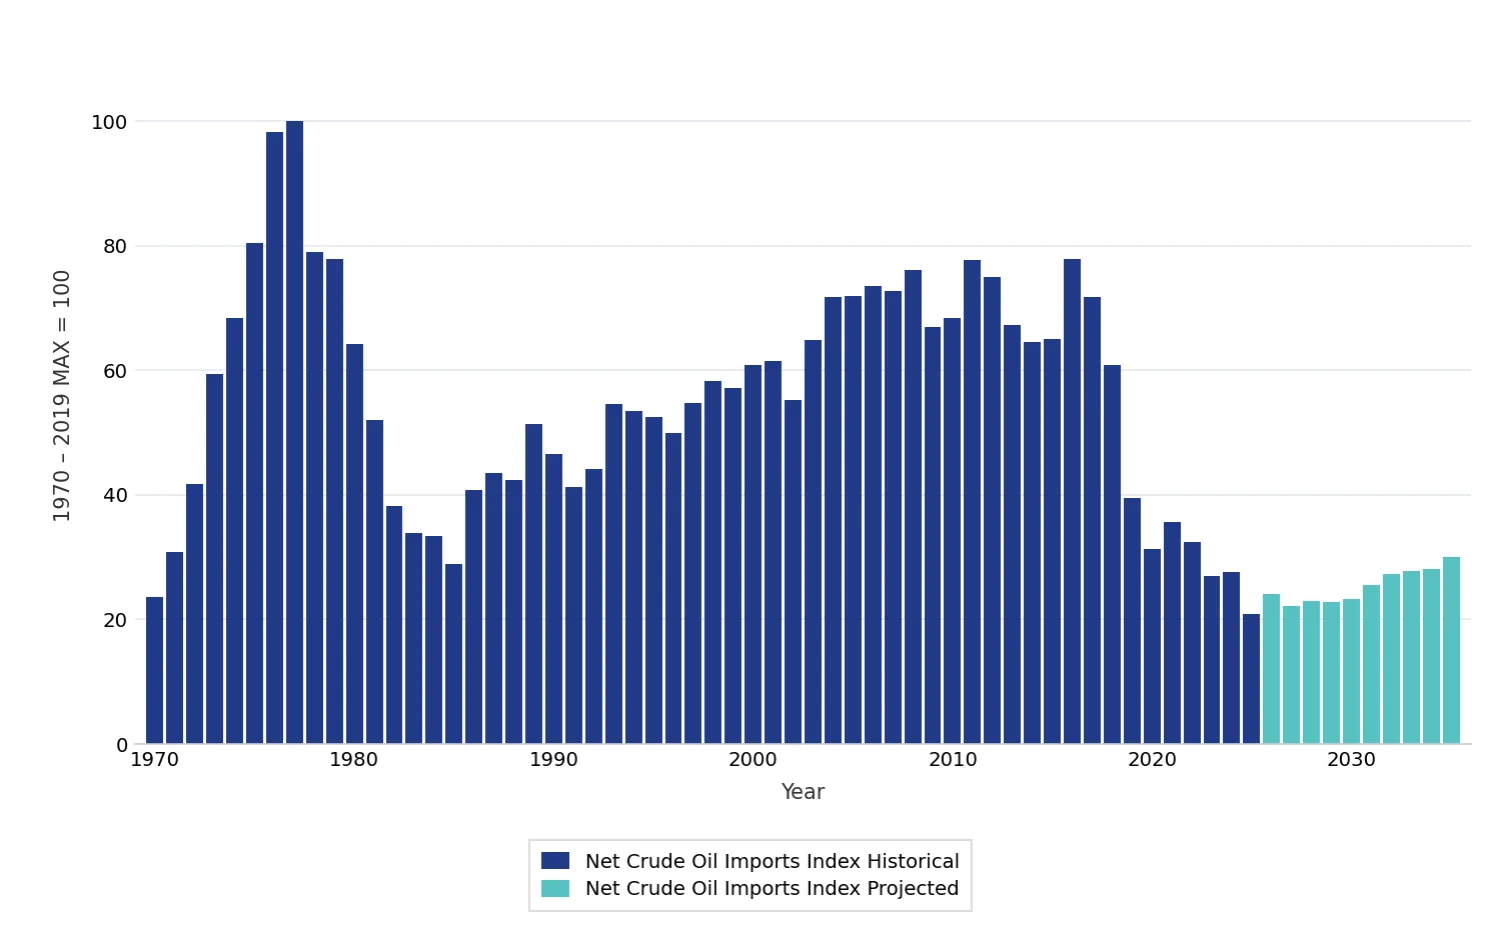
Net Crude Oil Imports
Indicator Group: Crude Oil
Why It Is Important: This indicates the degree to which changes in import levels expose the United States to unreliable and concentrated supplies of crude oil.
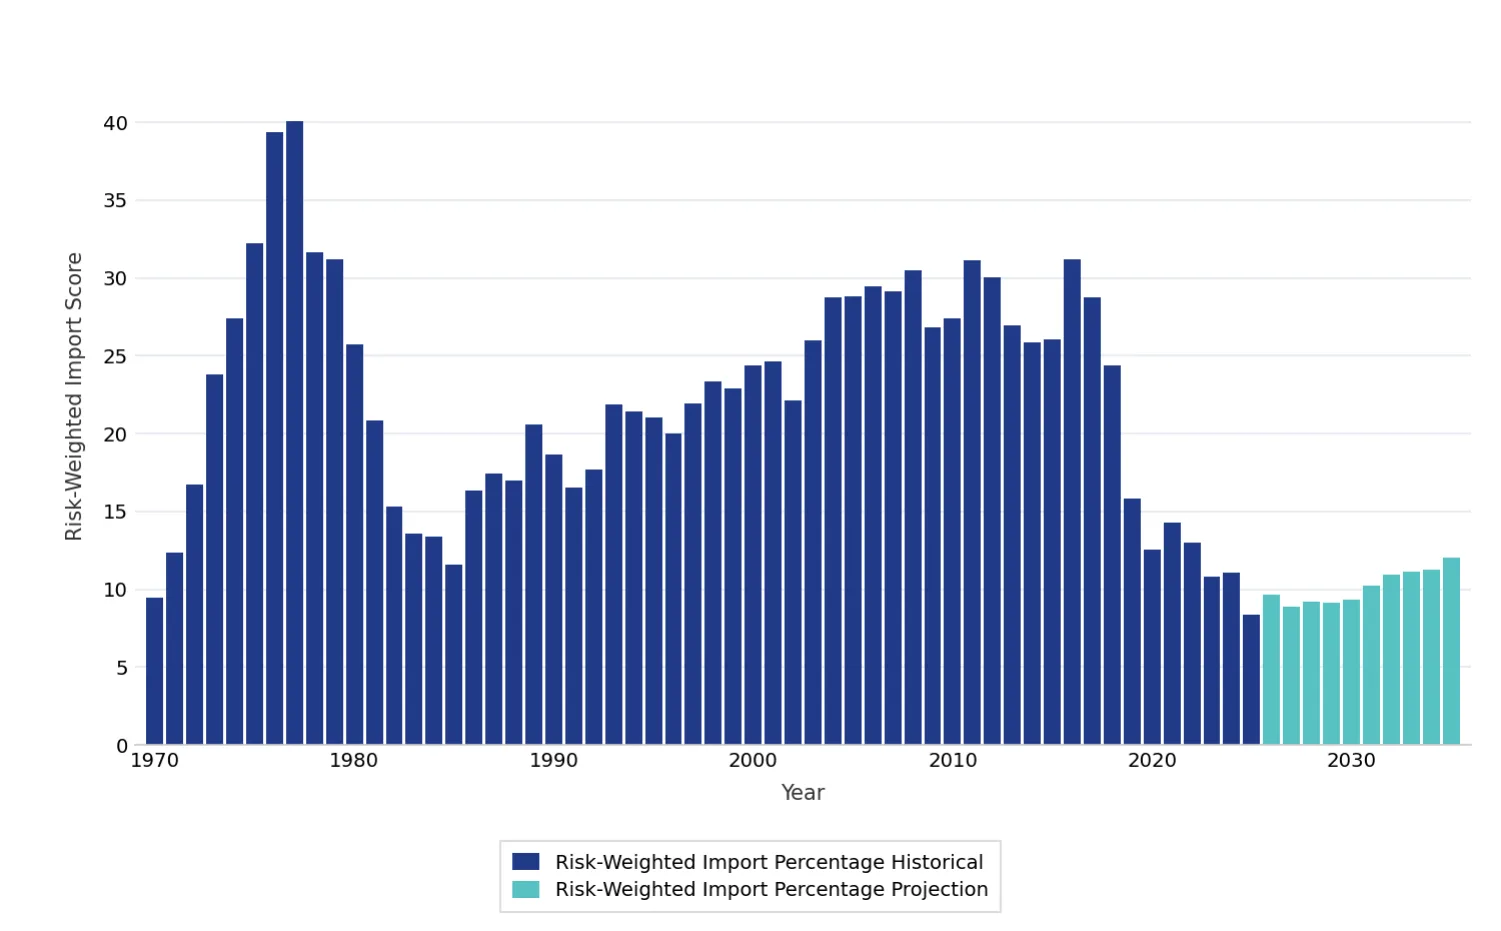
What It Measures: The volume of net crude oil imports is weighted by the reliability and diversity of global crude oil and NGPL supplies. This indicator combines: (1) the quantity of net crude oil imports as a share of refinery inputs, and (2) the level of risk tied to each barrel of crude oil and NGPL produced globally.
How It Is Calculated: This indicator is the product of: (1) net crude oil imports as a share of refinery inputs to distillation units weighted by petroleum consumption as share of total U.S. energy consumption; and (2) the reliability and diversity of global crude oil production, excluding the United States, Canada, and Mexico and combining the Persian Gulf producers. The values were normalized so that the maximum (i.e., worst) historical value from 1970 to 2019 = 100.
Data Sources: Freedom House’s Freedom in the World series; EIA’s Monthly Energy Review series and International Data
World Natural Gas Production
Indicator Group: Natural Gas
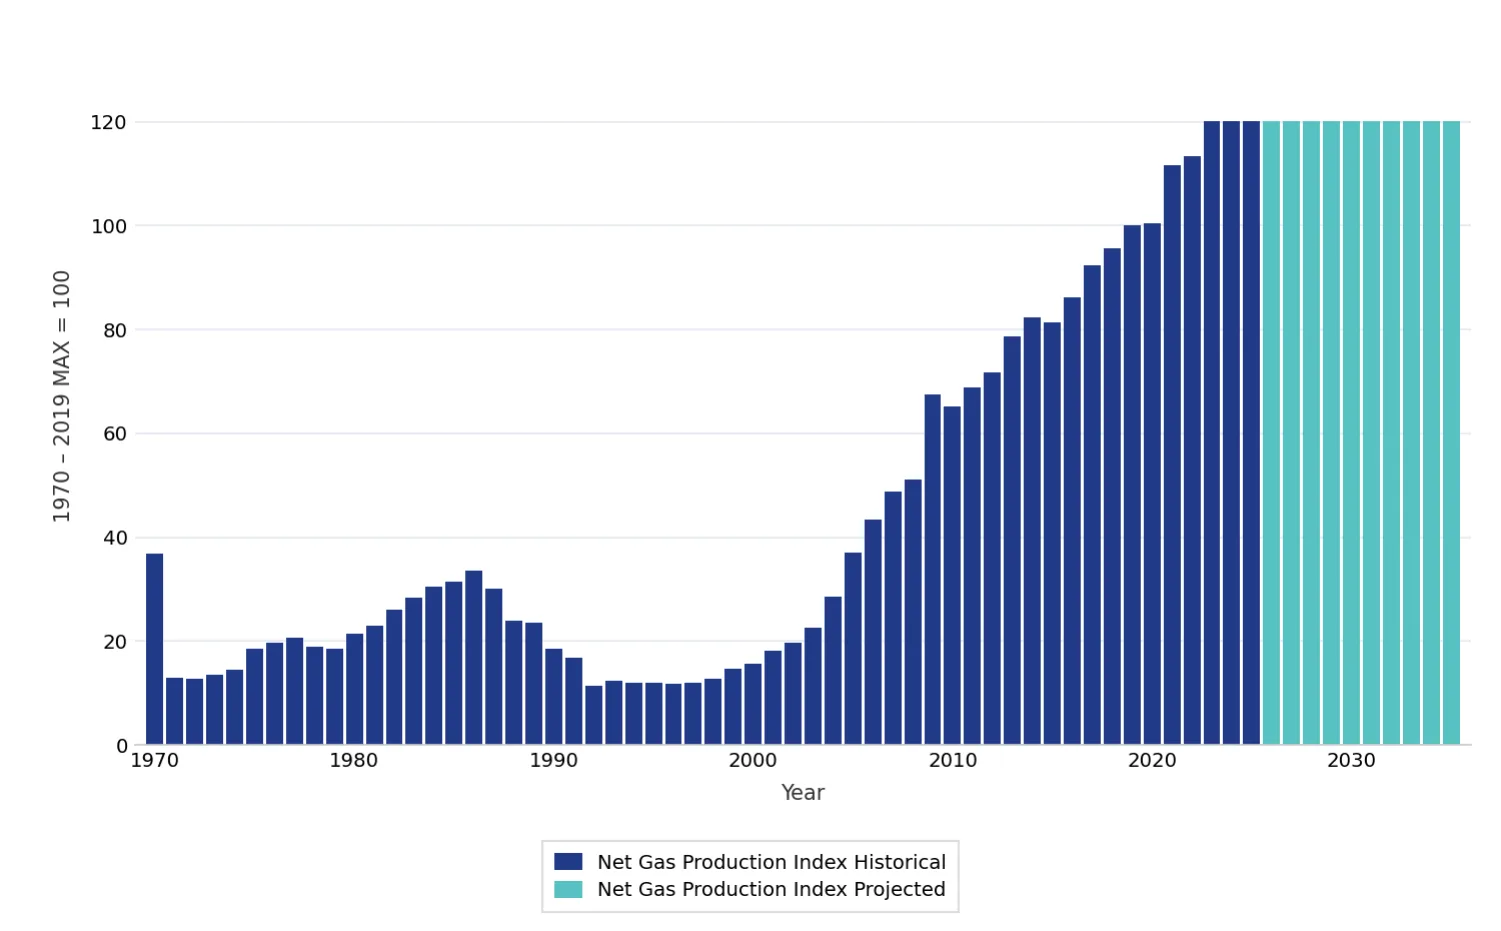
Why It Is Important: This indicates the level of risk tied to each cubic foot of natural gas produced globally.
What It Measures: This measures the reliability and diversity of global natural gas production.
How It Is Calculated: This annual indicator is the product of: (1) the country-weighted average freedom score of each barrel produced (a proxy for geopolitical reliability); and (2) the concentration of production measured by the Herfindahl-Hirschman Index (a measure of market diversity), with Persian Gulf producer countries considered a single producer, in order to capture the concentration of supplies passing through the Strait of Hormuz. The values for both were normalized (with Freedom House scores squared beforehand) so that the maximum (i.e., worst) historical value from 1970 to 2019 = 100.
Data Sources: Freedom House’s Freedom in the World series; EIA
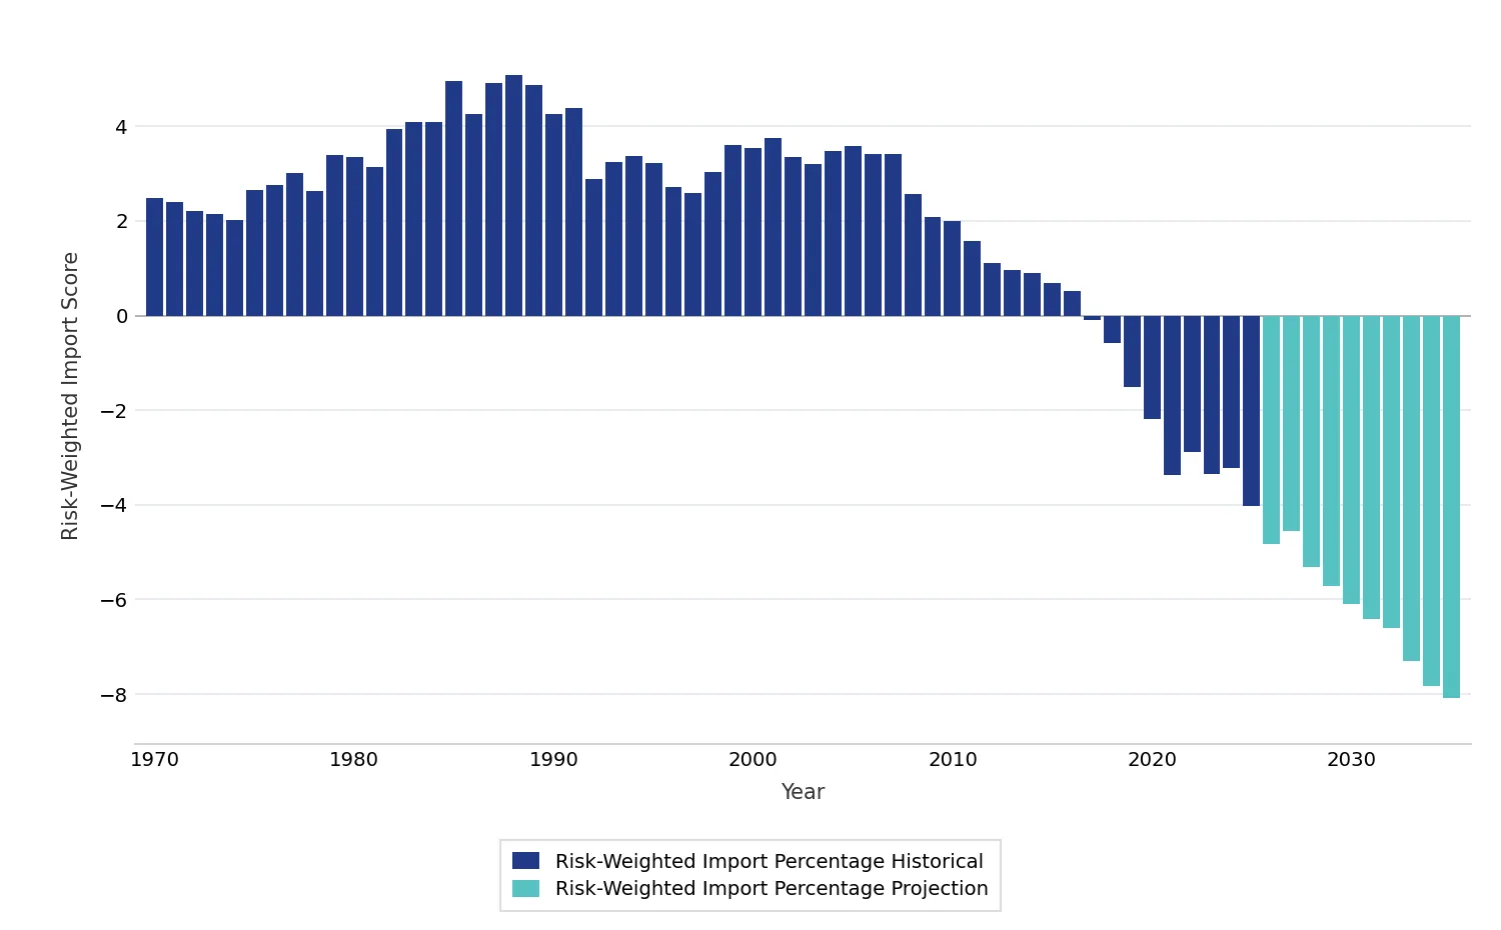
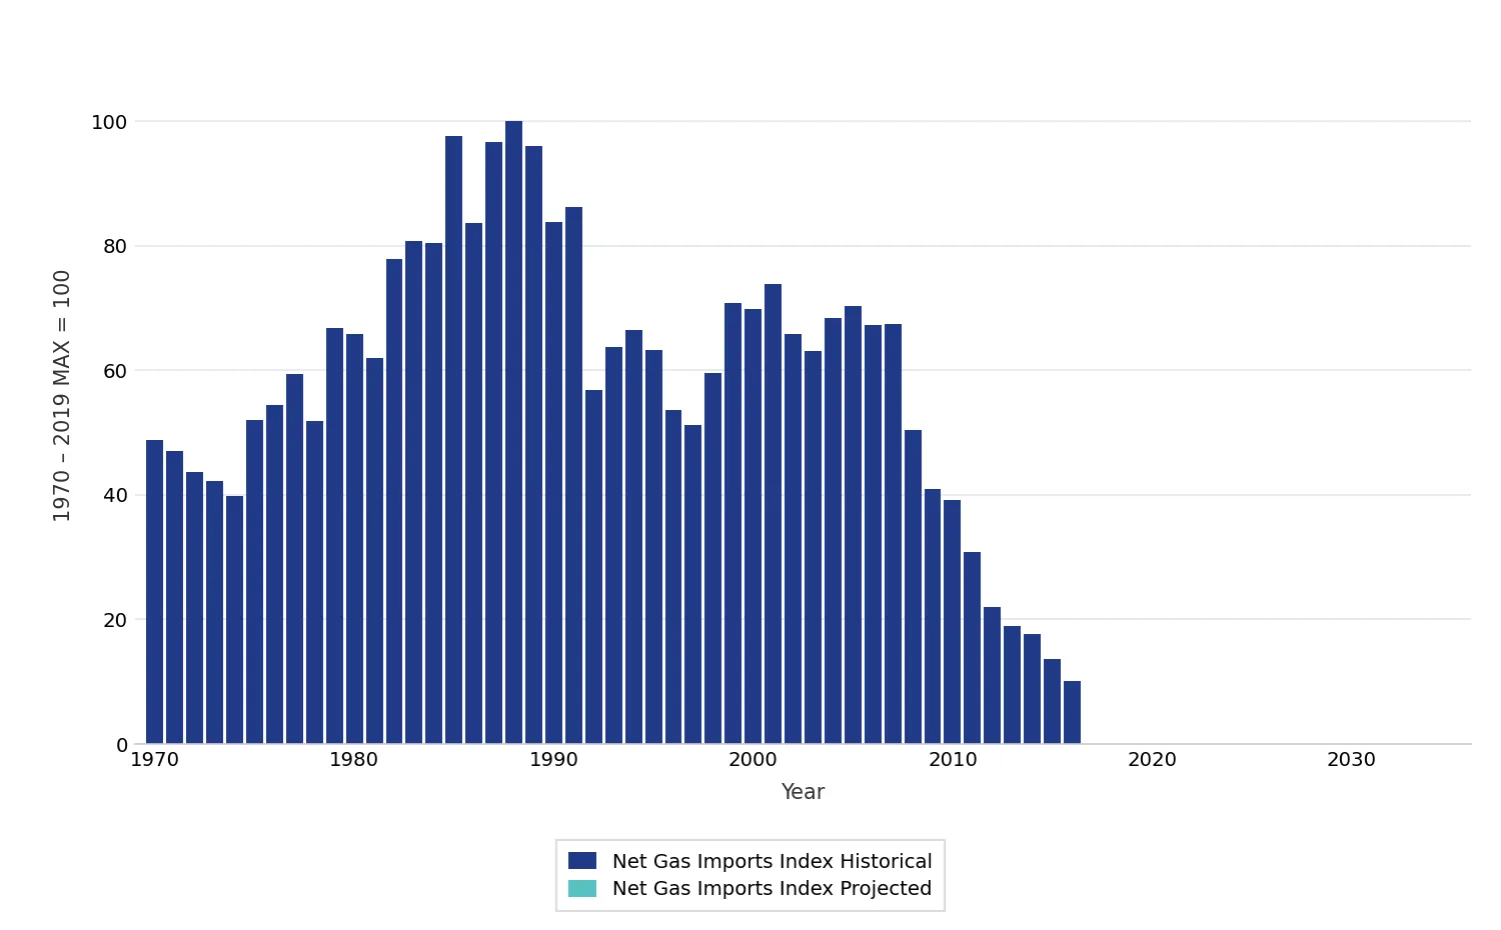
Net Natural Gas Imports
Indicator Group: Natural Gas
Why It Is Important: This indicates the degree to which changes in import levels expose the United States to unreliable and concentrated supplies of natural gas.
What It Measures: The volume of net natural gas imports is weighted by the reliability and diversity of global natural gas and NGPL supplies. This indicator combines: (1) the quantity of net natural gas imports as a share of natural gas demand, and (2) the level of risk tied to each cubic foot of natural gas produced globally.
How It Is Calculated: This indicator is the product of: (1) net natural gas imports as a share of demand weighted by natural gas consumption as a share of total U.S. energy consumption; and (2) the reliability and diversity of global natural gas production, excluding the United States, Canada, and Mexico and combining the Persian Gulf producers. The values were normalized so that the maximum (i.e., worst) historical value from 1970 to 2019 = 100.
Data Sources: Freedom House’s Freedom in the World series; EIA’s Monthly Energy Review series and International Data
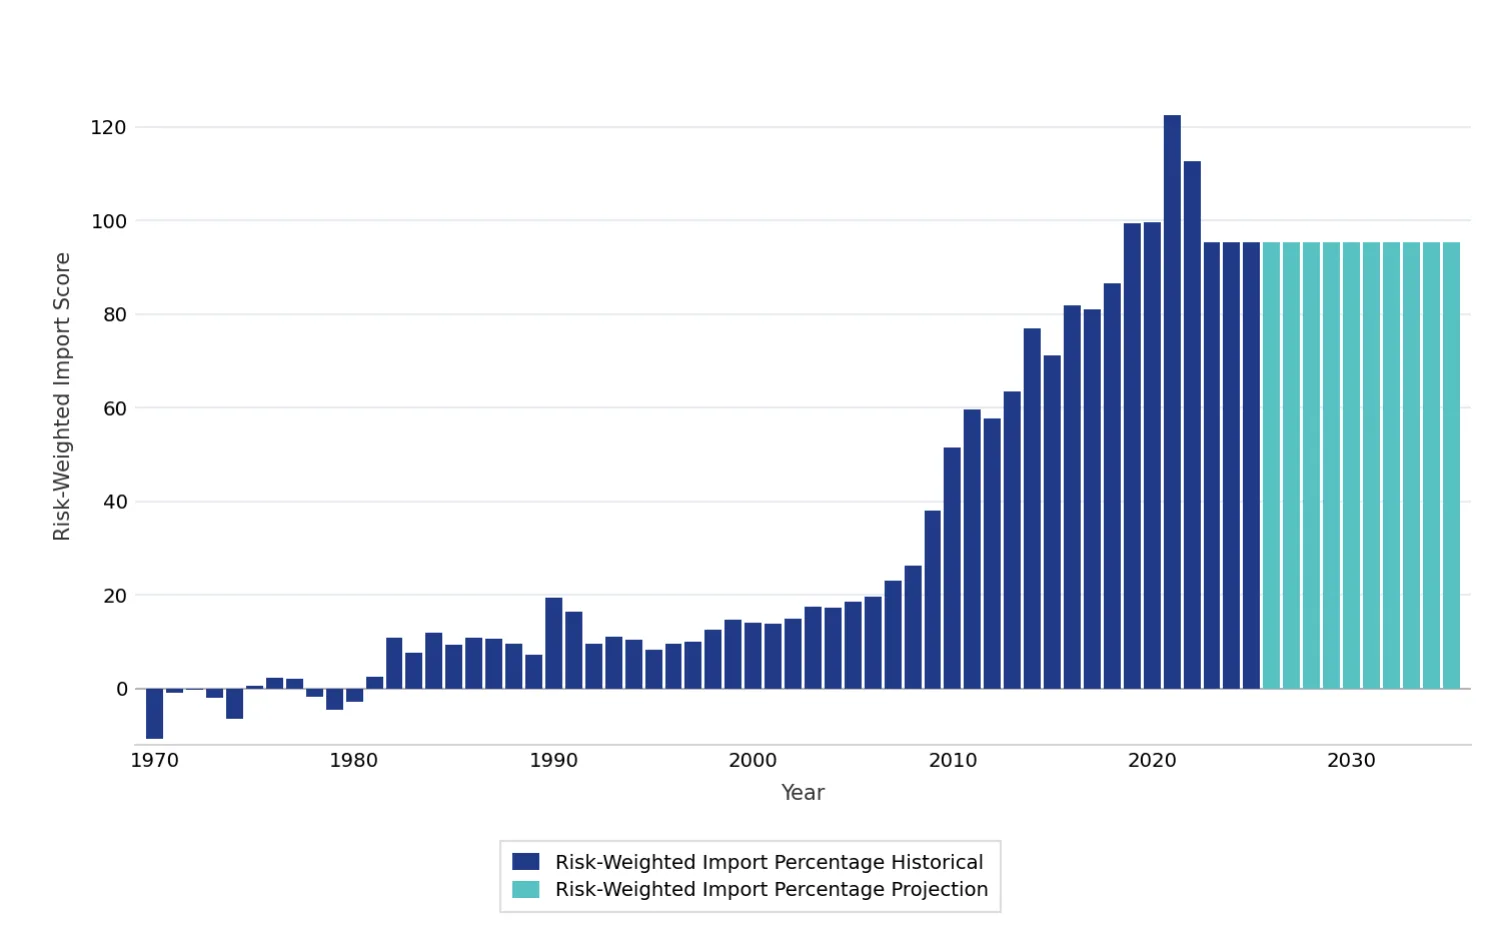
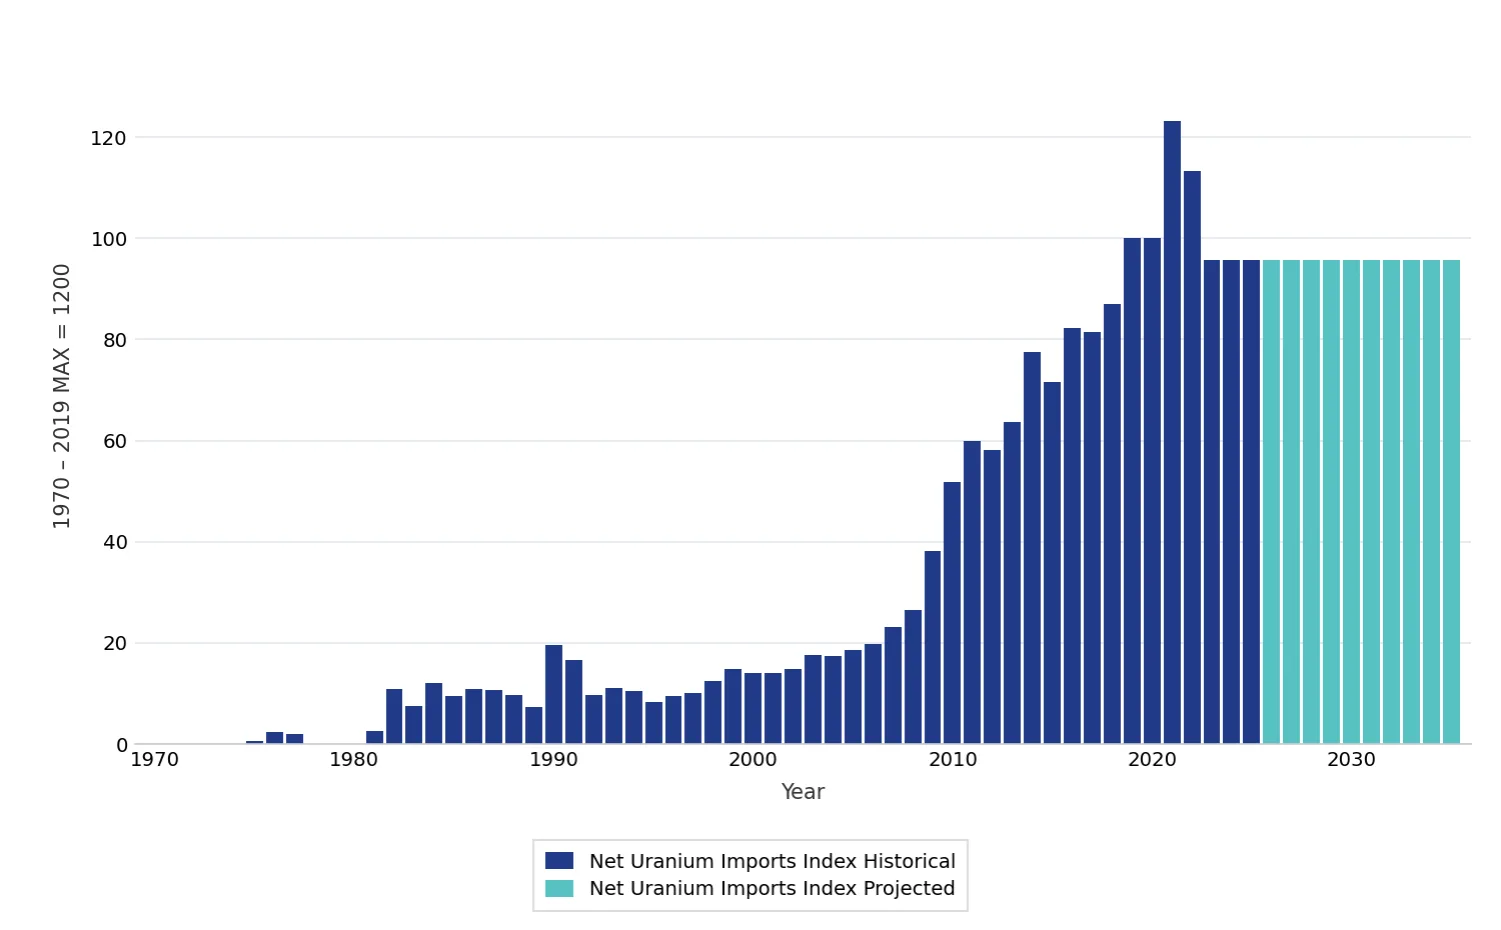
Net Uranium Imports
Indicator Group: Uranium
Why It Is Important: This indicates the degree to which changes in import levels expose the United States to unreliable and concentrated supplies of uranium.
What It Measures: The volume of net uranium imports is weighted by the reliability and diversity of global uranium supplies. This indicator combines: (1) the quantity of net uranium imports as a share of demand, and (2) the level of risk tied to each unit of uranium produced globally.
How It Is Calculated: This indicator is the product of: (1) net uranium imports as a share of nuclear plant demand weighted by nuclear energy consumption as a share of total U.S. energy consumption; and (2) the reliability and diversity of global uranium production, excluding the United States, Canada, and Mexico. The values were normalized so that the maximum (i.e., worst) historical value from 1970 to 2019 = 100.
Data Sources: Freedom House’s Freedom in the World series; British Geological Survey’s World Mineral Statistics series; EIA’s Uranium Marketing Annual Report series
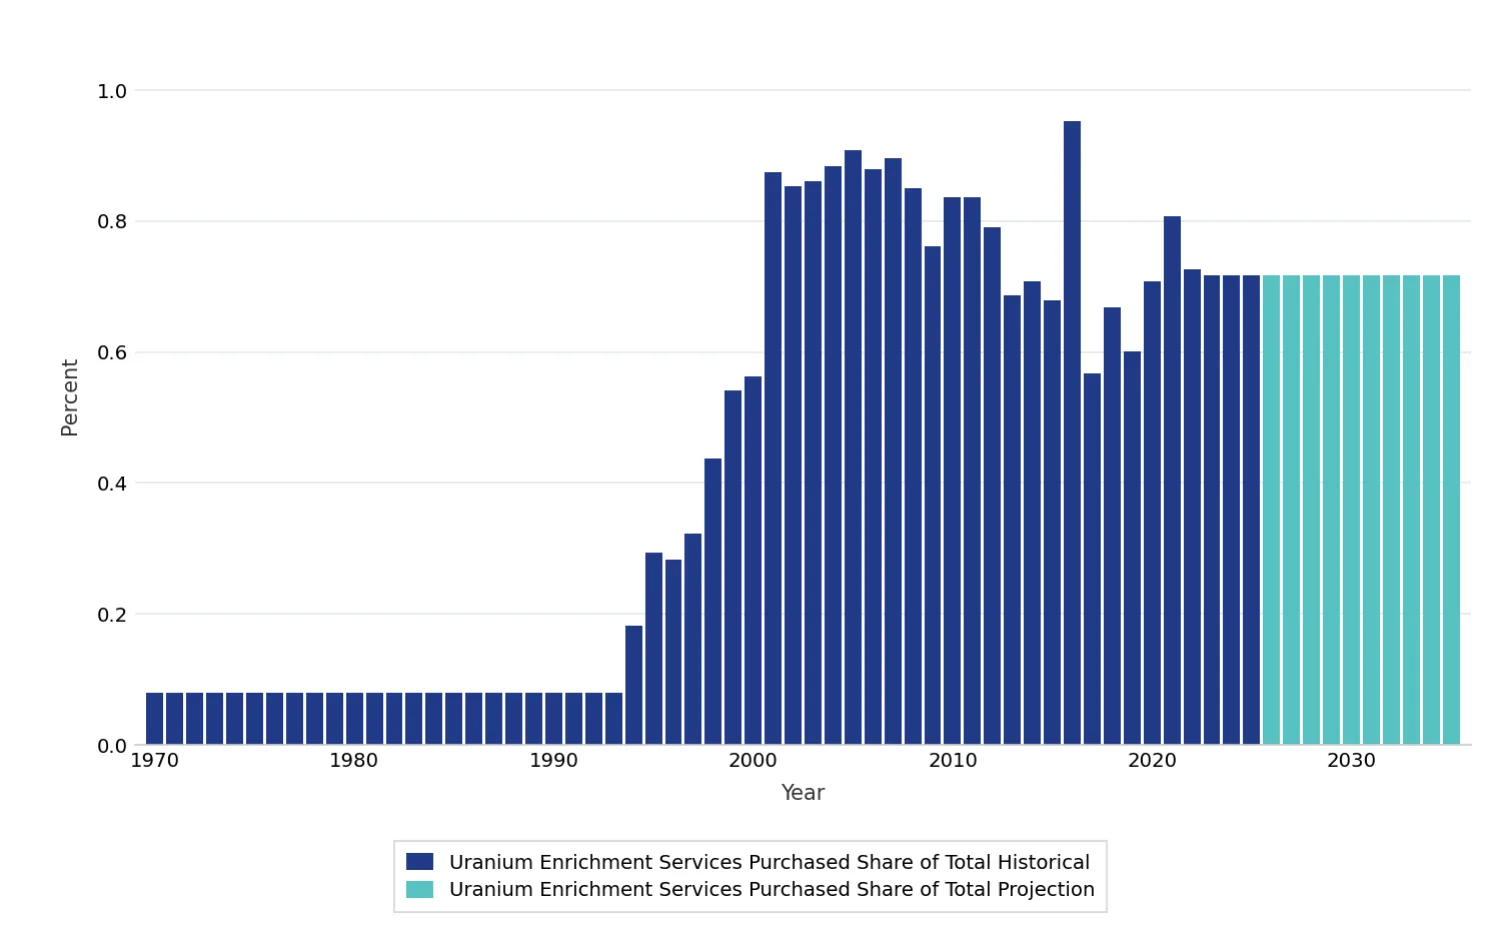
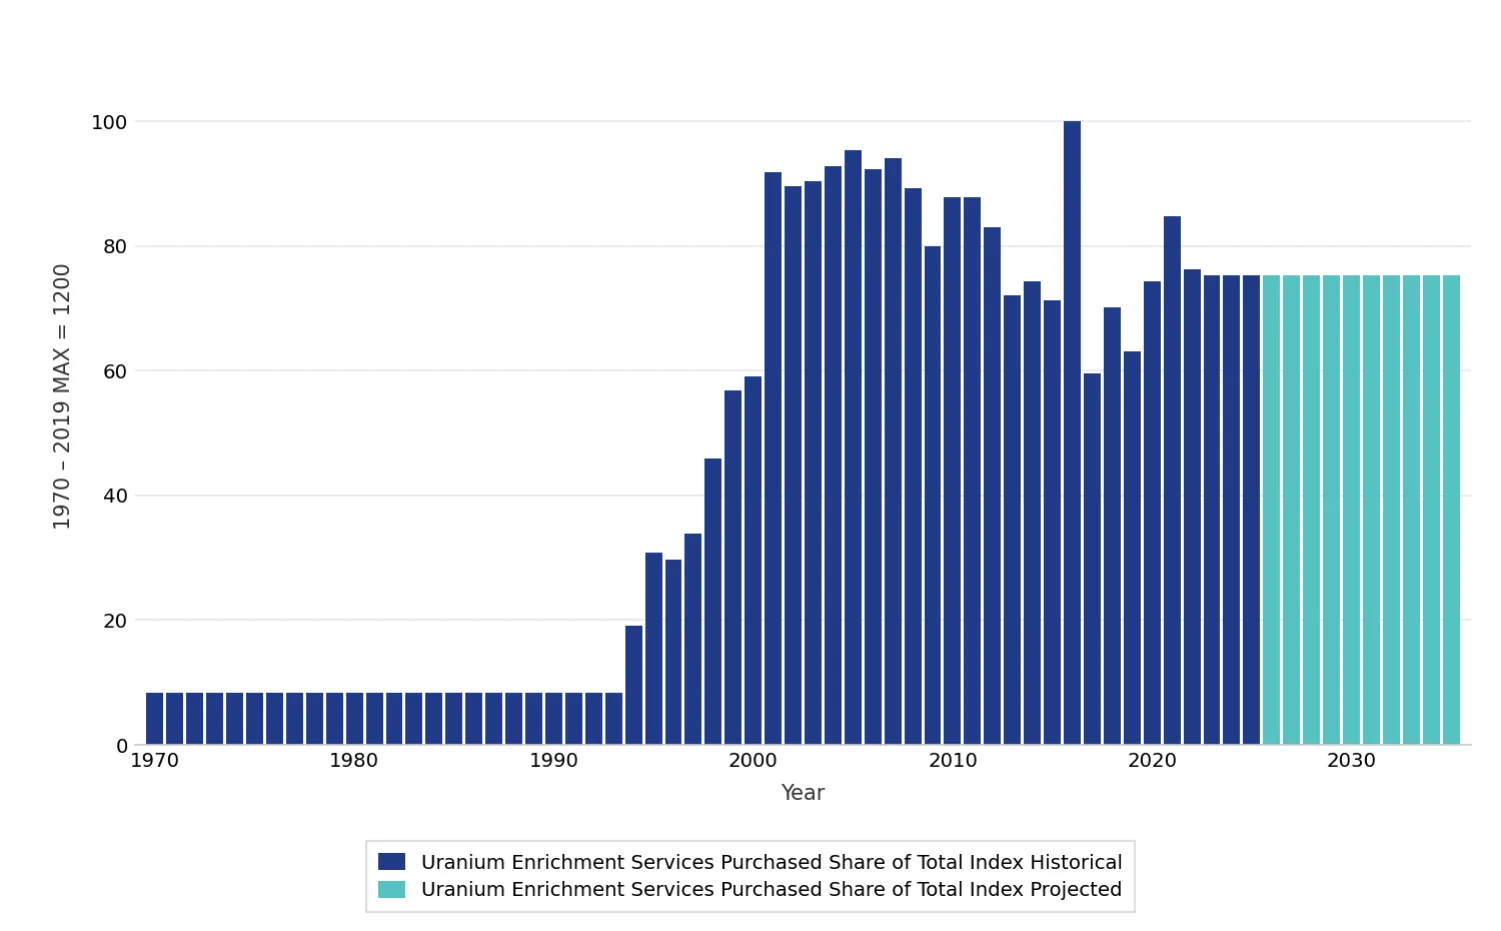
Uranium Enrichment Services
Indicator Group: Uranium
Why It Is Important: This indicates the degree to which foreign purchases of separative work units (SWUs) expose the U.S. nuclear industry to unreliable supplies or enriched nuclear fuel.
What It Measures: This measures the share of foreign enrichment services purchased by the total amount of enrichment services purchased.
How It Is Calculated: This indicator is the product of: (1) foreign SWUs purchased, divided by the total number of SWUs purchased; and (2) the total number of SWUs purchased. The values were normalized so that the maximum (i.e., worst) historical value from 1970 to 2019 = 100. These data begin in 1993.
Data Source: EIA’s Uranium Marketing Annual Report series
Net Cobalt Imports
Indicator Group: Energy Technology Minerals
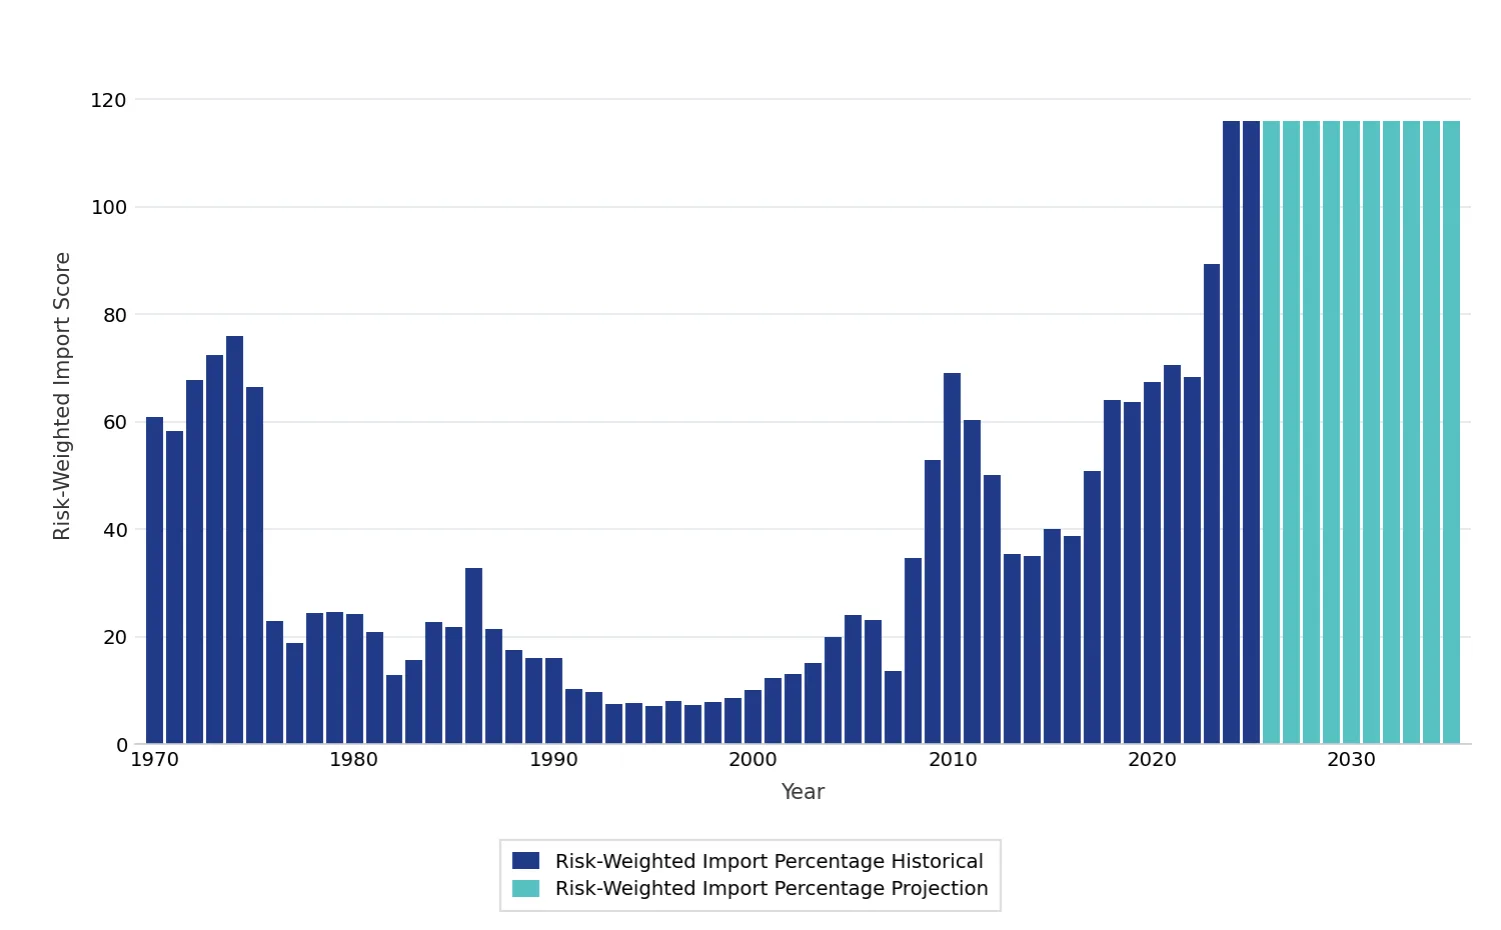
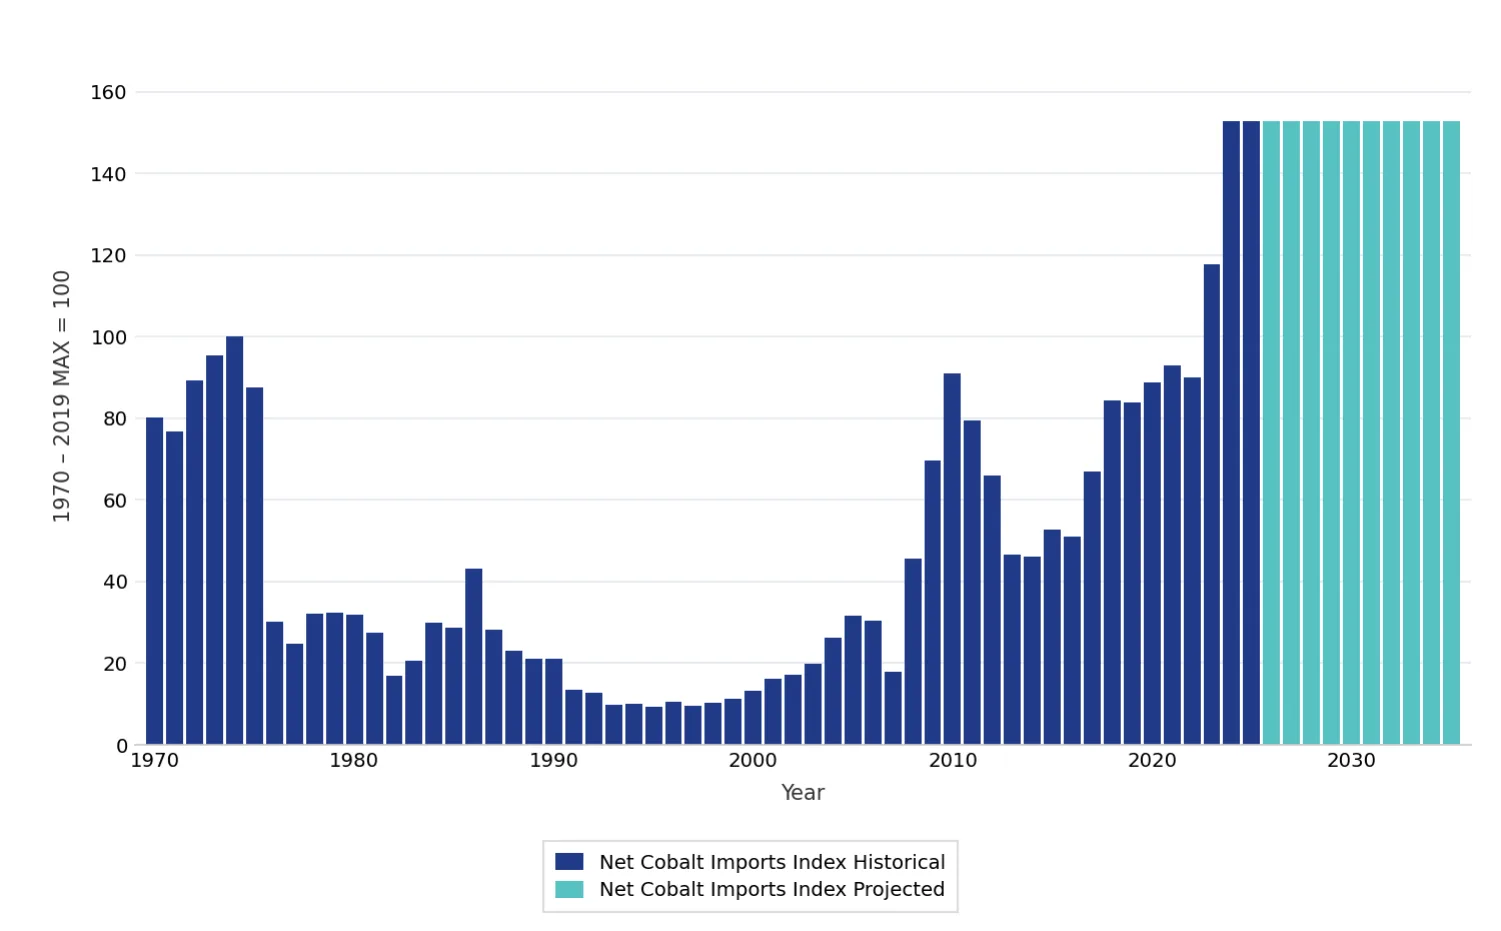
Why It Is Important: This indicates the degree to which changes in import levels expose the United States to unreliable and concentrated supplies of cobalt.
What It Measures: The volume of net cobalt imports is weighted by the reliability and diversity of global mined cobalt supplies. This indicator combines: (1) the quantity of net cobalt imports as a share of apparent consumption, and (2) the level of risk tied to each unit of cobalt produced globally.
How It Is Calculated: This indicator is the product of: (1) net cobalt imports as a share of apparent consumption, weighted by the share of total U.S. energy consumption accounted for by electricity generation from wind and solar plus electricity for battery storage and electric vehicles; and (2) the reliability and diversity of global mined cobalt production, excluding the United States, Canada, and Mexico. The values were normalized so that the maximum (i.e., worst) historical value from 1970 to 2019 = 100.
Data Sources: Freedom House’s Freedom in the World series; British Geological Survey’s World Mineral Statistics series; U.S. Geological Survey’s Mineral Commodity Summaries series
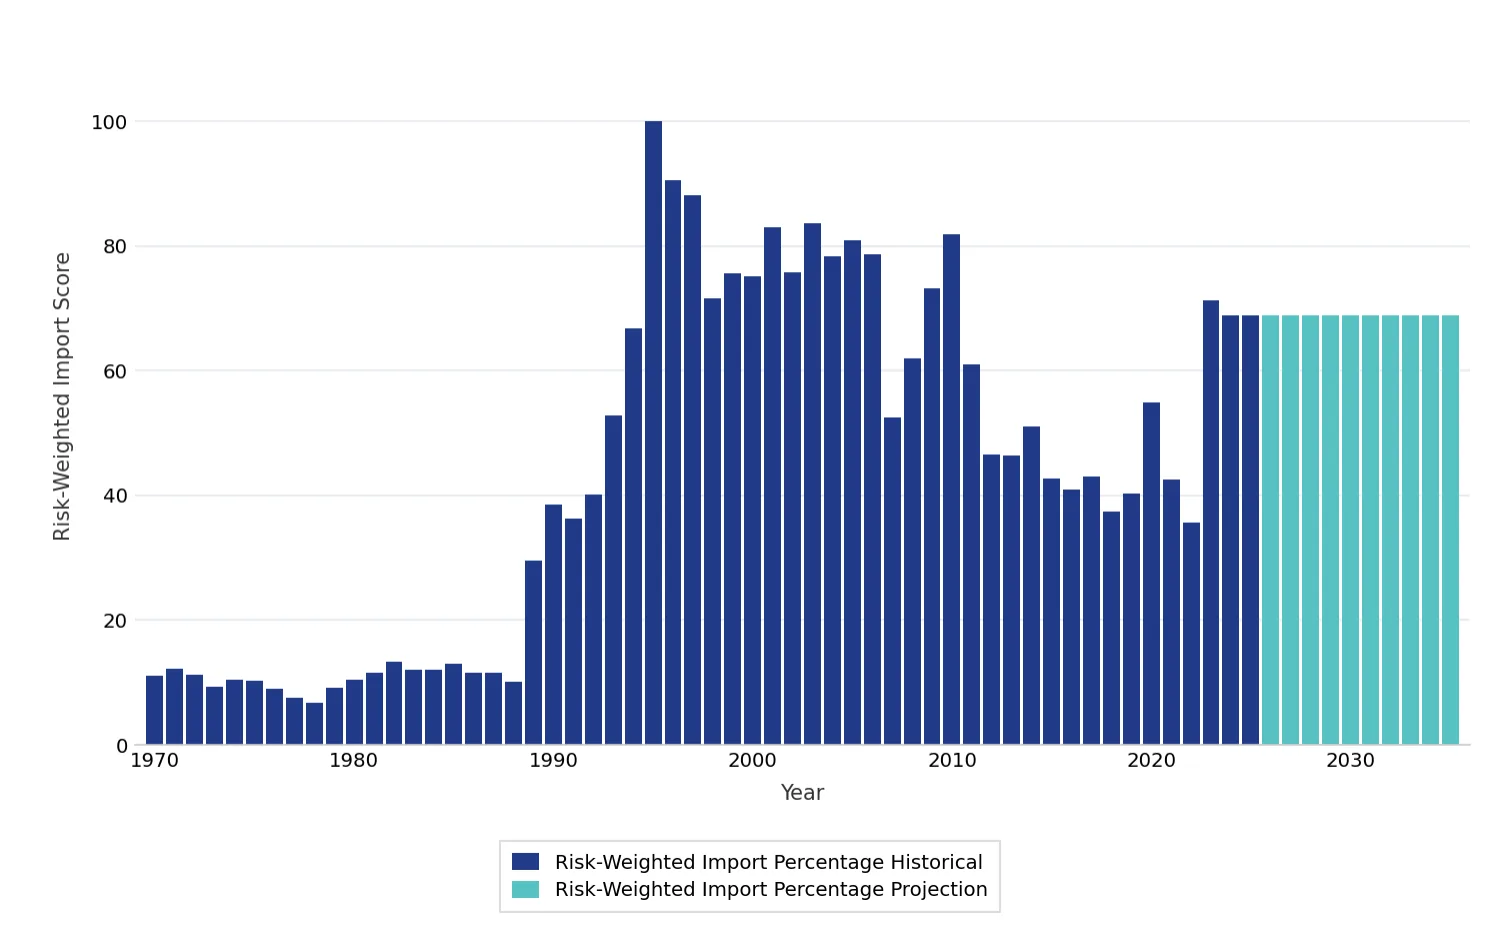
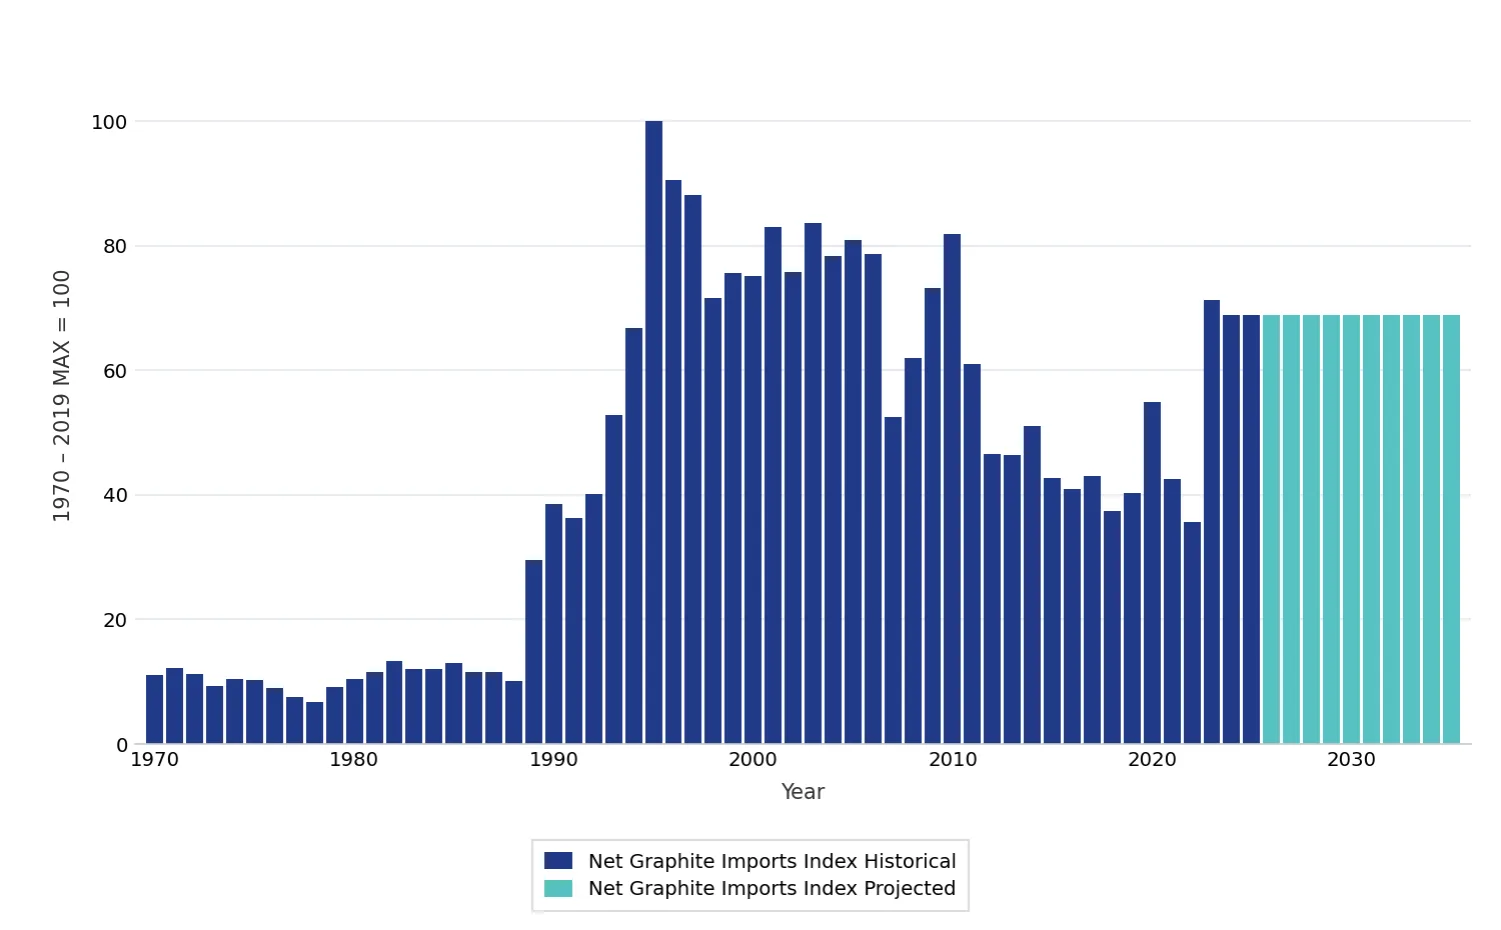
Net Graphite Imports
Indicator Group: Energy Technology Minerals
Why It Is Important: This indicates the degree to which changes in import levels expose the United States to unreliable and concentrated supplies of graphite.
What It Measures: The volume of net graphite imports is weighted by the reliability and diversity of global graphite supplies. This indicator combines: (1) the quantity of net graphite imports as a share of apparent consumption, and (2) the level of risk tied to each unit of graphite produced globally.
How It Is Calculated: This indicator is the product of: (1) net graphite imports as a share of apparent consumption weighted by the share of total U.S. energy consumption accounted for by electricity generation from wind and solar plus electricity for battery storage and electric vehicles; and (2) the reliability and diversity of global graphite production, excluding the United States, Canada, and Mexico. The values were normalized so that the maximum (i.e., worst) historical value from 1970 to 2019 = 100.
Data Sources: Freedom House’s Freedom in the World series; British Geological Survey’s World Mineral Statistics series; U.S. Geological Survey’s Mineral Commodity Summaries series
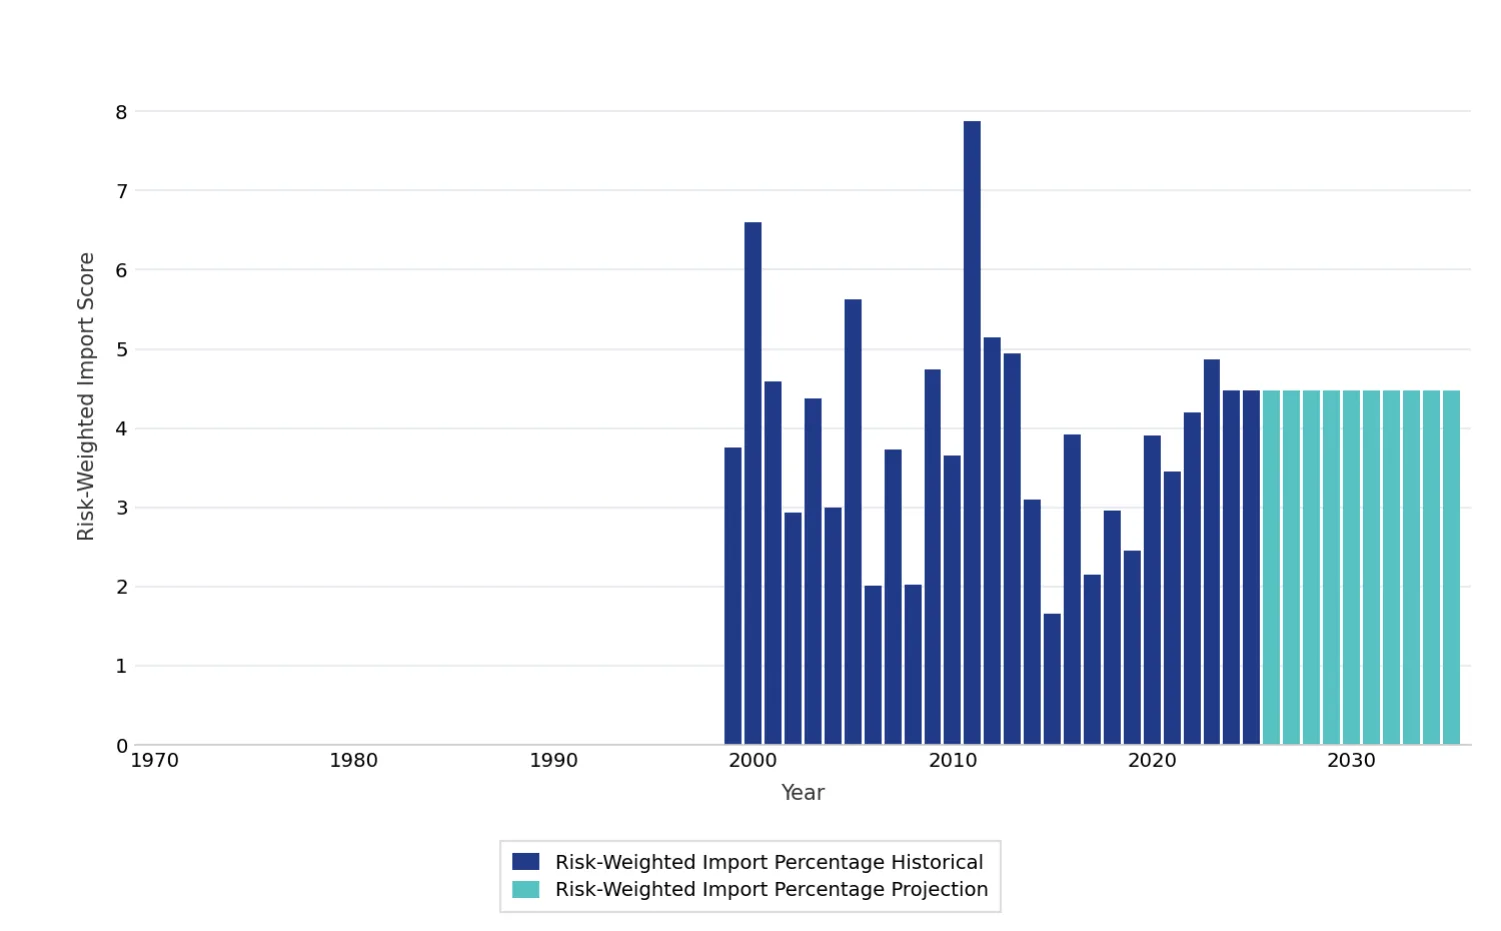
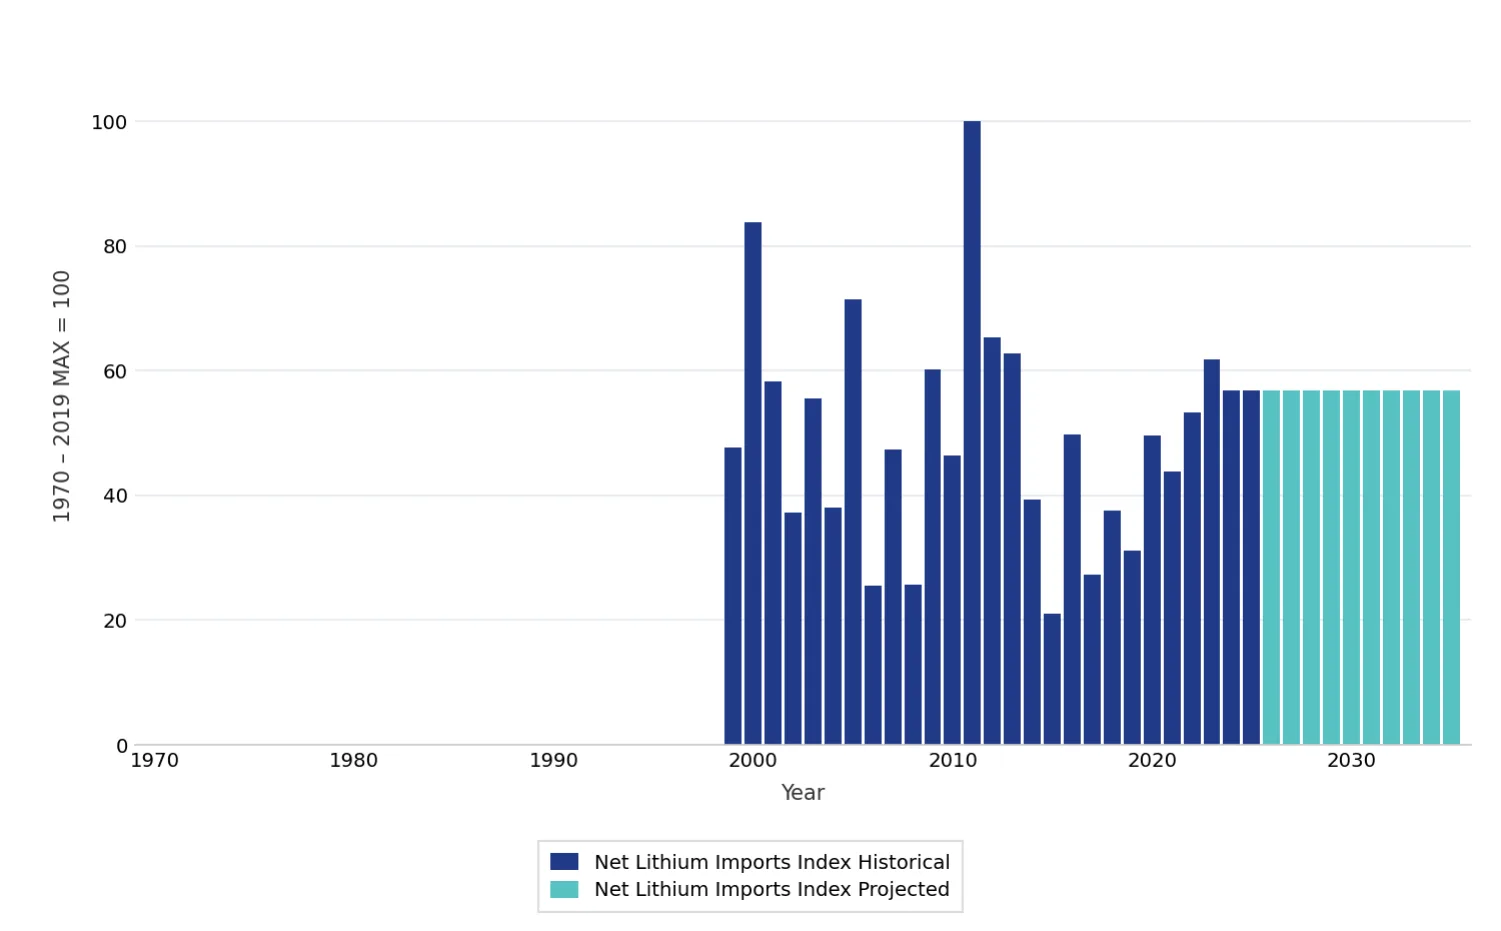
Net Lithium Imports
Indicator Group: Energy Technology Minerals
Why It Is Important: This indicates the degree to which changes in import levels expose the United States to unreliable and concentrated supplies of lithium.
What It Measures: The volume of net lithium imports is weighted by the reliability and diversity of global lithium mineral supplies. This indicator combines: (1) the quantity of net lithium imports as a share of apparent consumption, and (2) the level of risk tied to each unit of lithium produced globally.
How It Is Calculated: This indicator is the product of: (1) net lithium imports as a share of apparent consumption weighted by the share of total U.S. energy consumption accounted for by electricity generation from wind and solar plus electricity for battery storage and electric vehicles; and (2) the reliability and diversity of global lithium production, excluding the United States, Canada, and Mexico. The values were normalized so that the maximum (i.e., worst) historical value from 1970 to 2019 = 100.
Data Sources: Freedom House’s Freedom in the World series; British Geological Survey’s World Mineral Statistics series; U.S. Geological Survey’s Mineral Commodity Summaries series
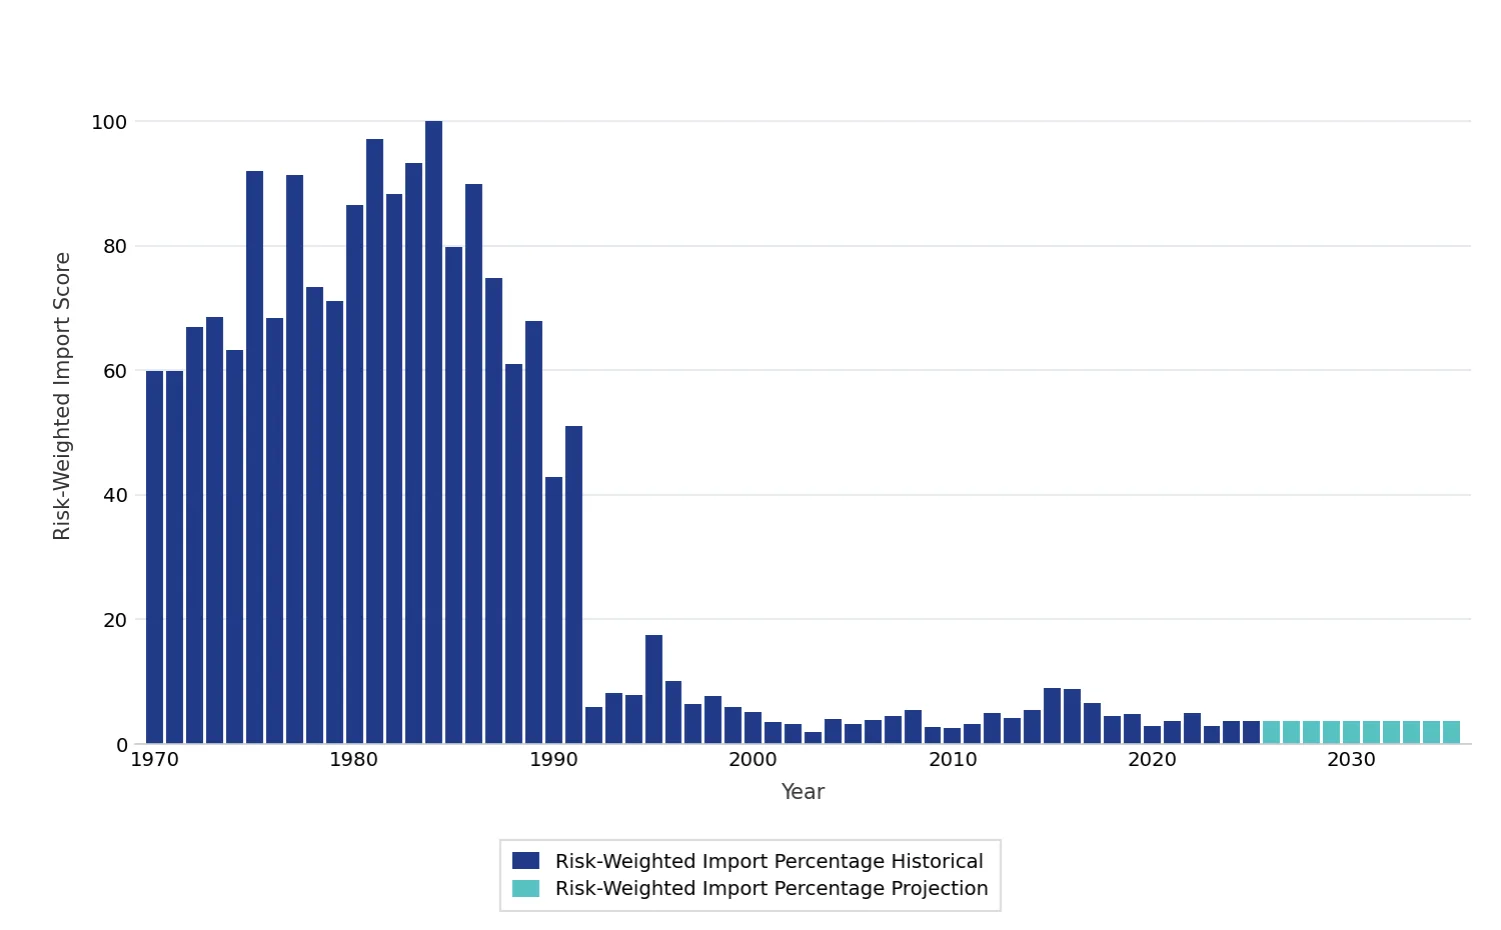
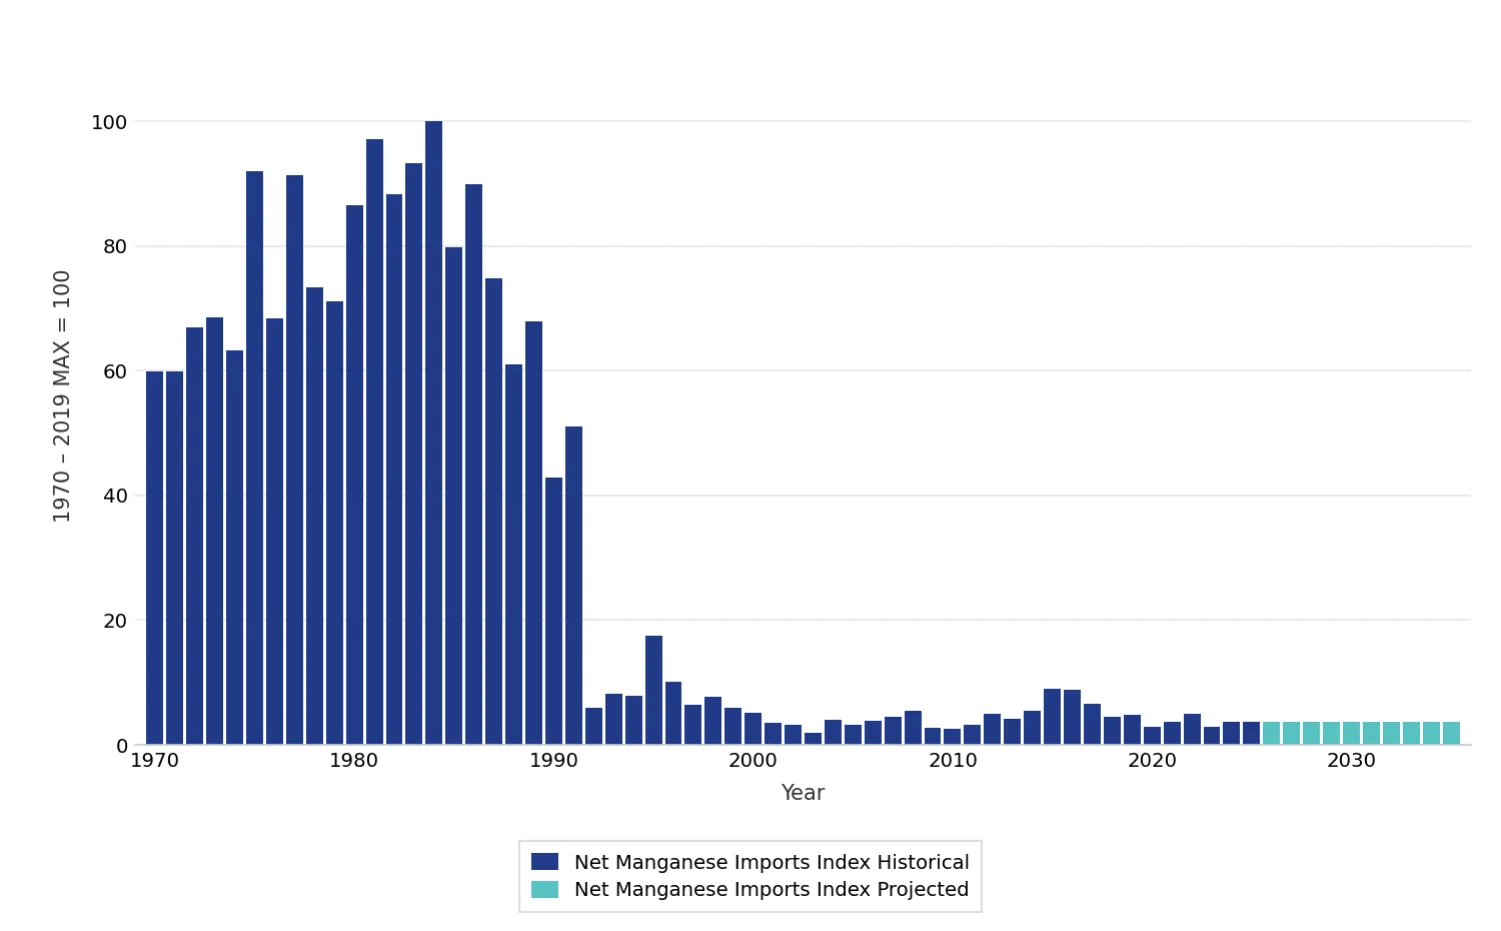
Net Manganese Imports
Indicator Group: Energy Technology Minerals
Why It Is Important: This indicates the degree to which changes in import levels expose the United States to unreliable and concentrated supplies of manganese.
What It Measures: The volume of net manganese imports is weighted by the reliability and diversity of global manganese ore supplies. This indicator combines: (1) the quantity of net manganese imports as a share of apparent consumption, and (2) the level of risk tied to each unit of manganese ore produced globally.
How It Is Calculated: This indicator is the product of: (1) net manganese imports as a share of apparent consumption weighted by the share of total U.S. energy consumption accounted for by electricity generation from wind and solar plus electricity for battery storage and electric vehicles; and (2) the reliability and diversity of global manganese ore production, excluding the United States, Canada, and Mexico. The values were normalized so that the maximum (i.e., worst) historical value from 1970 to 2019 = 100.
Data Sources: Freedom House’s Freedom in the World series; British Geological Survey’s World Mineral Statistics series; U.S. Geological Survey’s Mineral Commodity Summaries series
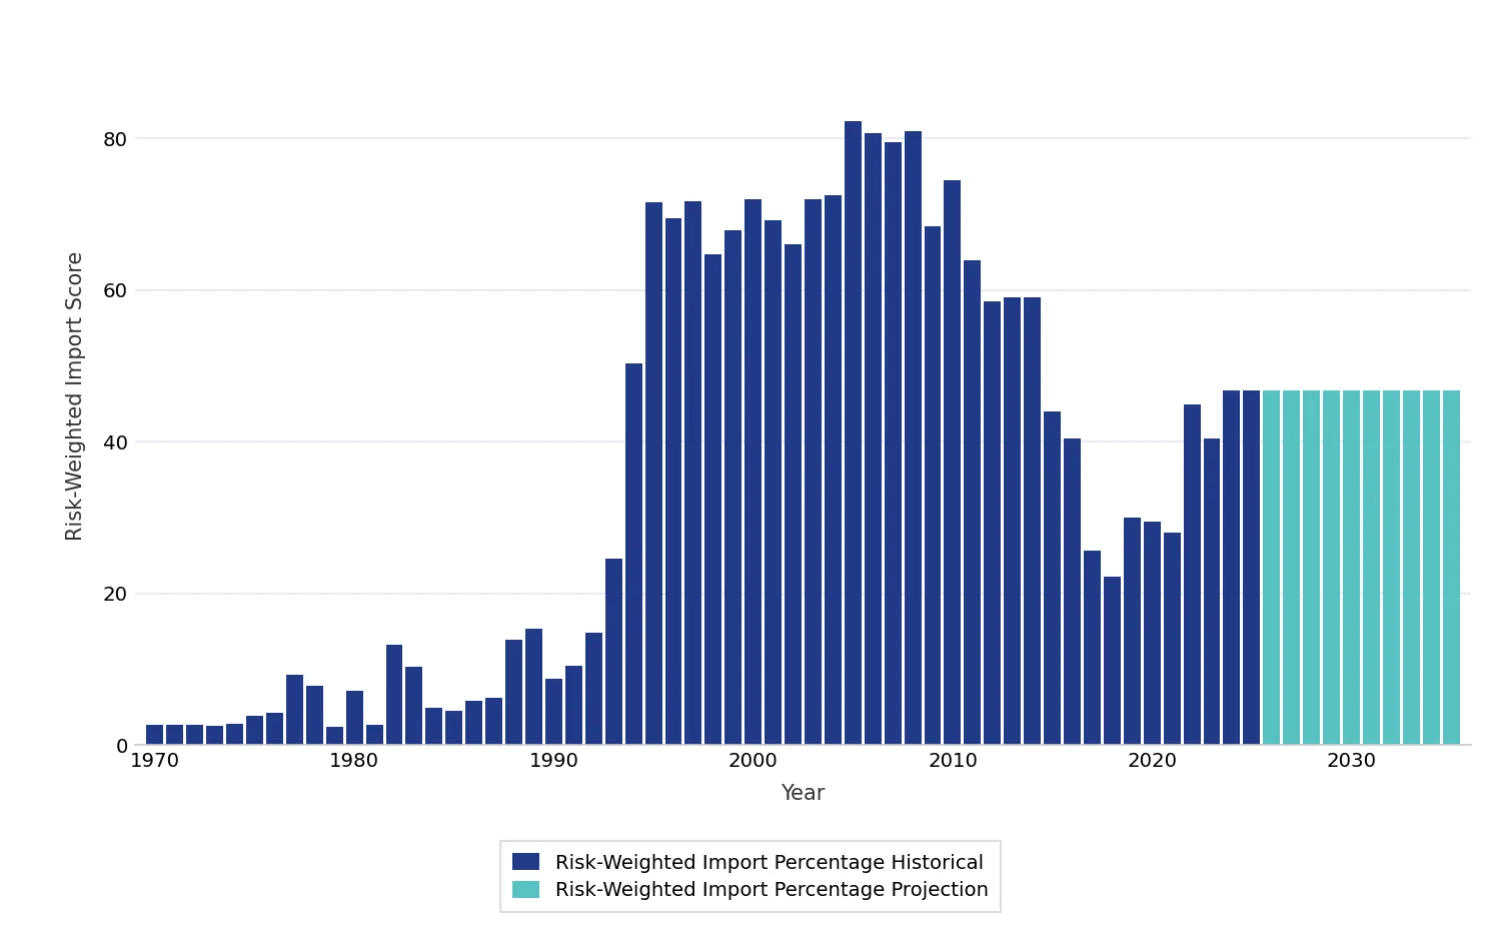
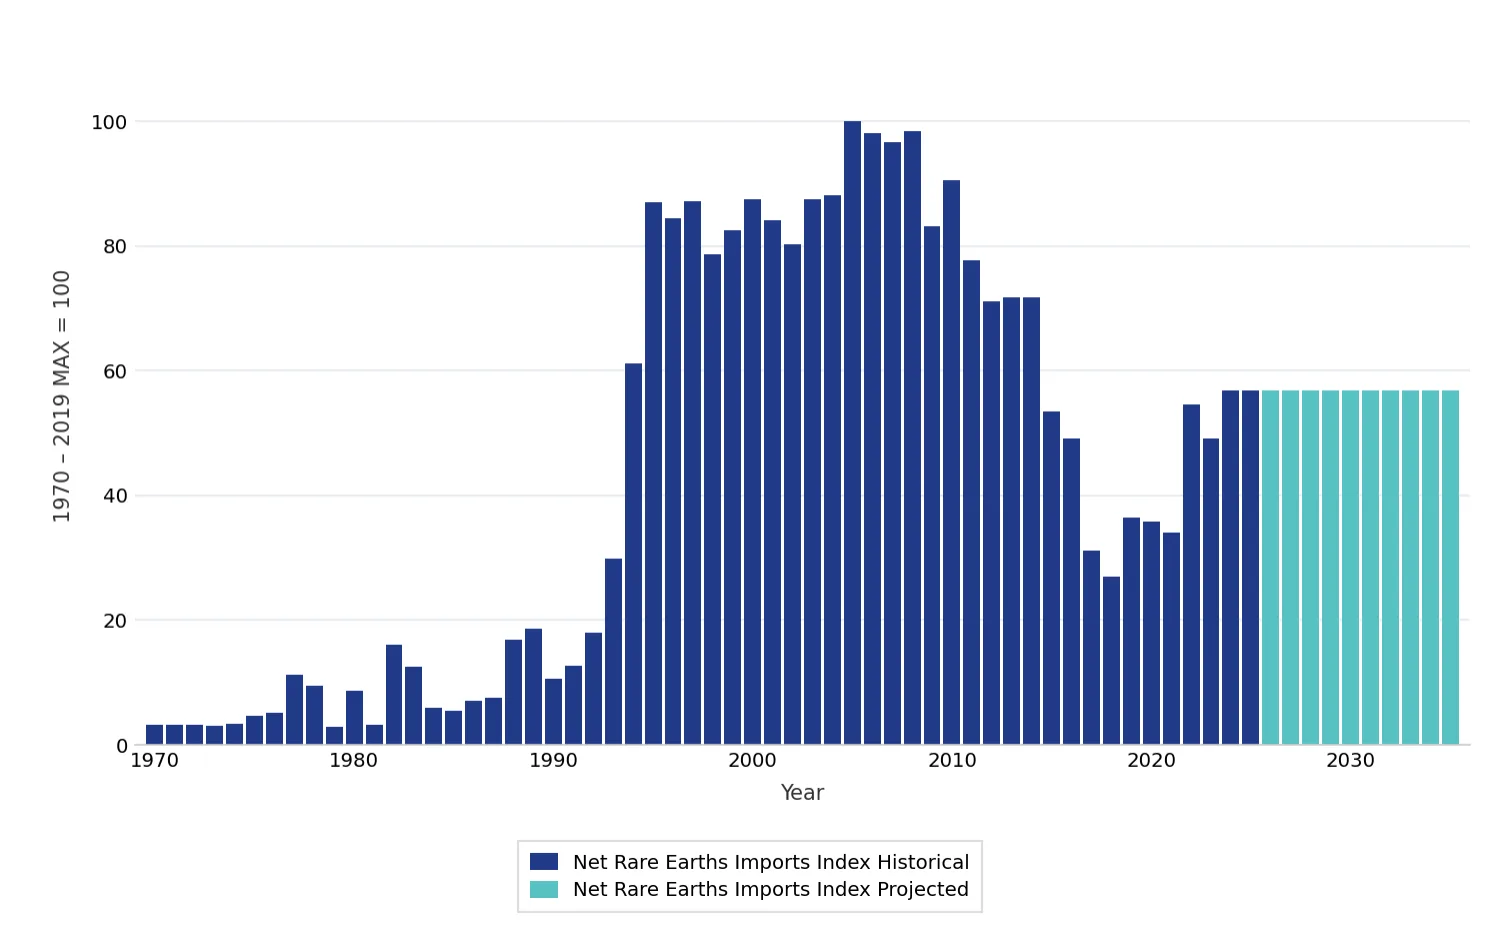
Net Rare Earths Imports
Indicator Group: Energy Technology Minerals
Why It Is Important: This indicates the degree to which changes in import levels expose the United States to unreliable and concentrated supplies of rare earths.
What It Measures: The volume of net rare earths imports is weighted by the reliability and diversity of global rare earths mineral supplies. This indicator combines: (1) the quantity of net rare earths imports as a share of apparent consumption, and (2) the level of risk tied to each unit of rare earths minerals produced globally.
How It Is Calculated: This indicator is the product of: (1) net rare earths imports as a share of apparent consumption weighted by the share of total U.S. energy consumption accounted for by electricity generation from wind and solar plus electricity for battery storage and electric vehicles; and (2) the reliability and diversity of global rare earths mineral production, excluding the United States, Canada, and Mexico. The values were normalized so that the maximum (i.e., worst) historical value from 1970 to 2019 = 100.
Data Sources: Freedom House’s Freedom in the World series; British Geological Survey’s World Mineral Statistics series; U.S. Geological Survey’s Mineral Commodity Summaries series
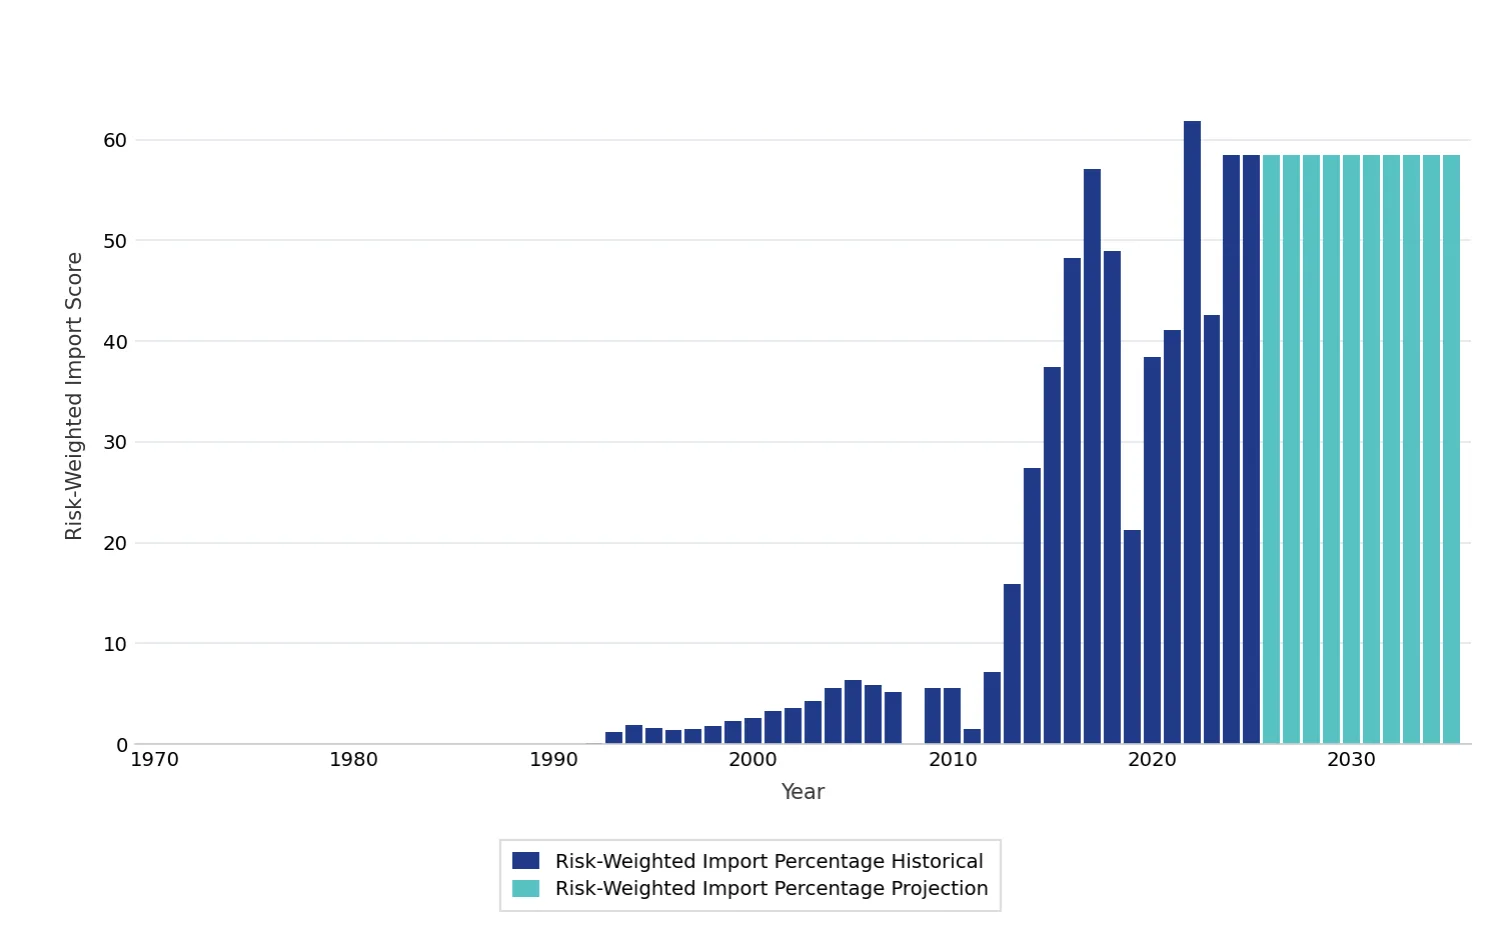
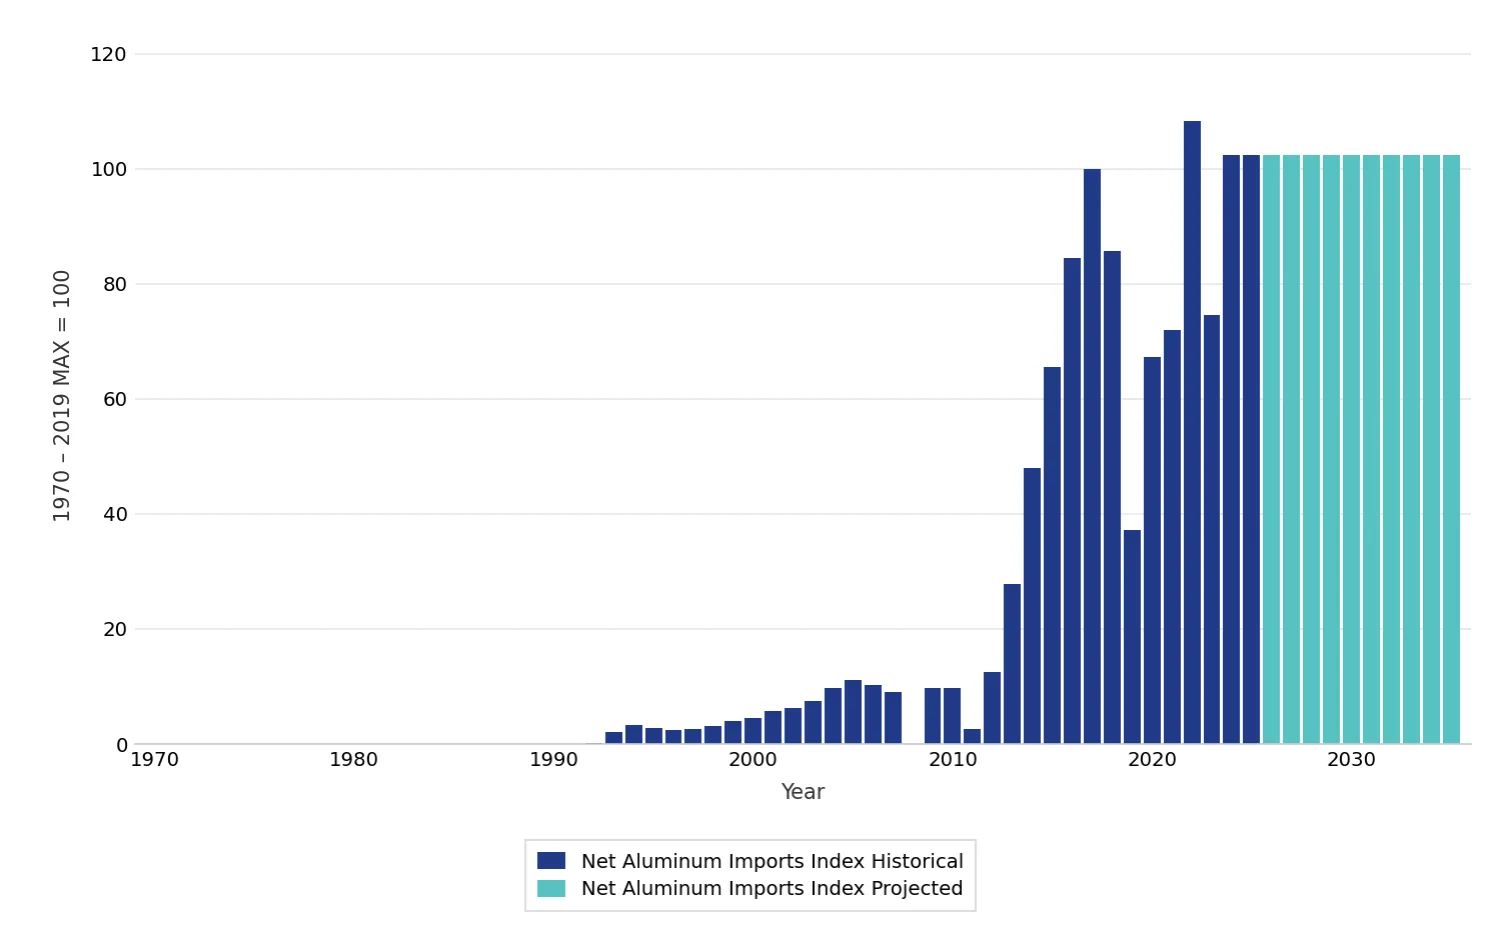
Net Aluminum Imports
Indicator Group: Energy Infrastructure Minerals
Why It Is Important: This indicates the degree to which changes in import levels expose the United States to unreliable and concentrated supplies of aluminum.
What It Measures: The volume of net aluminum imports is weighted by the reliability and diversity of global primary aluminum supplies. This indicator combines: (1) the quantity of net aluminum imports as a share of apparent consumption, and (2) the level of risk tied to each unit of primary aluminum produced globally.
How It Is Calculated: This indicator is the product of: (1) net aluminum imports as a share of apparent consumption weighted by energy industries (including oil and gas extraction; utilities; electrical equipment, appliances, and components; and petroleum and coal products) as a share of U.S. GDP; and (2) the reliability and diversity of global aluminum mineral production, excluding the United States, Canada, and Mexico. The values were normalized so that the maximum (i.e., worst) historical value from 1970 to 2019 = 100.
Data Sources: Freedom House’s Freedom in the World series; British Geological Survey’s World Mineral Statistics series; U.S. Geological Survey’s Mineral Commodity Summaries series
Net Copper Imports
Indicator Group: Energy Infrastructure Minerals
Why It Is Important: This indicates the degree to which changes in import levels expose the United States to unreliable and concentrated supplies of copper.
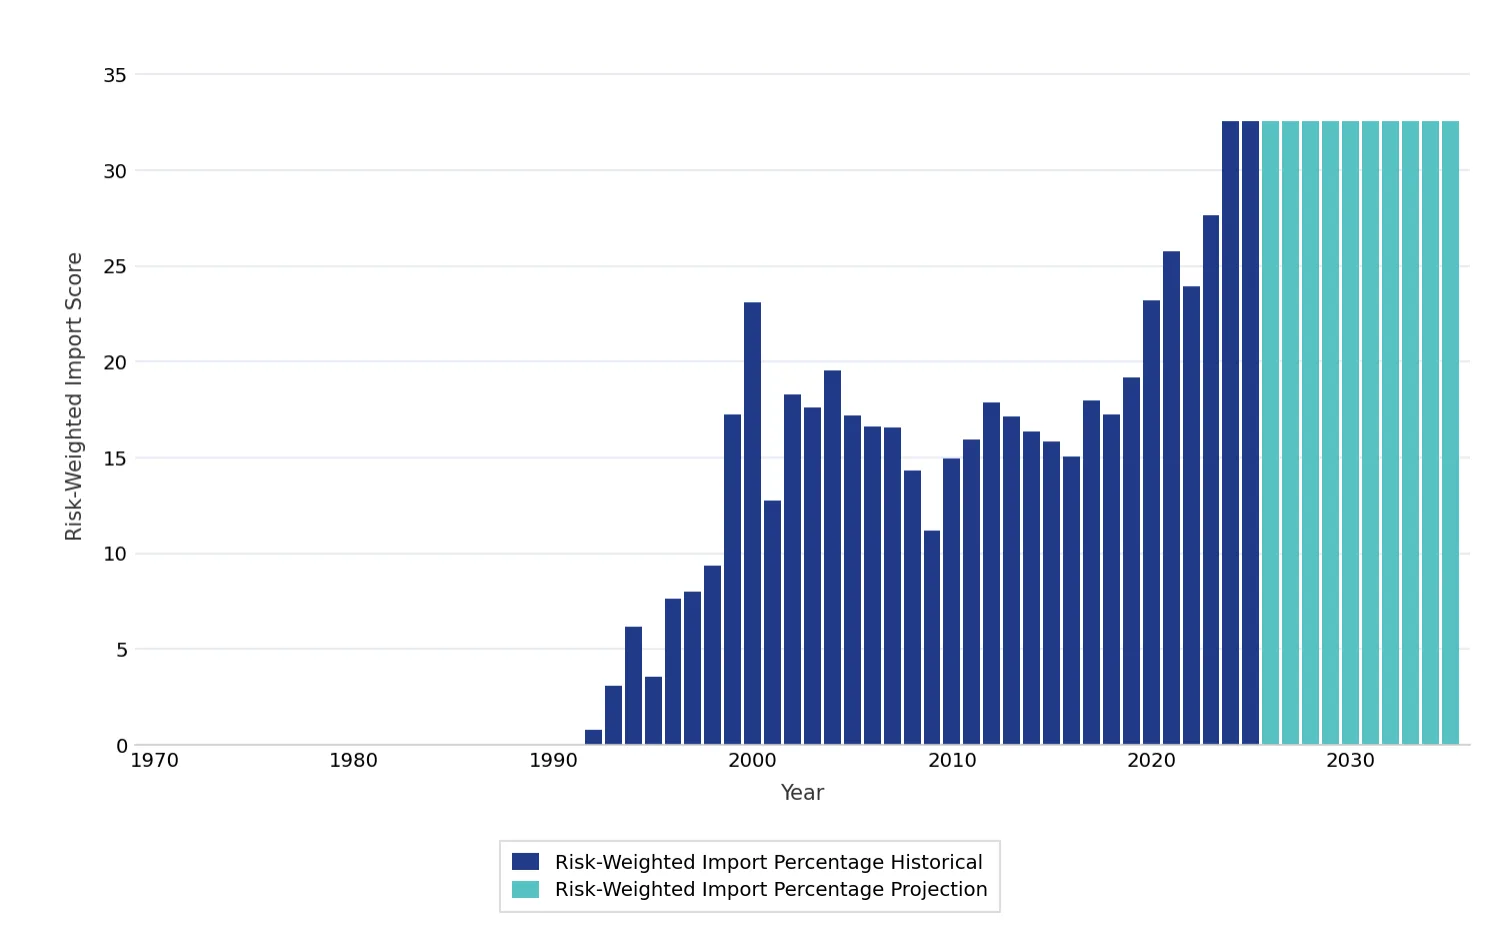
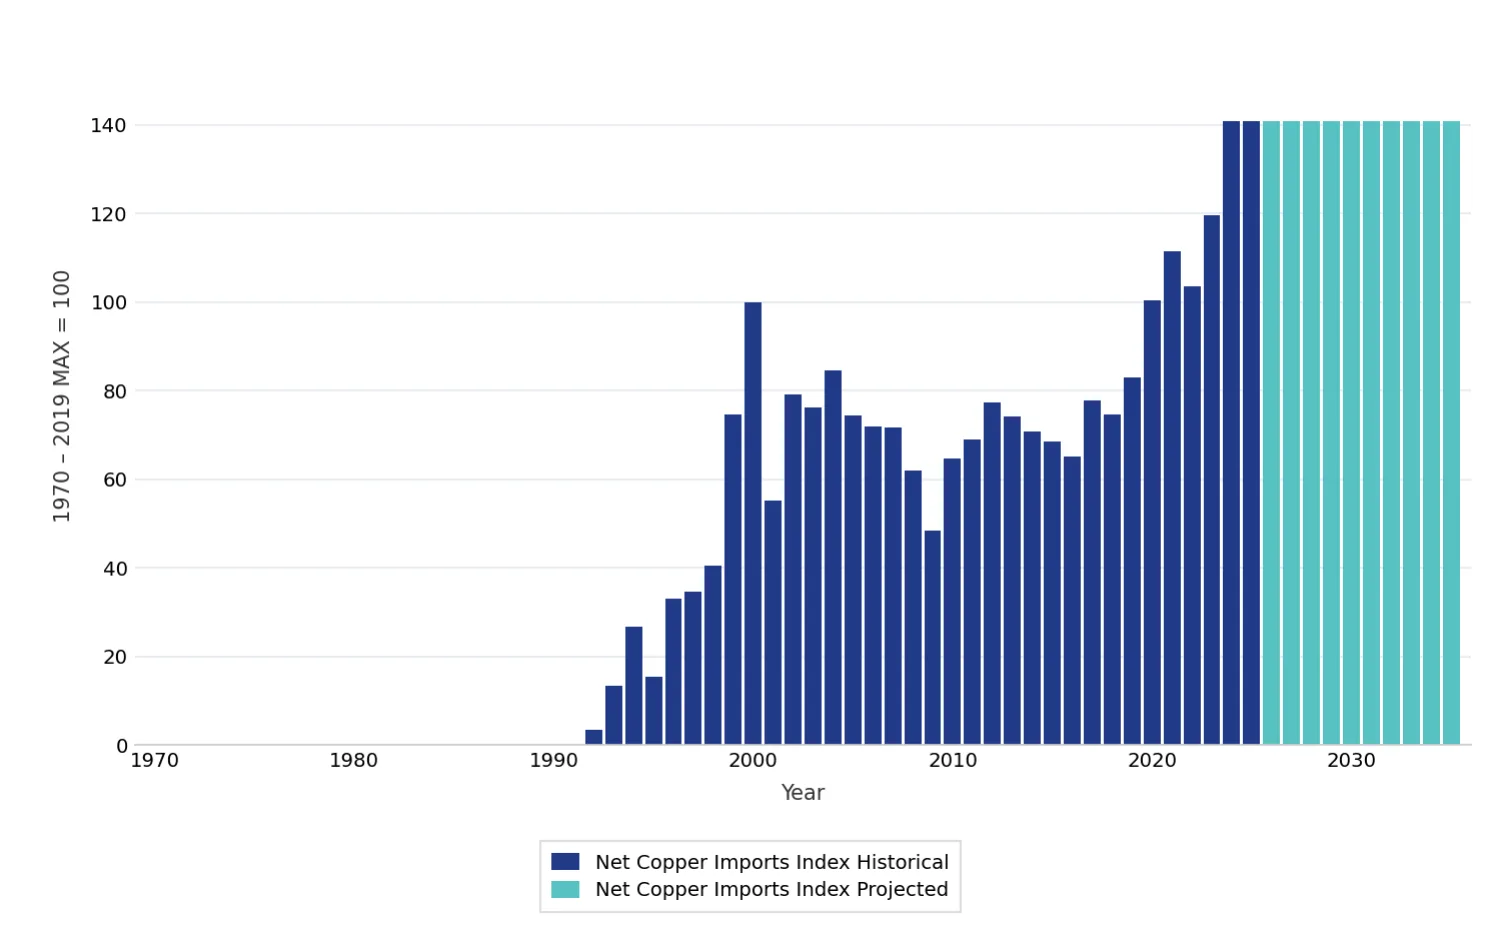
What It Measures: The volume of net copper imports is weighted by the reliability and diversity of global mined copper supplies. This indicator combines: (1) the quantity of net copper imports as a share of apparent consumption, and (2) the level of risk tied to each unit of mined copper produced globally.
How It Is Calculated: This indicator is the product of: (1) net copper imports as a share of apparent consumption weighted by energy industries (including oil and gas extraction; utilities; electrical equipment, appliances, and components; and petroleum and coal products) as a share of U.S. GDP; and (2) the reliability and diversity of global copper mineral production, excluding the United States, Canada, and Mexico. The values were normalized so that the maximum (i.e., worst) historical value from 1970 to 2019 = 100.
Data Sources: Freedom House’s Freedom in the World series; British Geological Survey’s World Mineral Statistics series; U.S. Geological Survey’s Mineral Commodity Summaries series
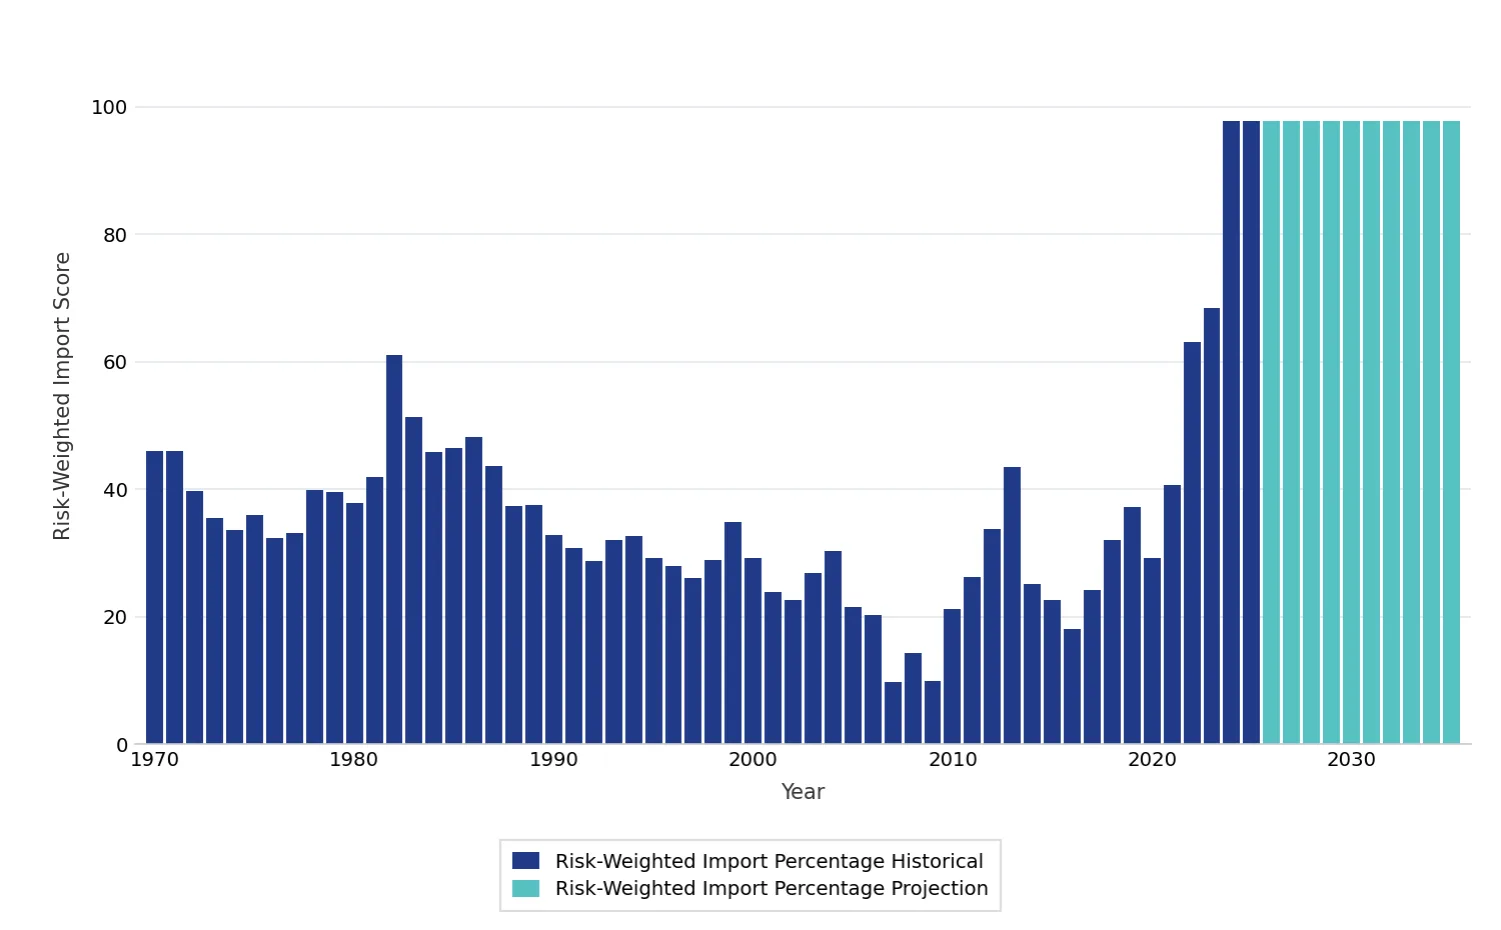
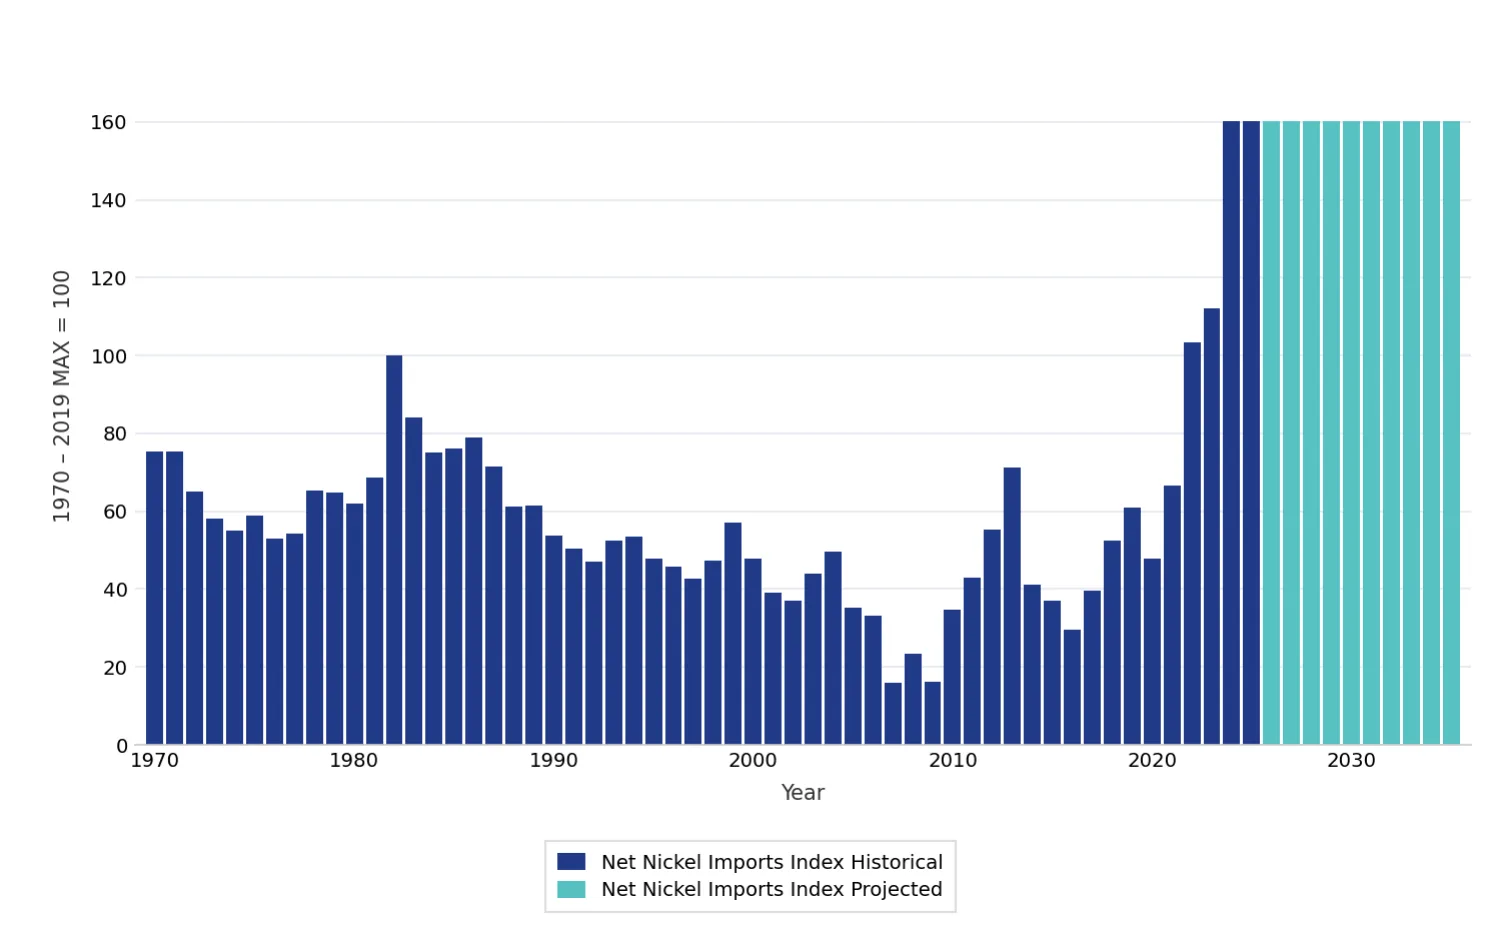
Net Nickel Imports
Indicator Group: Energy Infrastructure Minerals
Why It Is Important: This indicates the degree to which changes in import levels expose the United States to unreliable and concentrated supplies of nickel.
What It Measures: The volume of net nickel imports is weighted by the reliability and diversity of global mined nickel supplies. This indicator combines: (1) the quantity of net nickel imports as a share of apparent consumption, and (2) the level of risk tied to each unit of mined nickel produced globally.
How It Is Calculated: This indicator is the product of: (1) net nickel imports as a share of apparent consumption weighted by energy industries (including oil and gas extraction; utilities; electrical equipment, appliances, and components; and petroleum and coal products) as a share of U.S. GDP; and (2) the reliability and diversity of global nickel ore production, excluding the United States, Canada, and Mexico. The values were normalized so that the maximum (i.e., worst) historical value from 1970 to 2019 = 100.
Data Sources: Freedom House’s Freedom in the World series; British Geological Survey’s World Mineral Statistics series; U.S. Geological Survey’s Mineral Commodity Summaries series
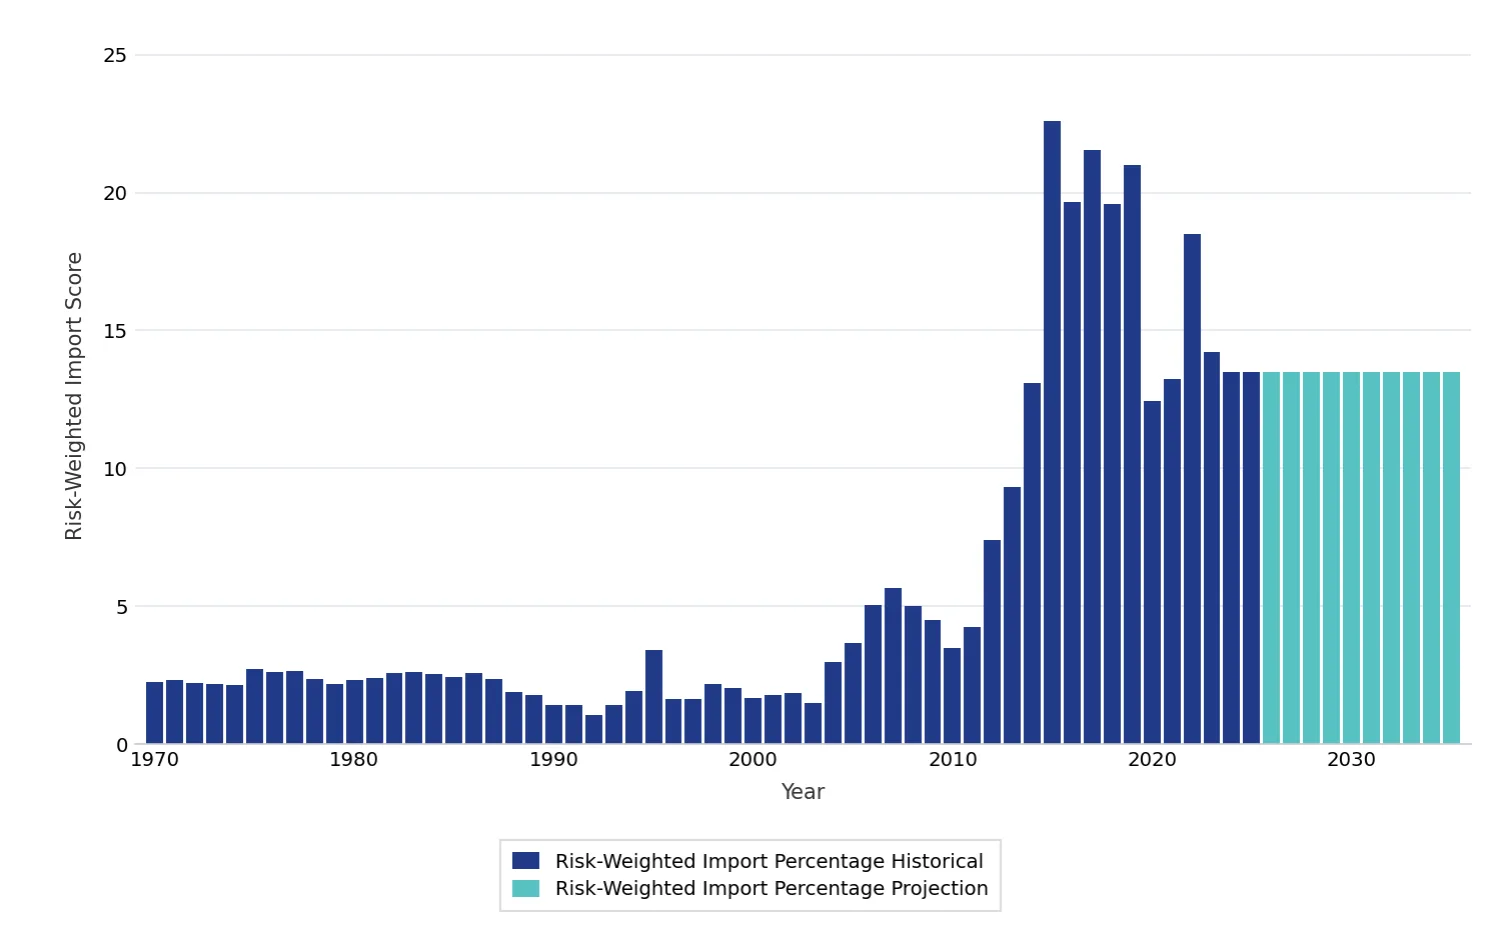
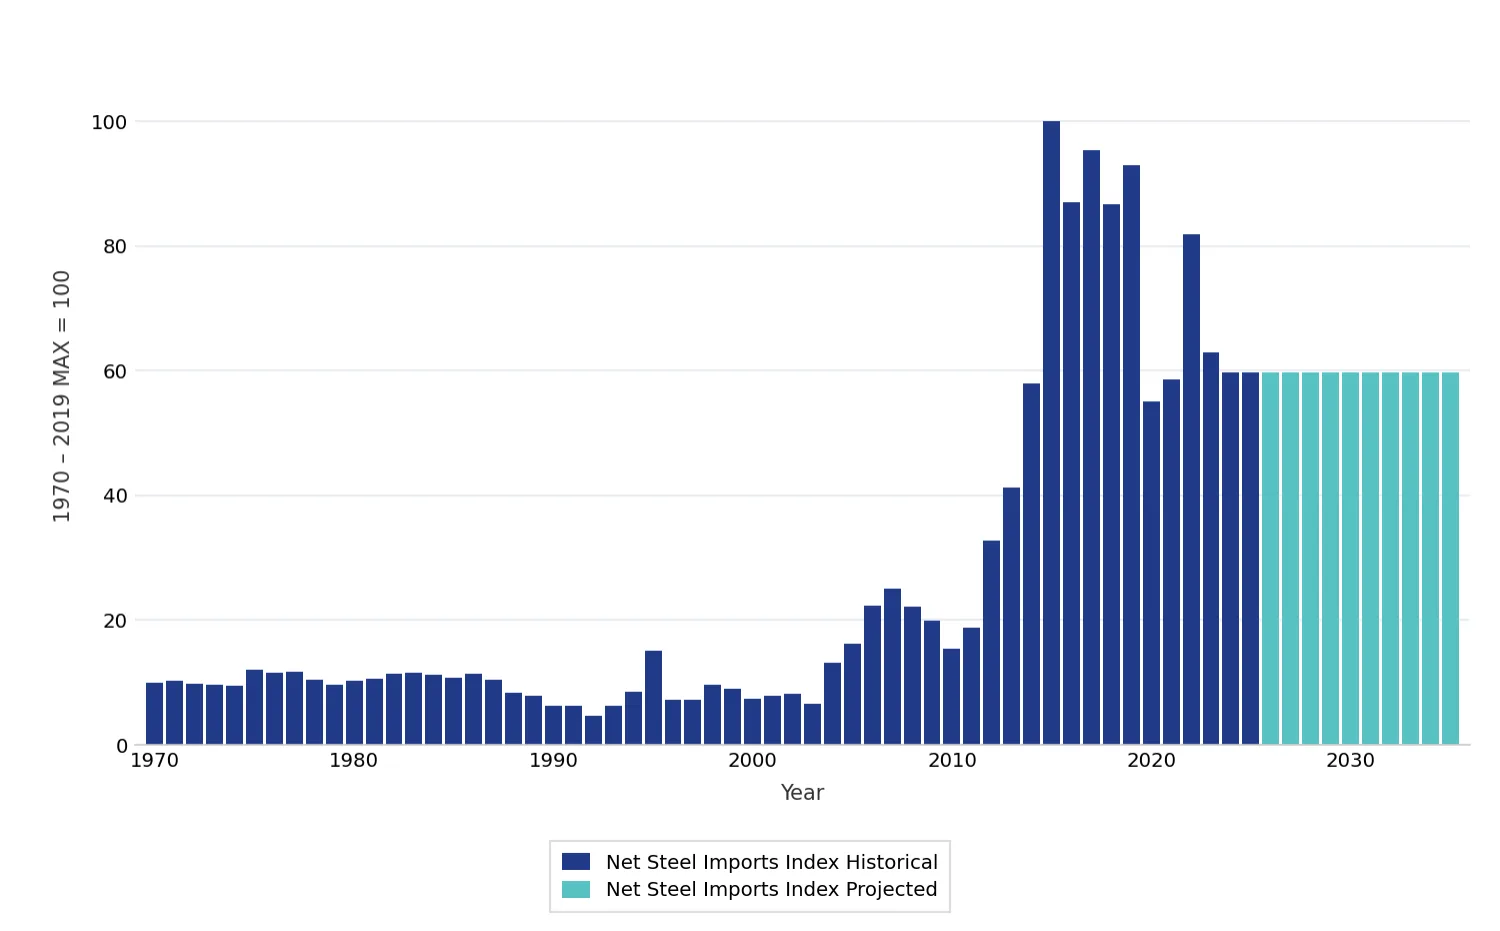
Net Steel Imports
Indicator Group: Energy Infrastructure Minerals
Why It Is Important: This indicates the degree to which changes in import levels expose the United States to unreliable and concentrated supplies of steel.
What It Measures: The volume of net steel imports is weighted by the reliability and diversity of global crude steel supplies. This indicator combines: (1) the quantity of net steel imports as a share of apparent consumption, and (2) the level of risk tied to each unit of crude steel produced globally.
How It Is Calculated: This indicator is the product of: (1) net steel imports as a share of apparent consumption weighted by energy industries (including oil and gas extraction; utilities; electrical equipment, appliances, and components; and petroleum and coal products) as a share of U.S. GDP; and (2) the reliability and diversity of global steel mineral production, excluding the United States, Canada, and Mexico. The values were normalized so that the maximum (i.e., worst) historical value from 1970 to 2019 = 100.
Data Sources: Freedom House’s Freedom in the World series; British Geological Survey’s World Mineral Statistics series; U.S. Geological Survey’s Mineral Commodity Summaries series
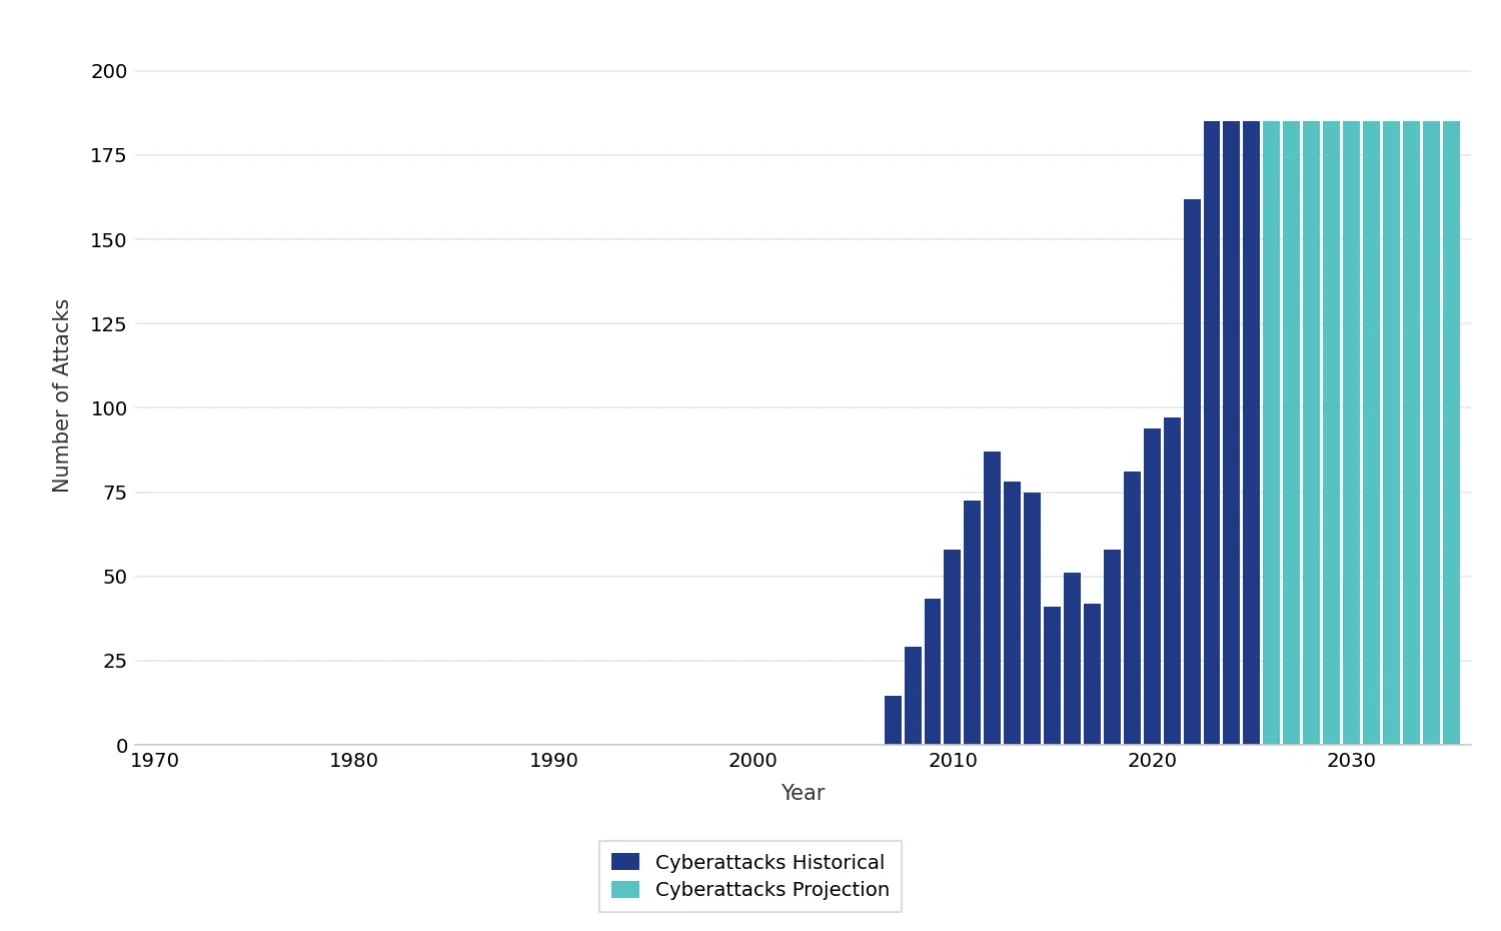
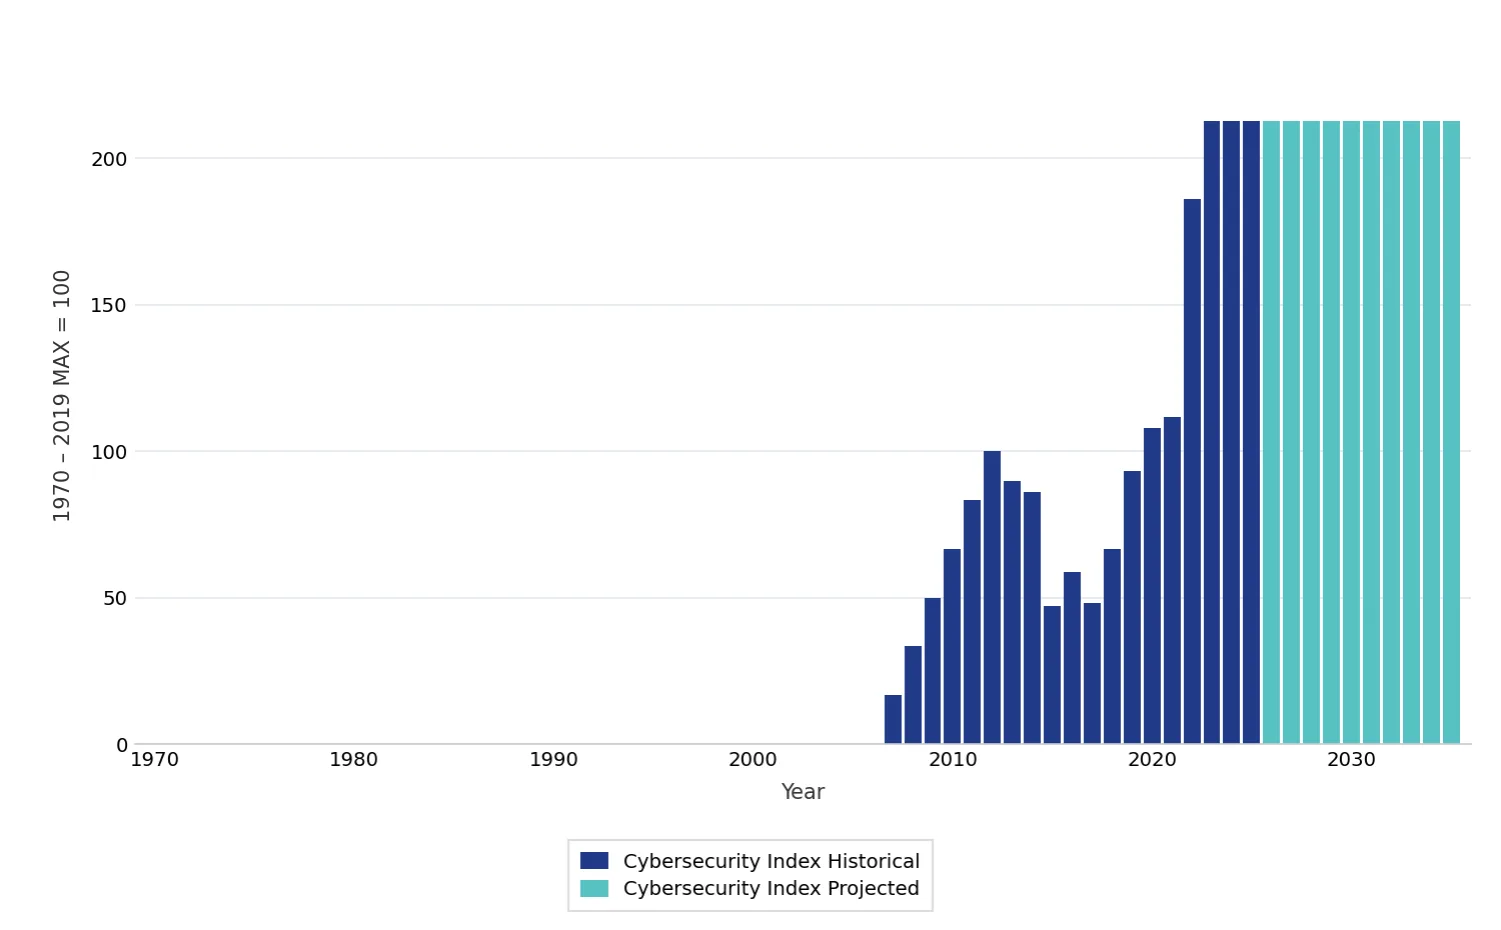
Cybersecurity
Indicator Group: Systemic
Why It Is Important: This indicates the degree to which U.S. energy infrastructure is vulnerable to cyberattacks.
What It Measures: This measures physical and cyberattacks, or threats against the grid, as reported by utilities to the Department of Energy since 2012.
How It Is Calculated: The values were normalized so that the maximum (i.e., worst) historical value from 1970 to 2019 = 100.
Data Source: U.S. Department of Energy
Crude Oil Price Volatility
Indicator Group: Systemic
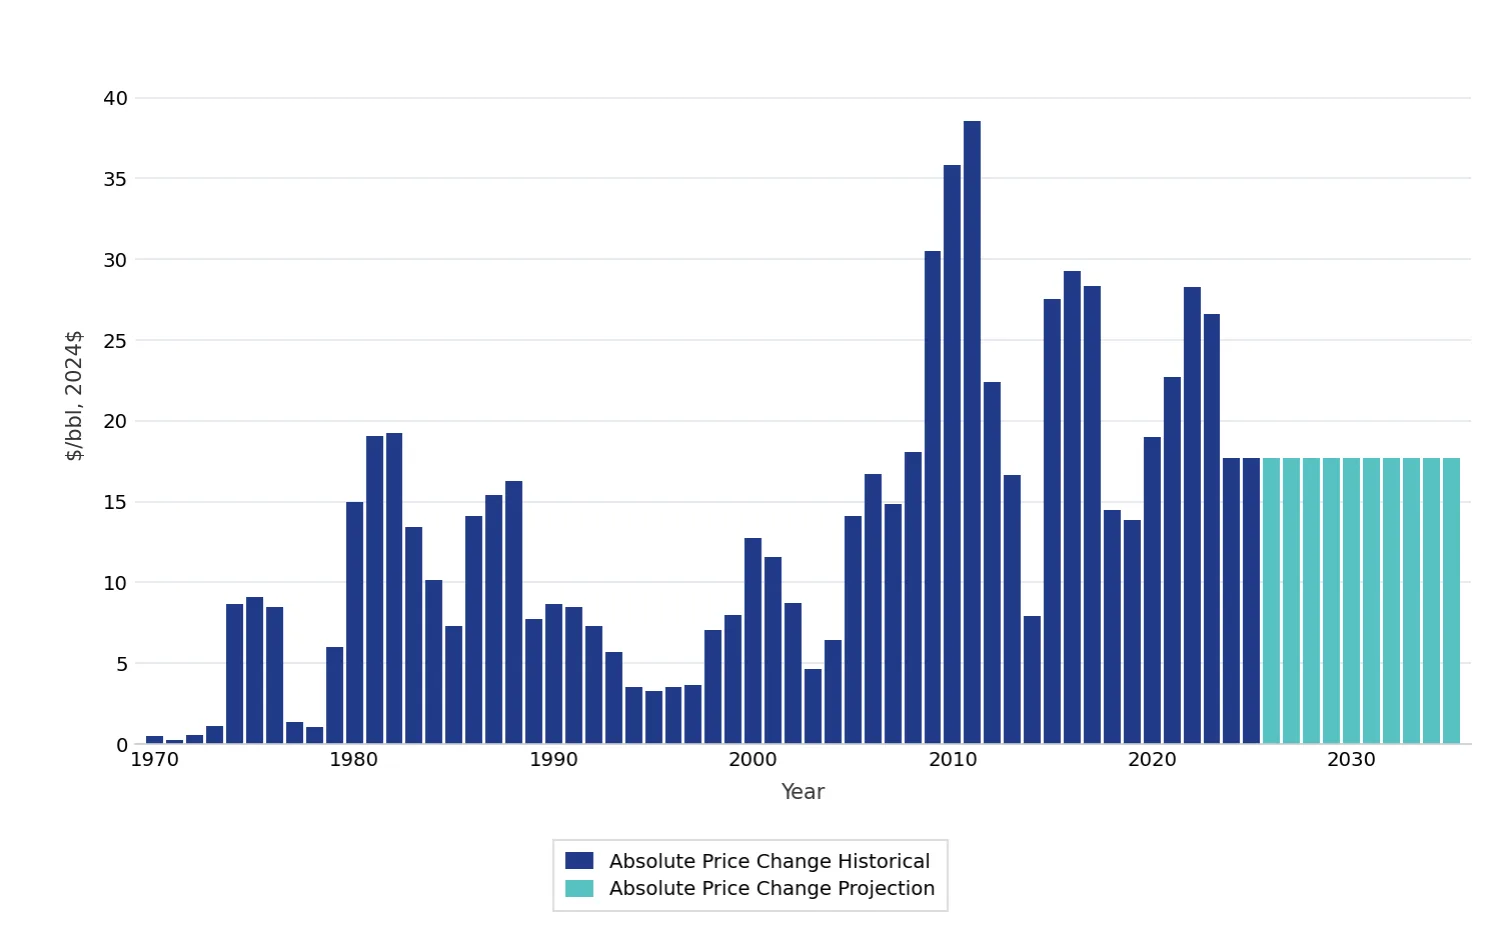
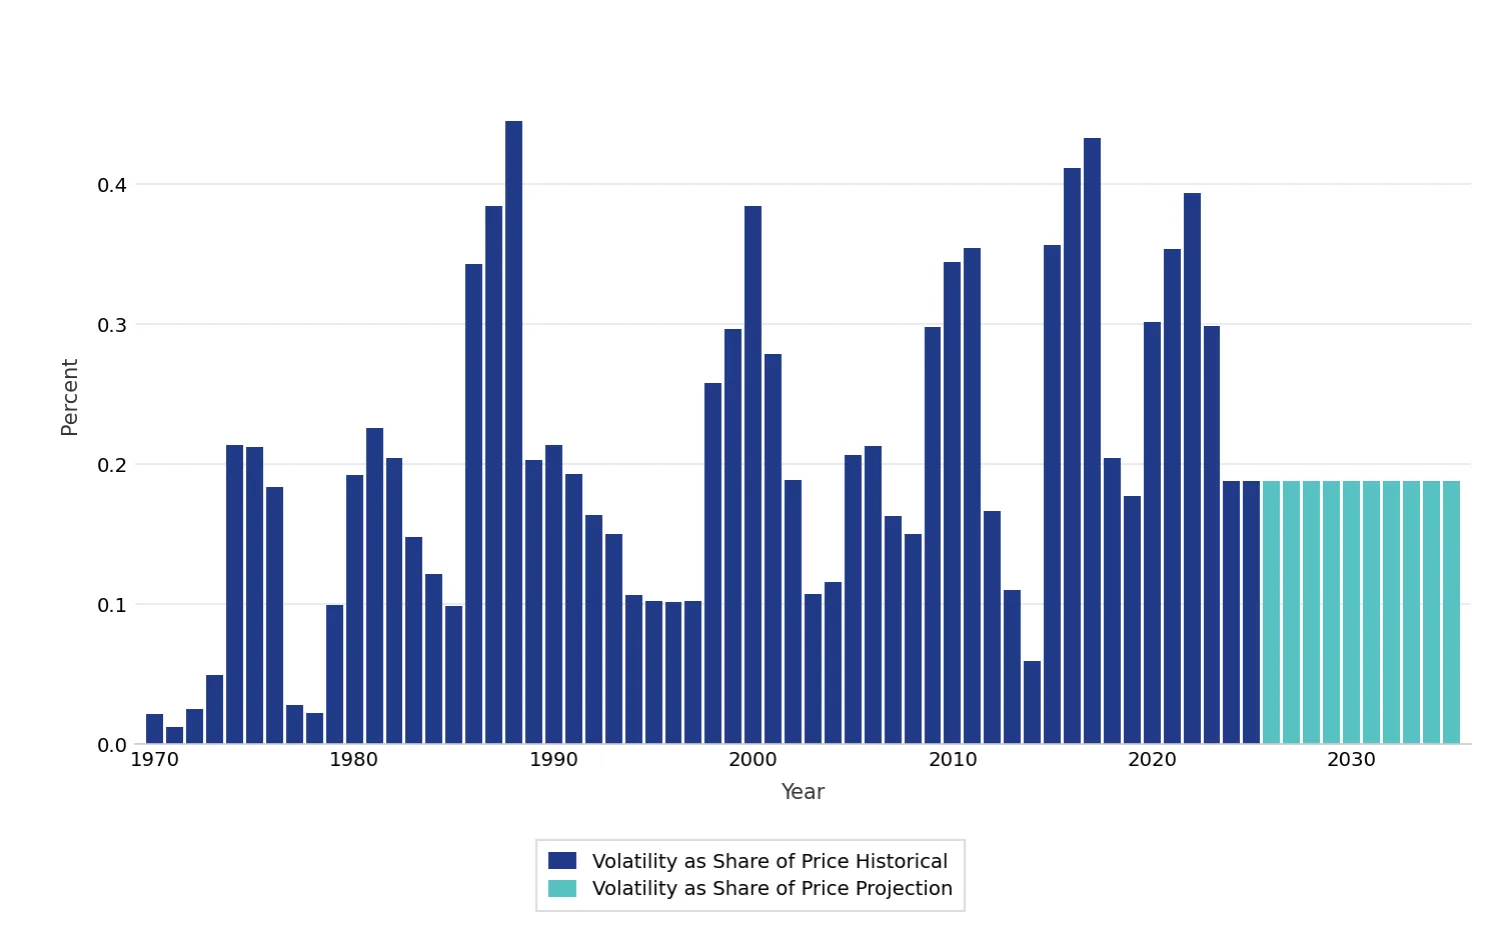
Why It Is Important: This indicates the vulnerability of the U.S. to large swings in the price of crude oil.
What It Measures: This measures the three-year rolling average of the absolute change in the price of a barrel of crude oil from the previous year: (1) in 2024 dollars, and (2) as a share of the price.
How It Is Calculated: The values and share histories were normalized so that the maximum (i.e., worst) historical value from 1970 to 2019 = 100. The annual average of these was then normalized using the same procedure.
Data Sources: EIA’s Petroleum & Other Liquids dataset and Monthly Energy Review series
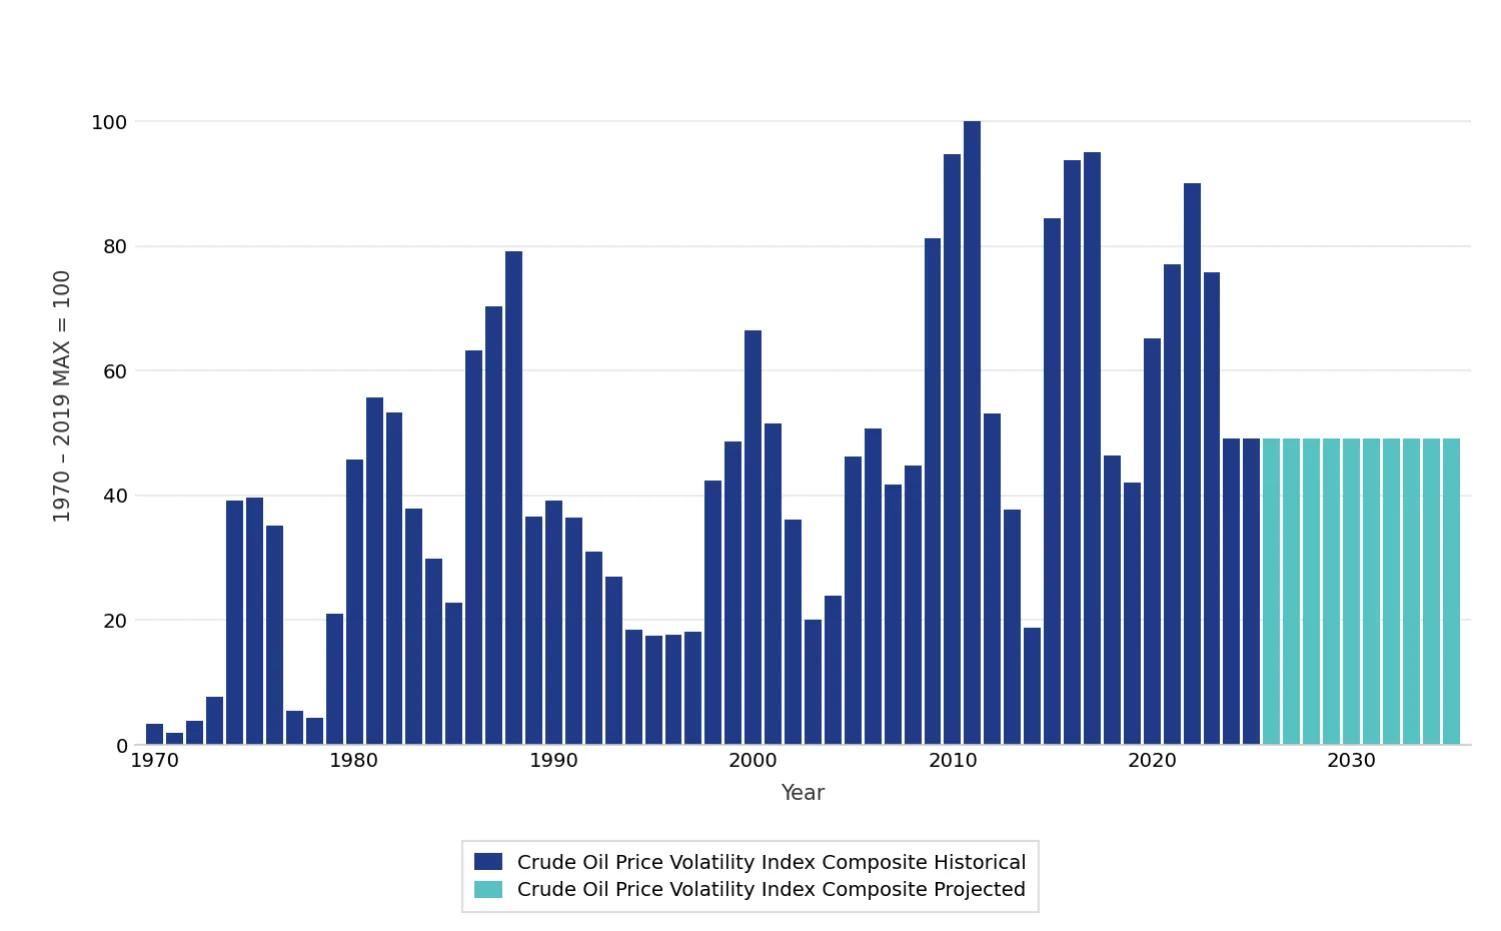
Strategic Petroleum Reserve Stocks
Indicator Group: Systemic
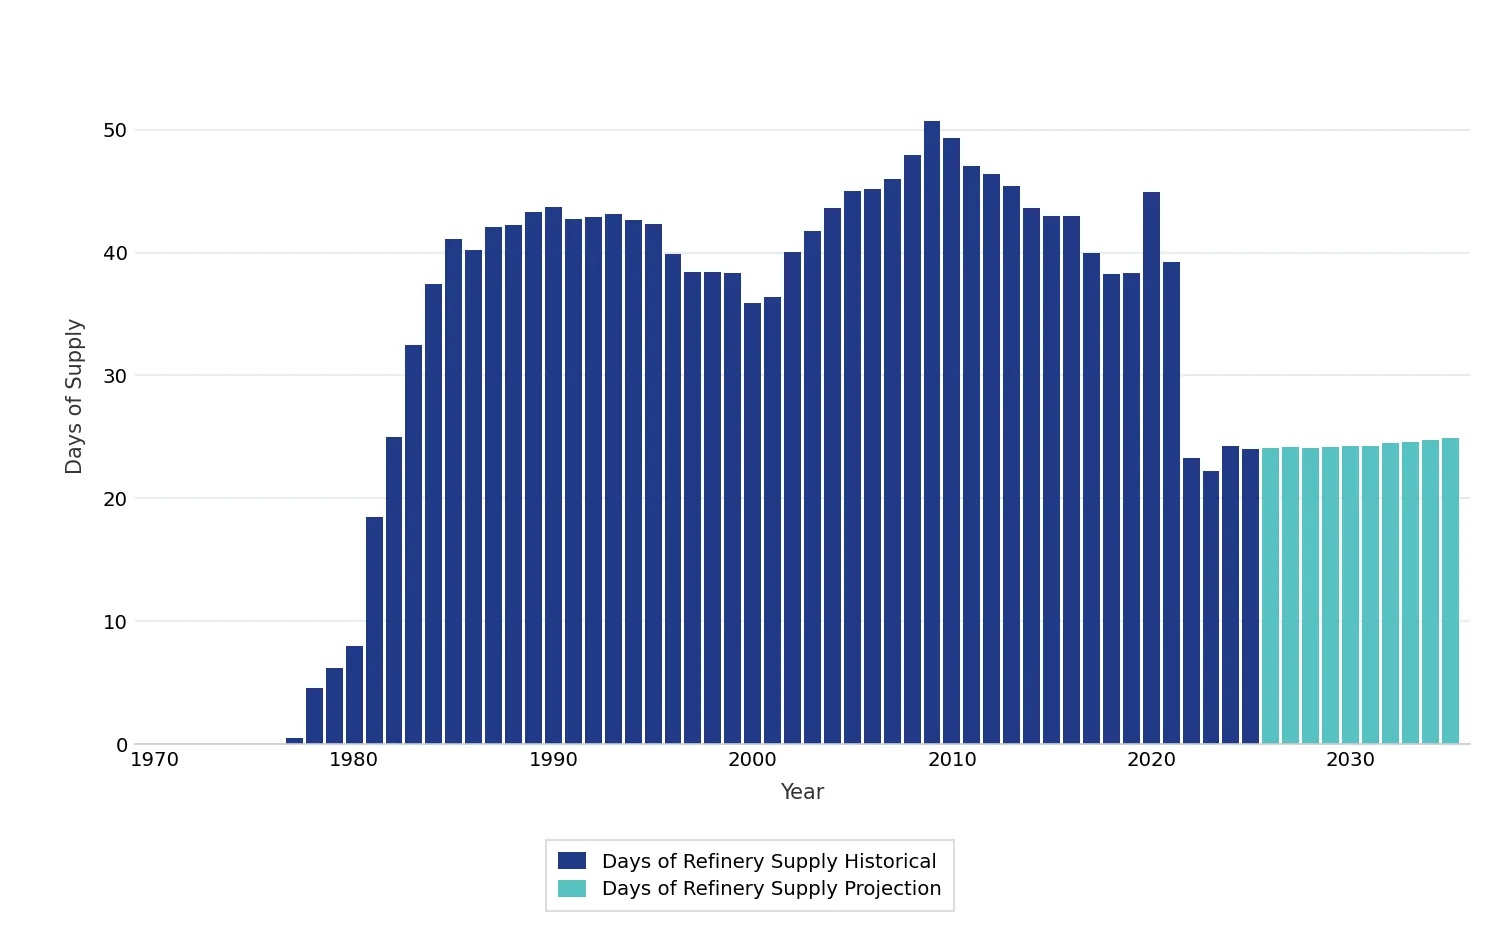
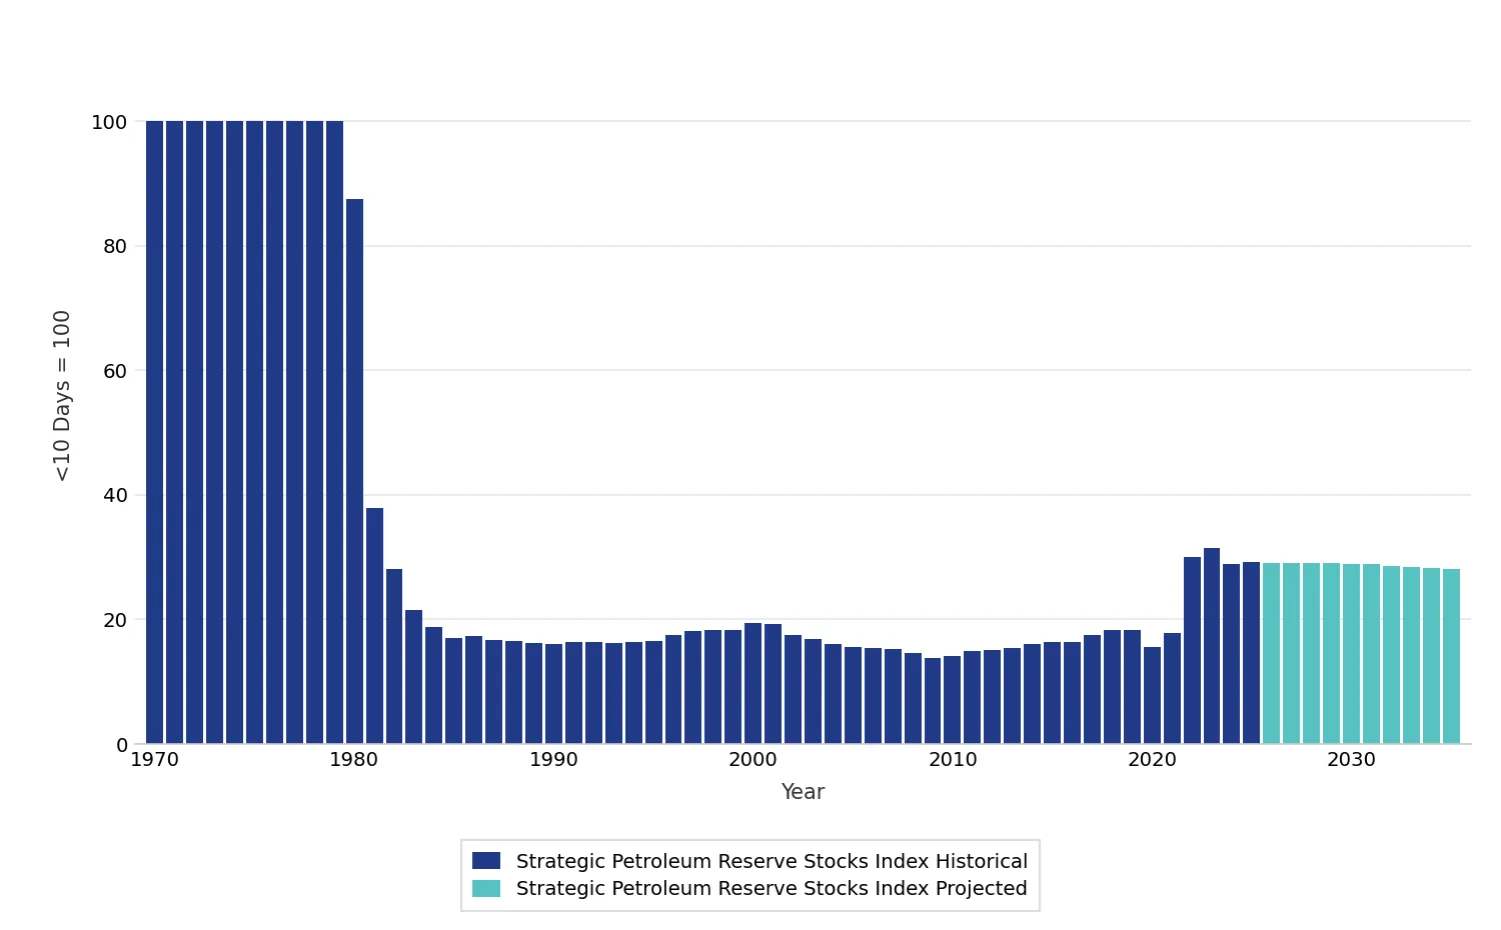
What It Measures: This measures the number of days of average refinery crude oil inputs held in the Strategic Petroleum Reserve (SPR).
How It Is Calculated: The risks measured by SPR stock levels move in the opposite direction from the indicator. The indicator was normalized so that SPR supplies for less than seven days were assigned a maximum score of 100. The time series was then inverted.
Why It Is Important: This indicates susceptibility of the U.S. to a crude oil supply disruption, based on the quantity of stockpiled crude oil available to be drawn down during an emergency.
Data Source: EIA’s Monthly Energy Review series
Data Output
Table A-3. Energy Security Index Indicator Values, 1970–2035
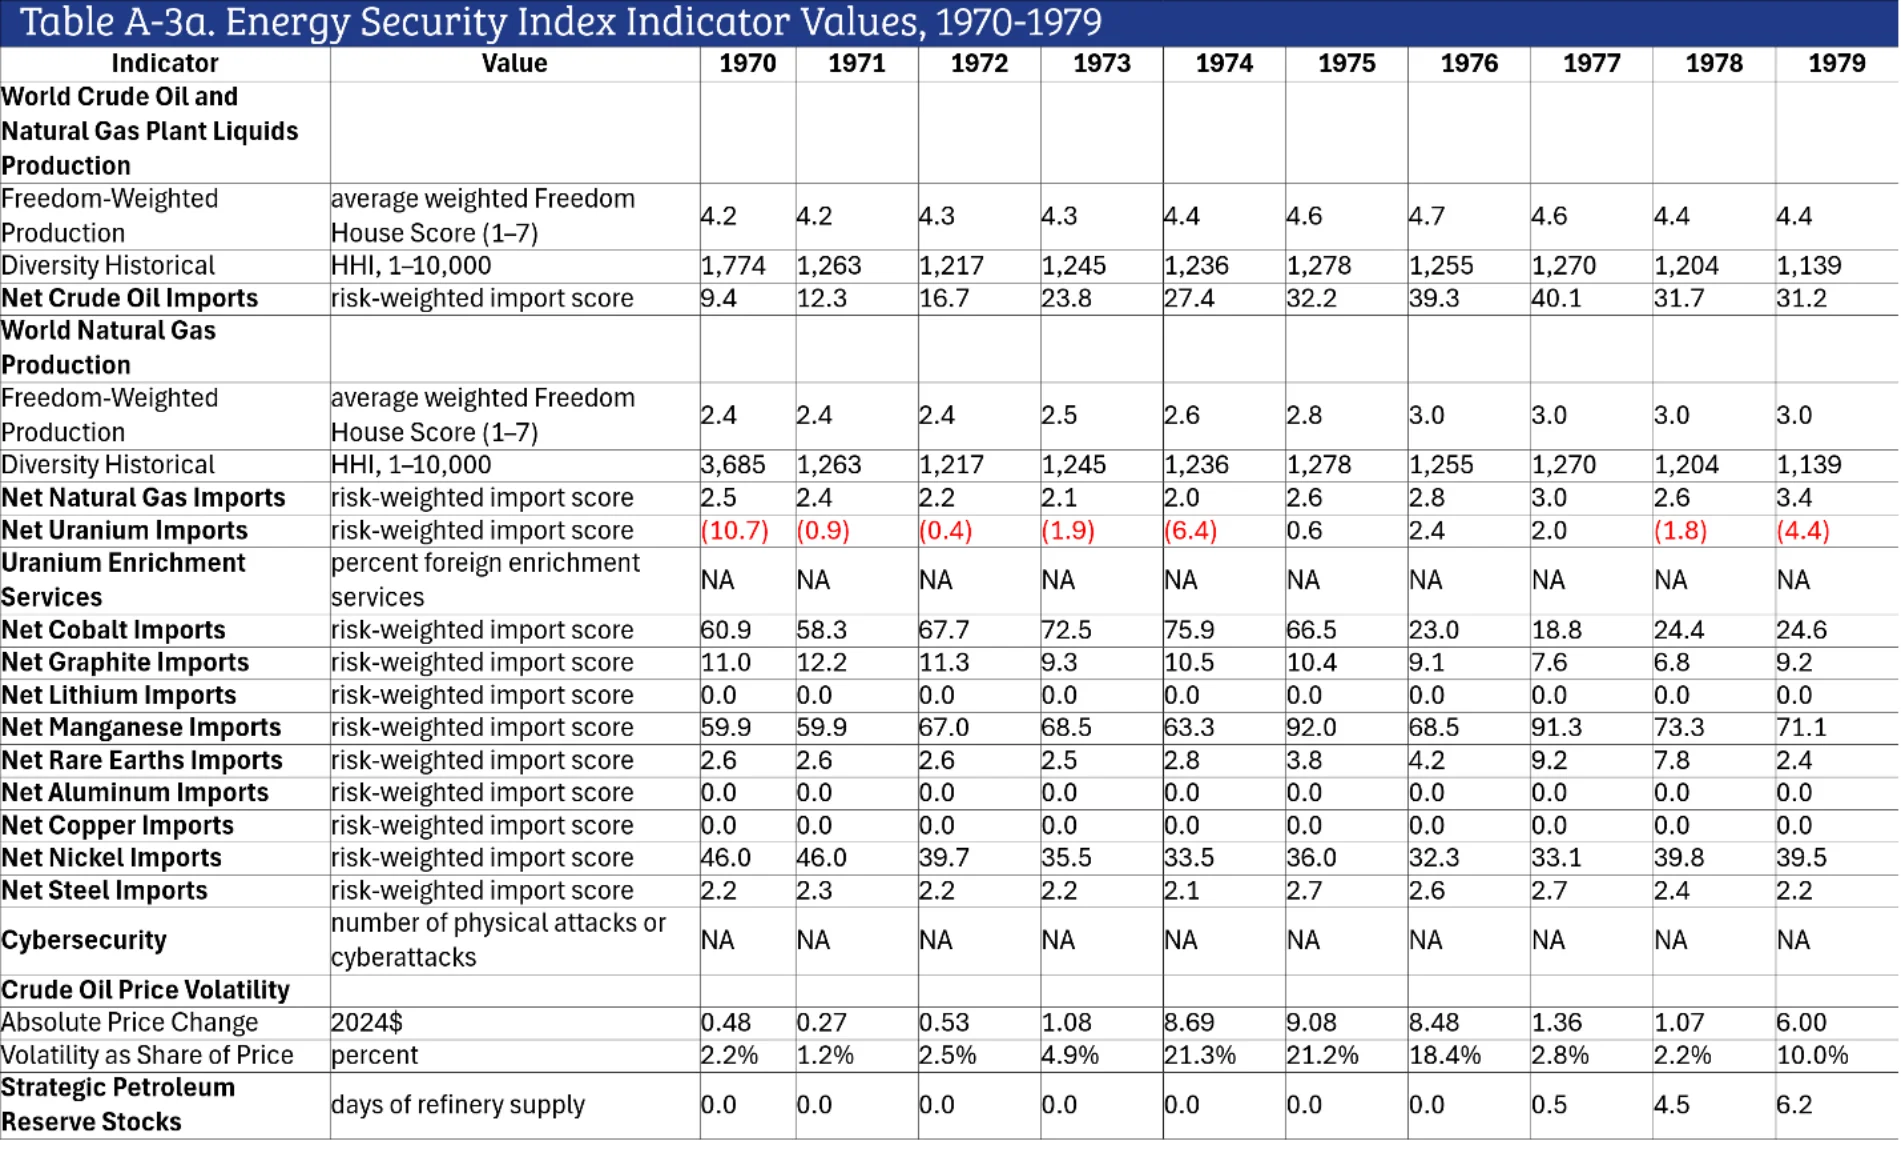
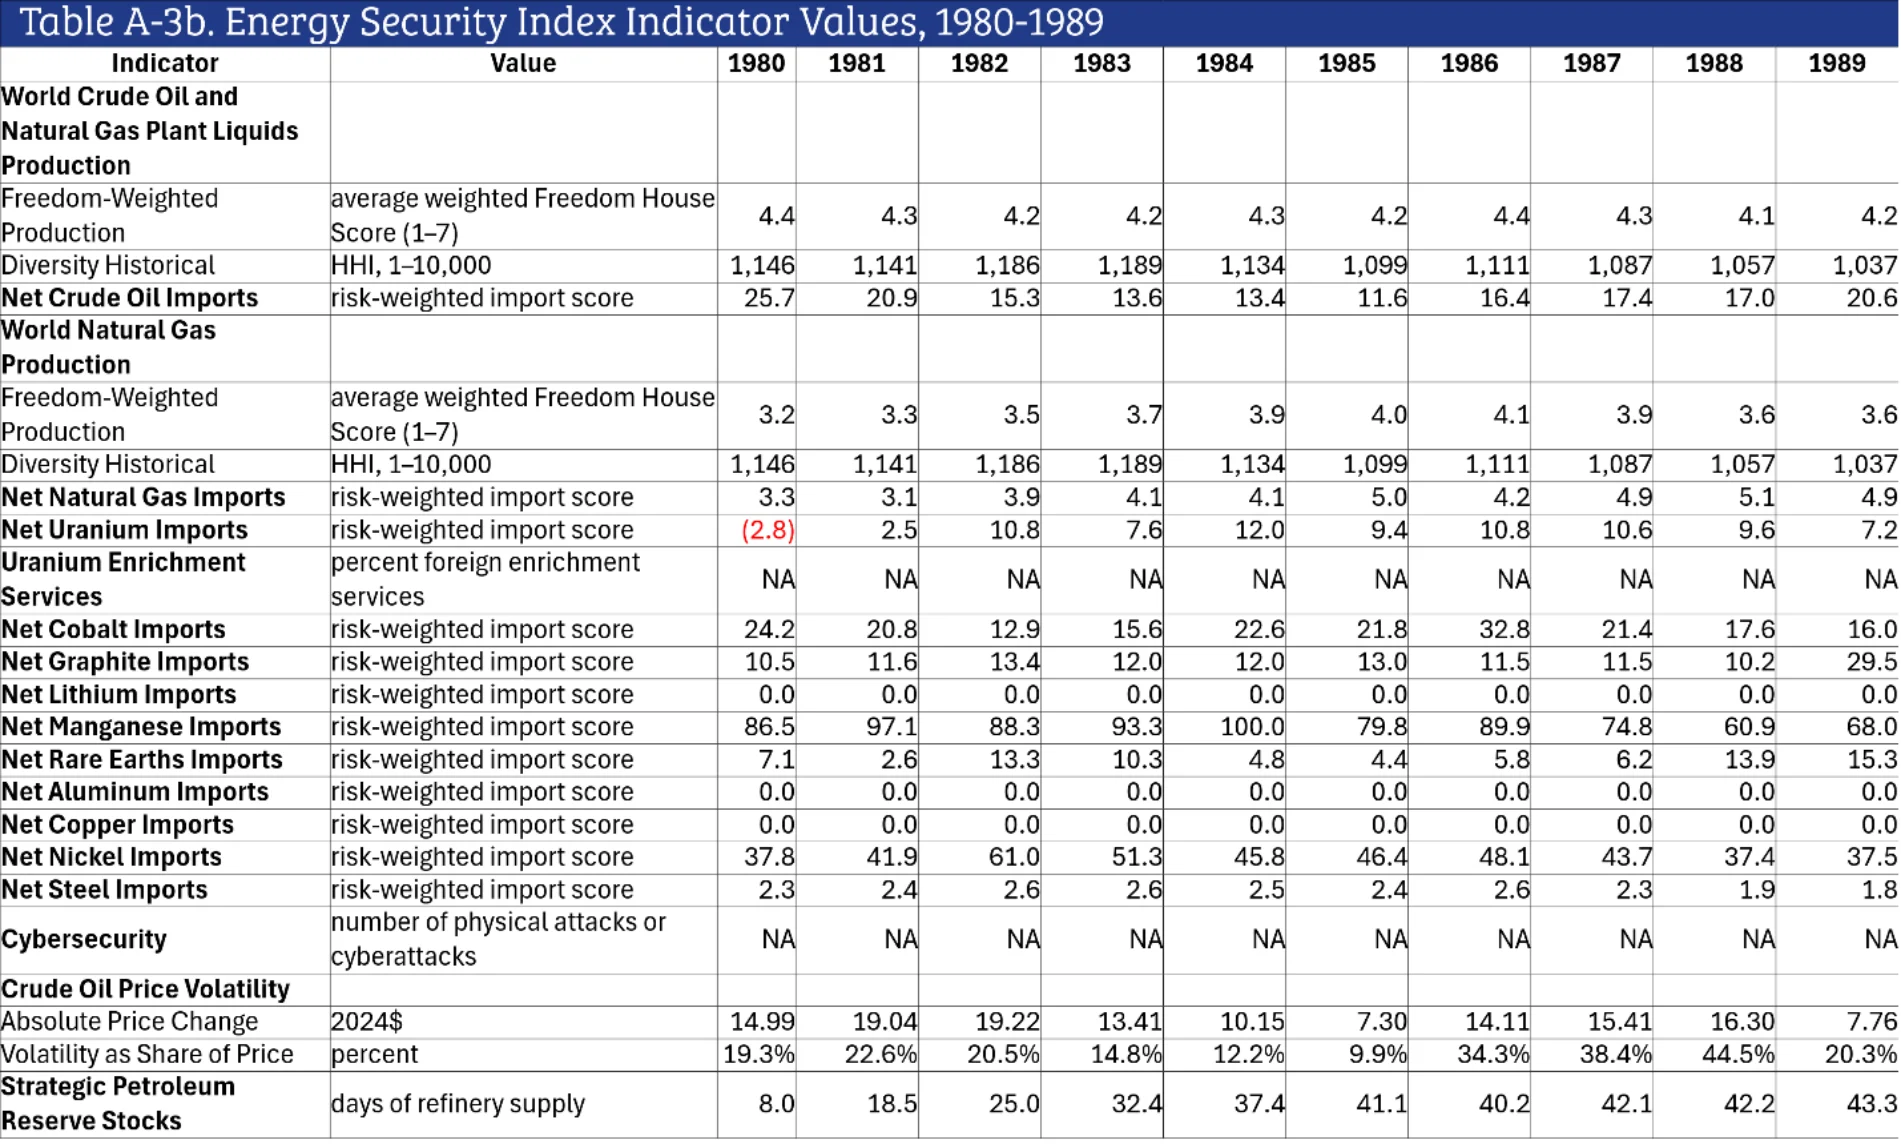
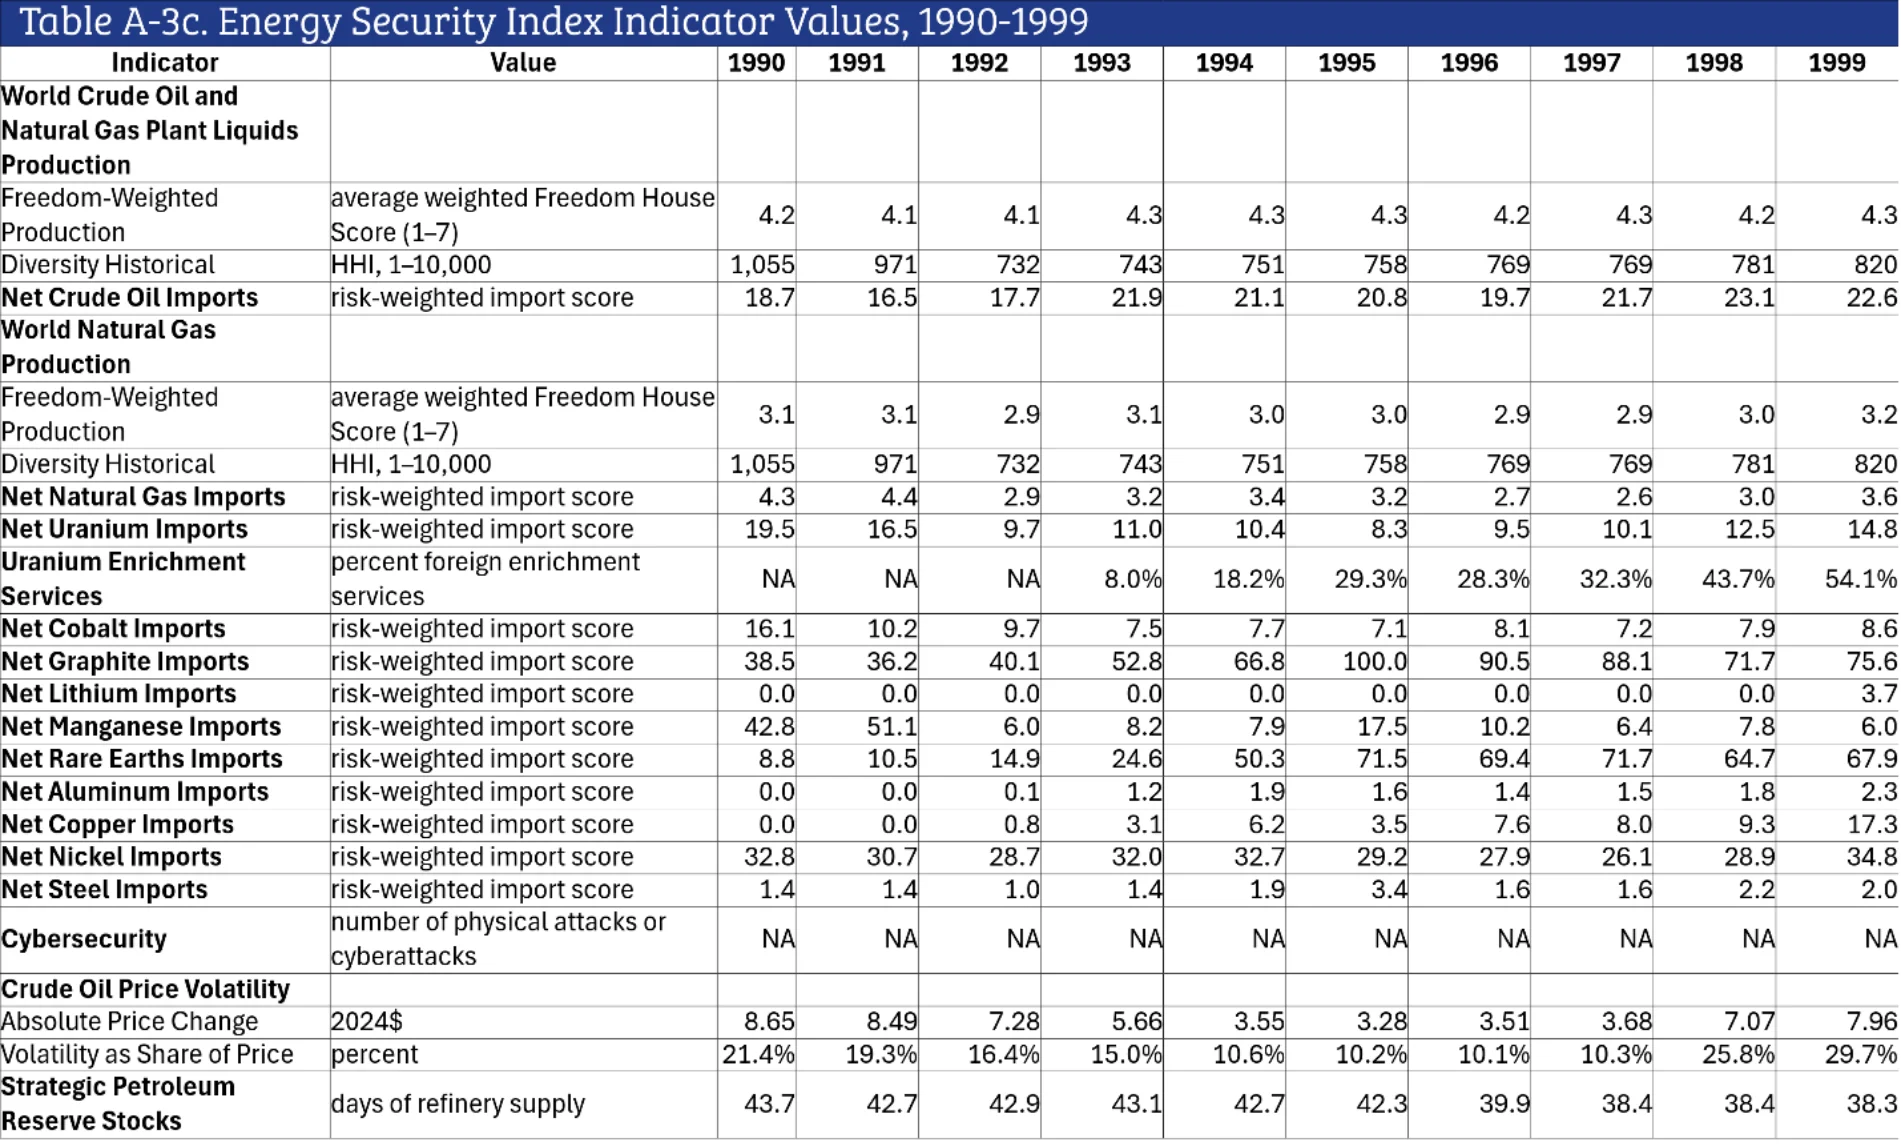
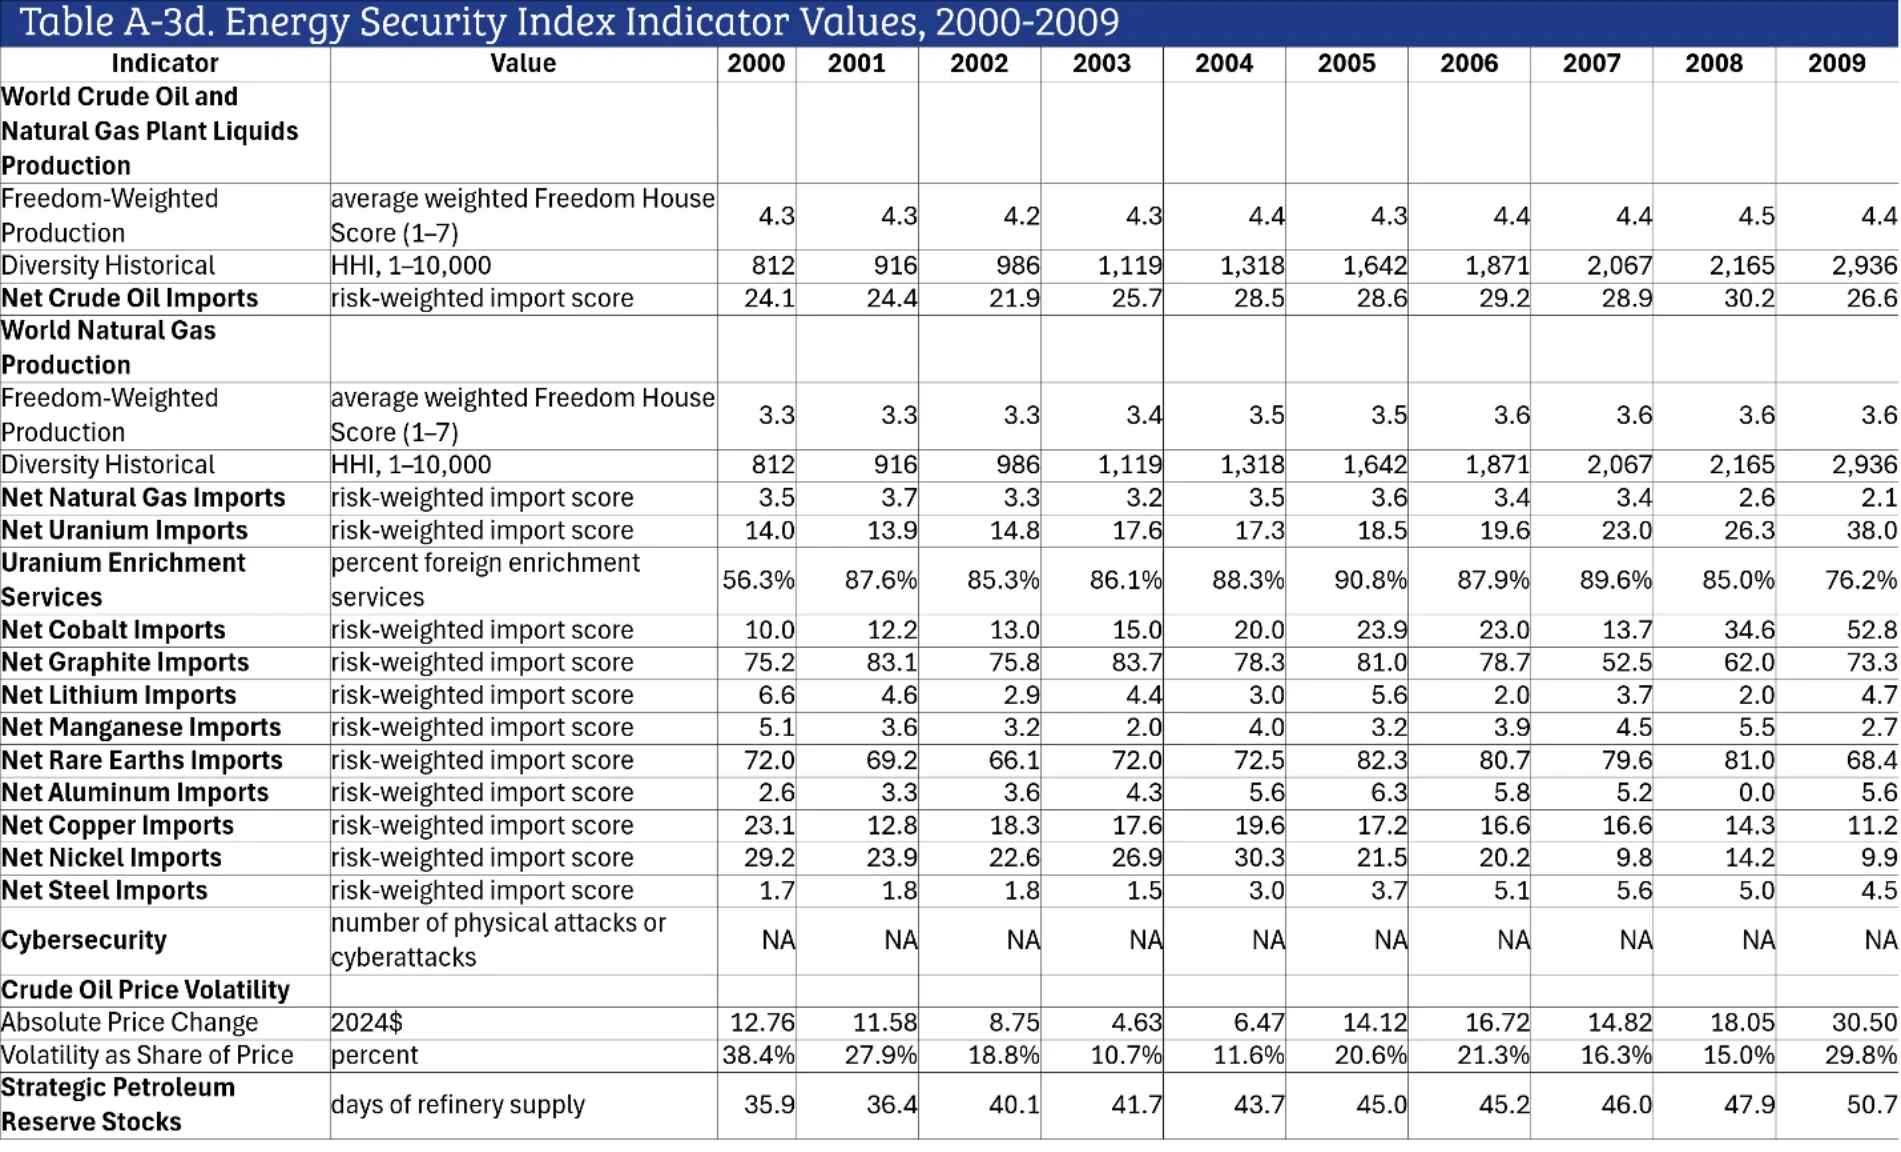
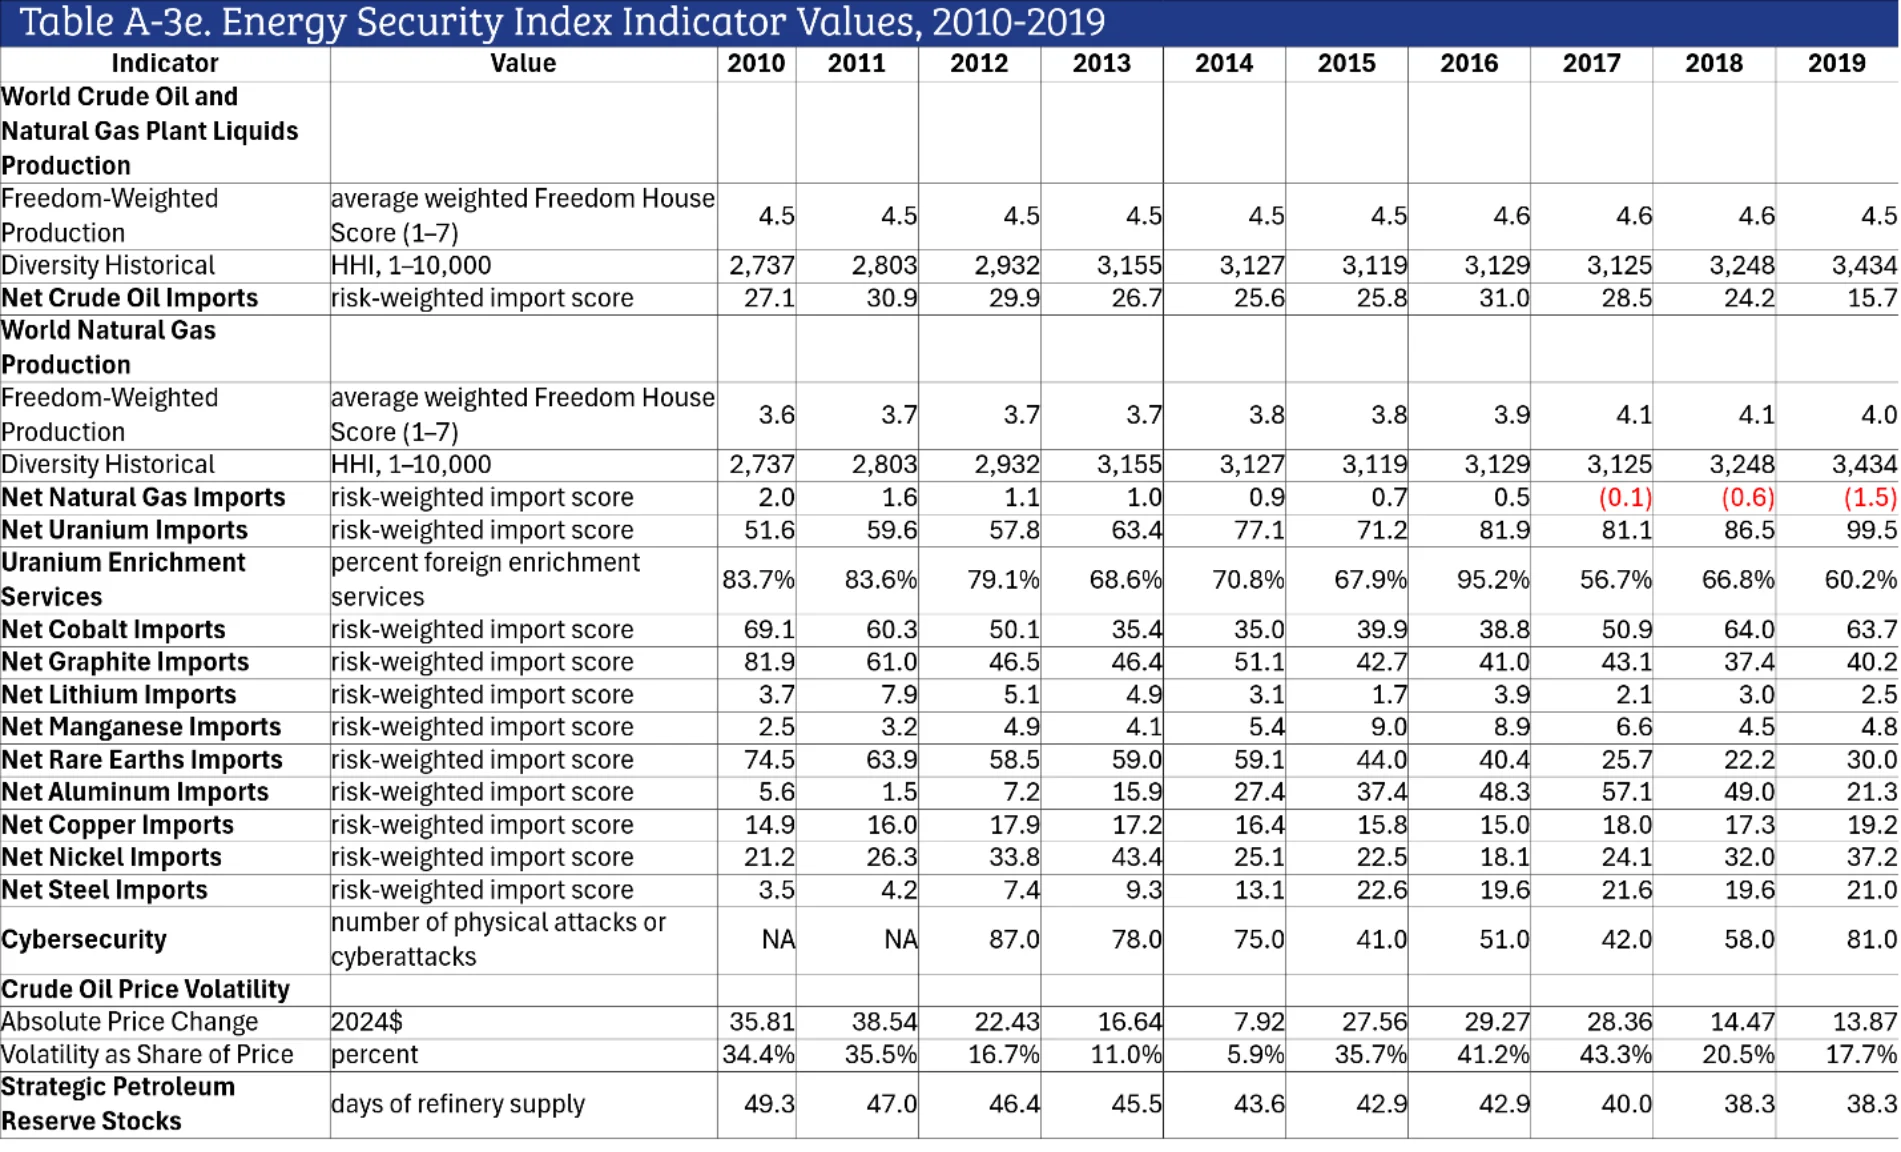
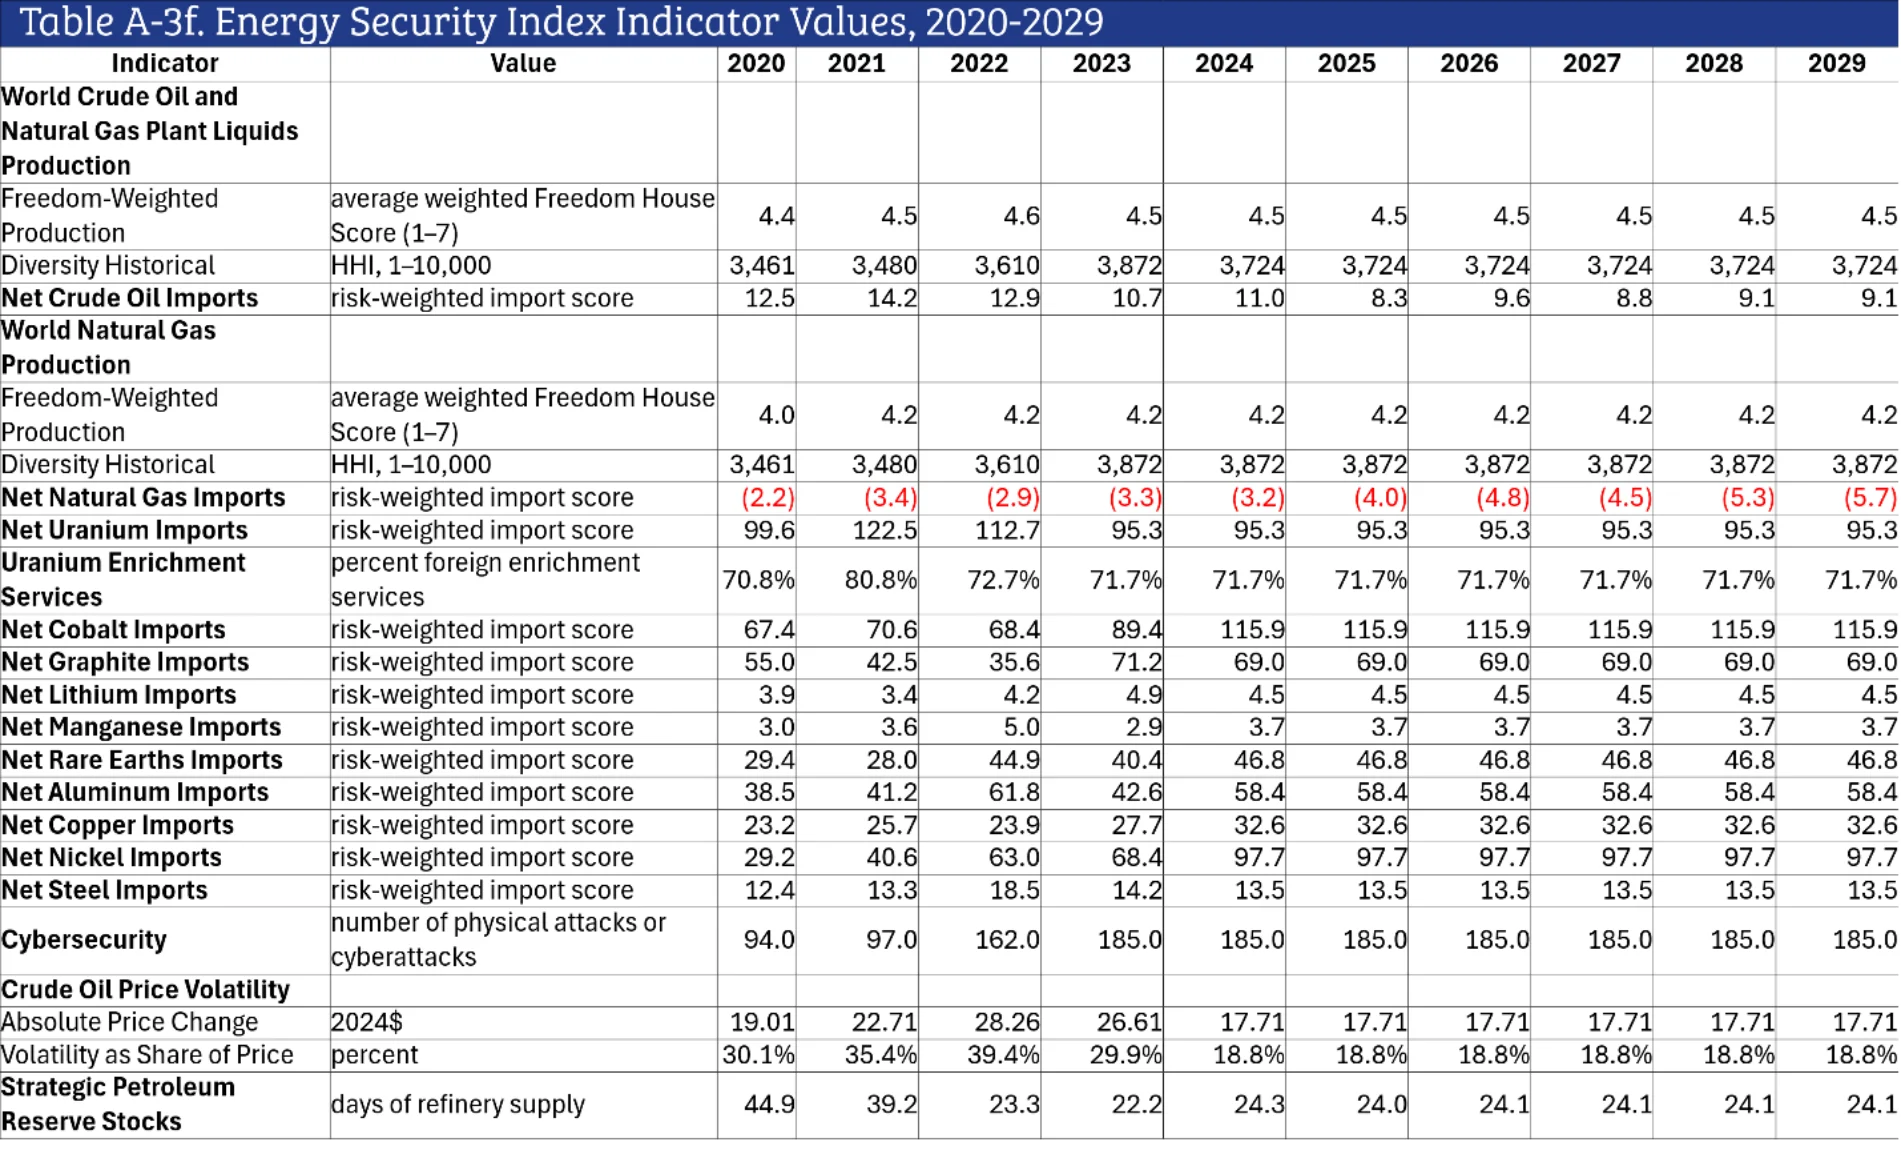
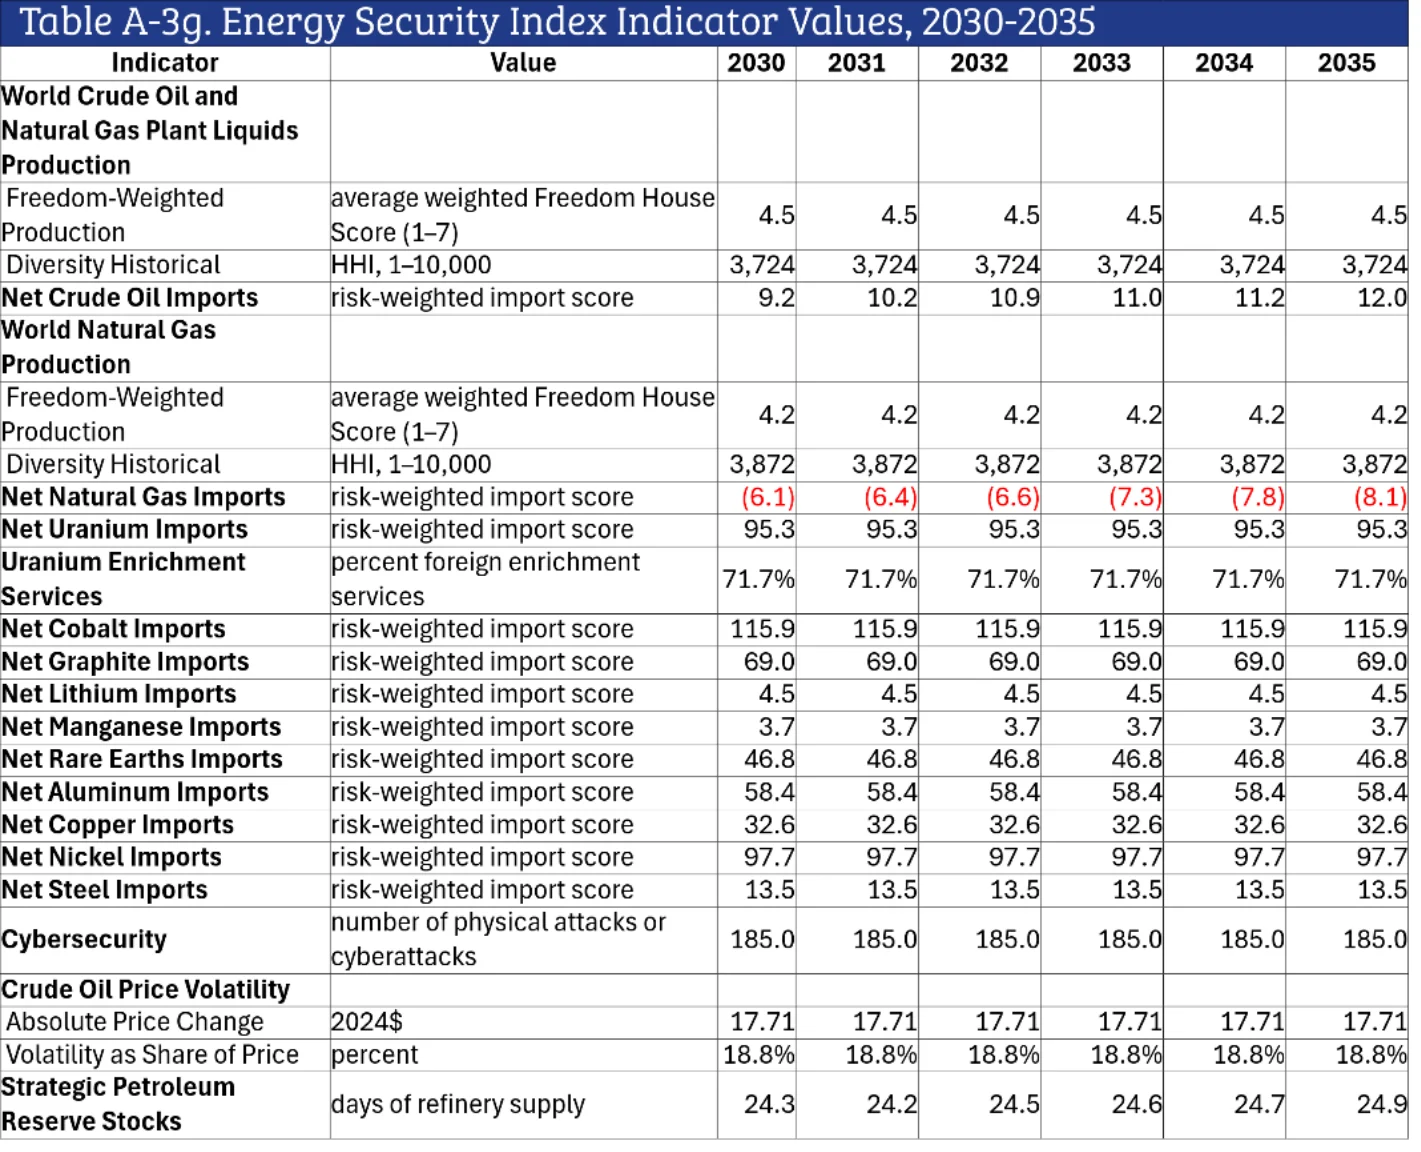
Table A-4. Energy Security Index Normalized Indicator Risk Scores, 1970——2035
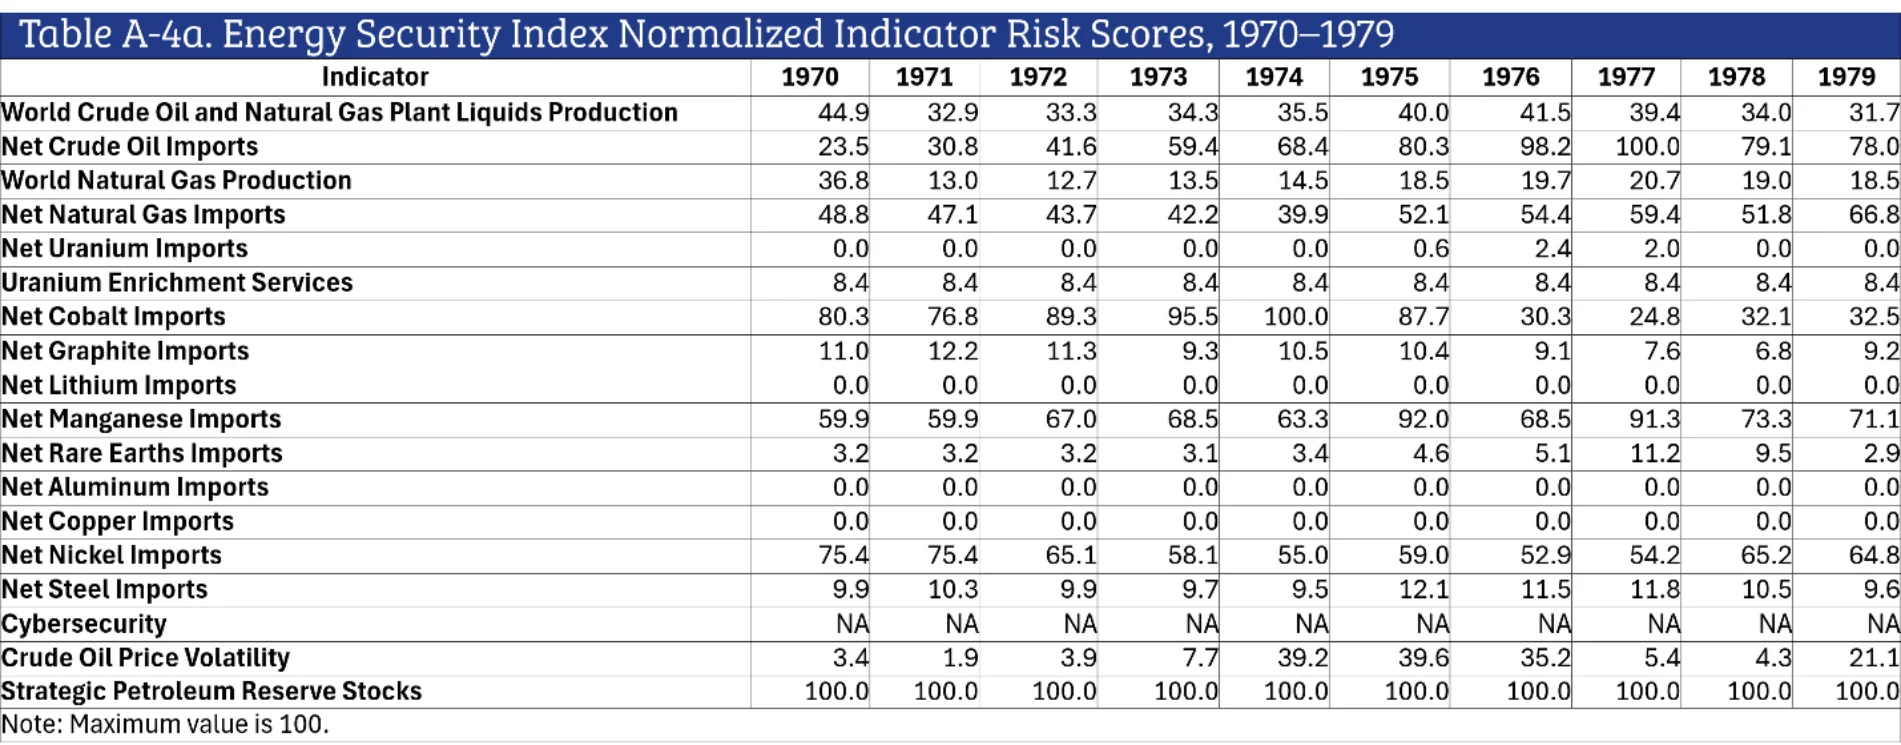
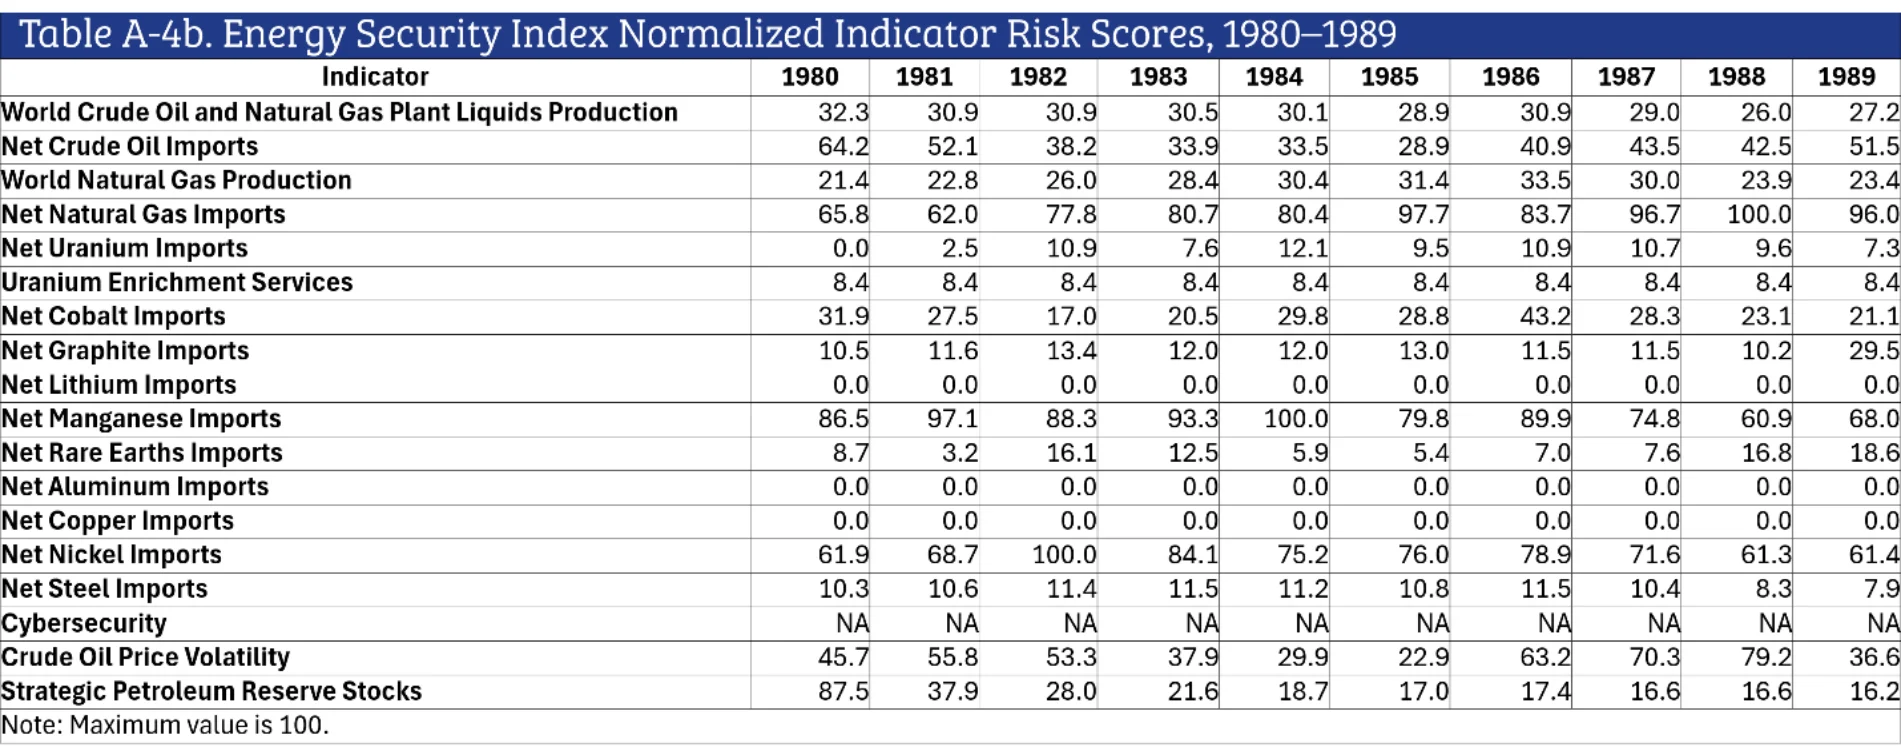
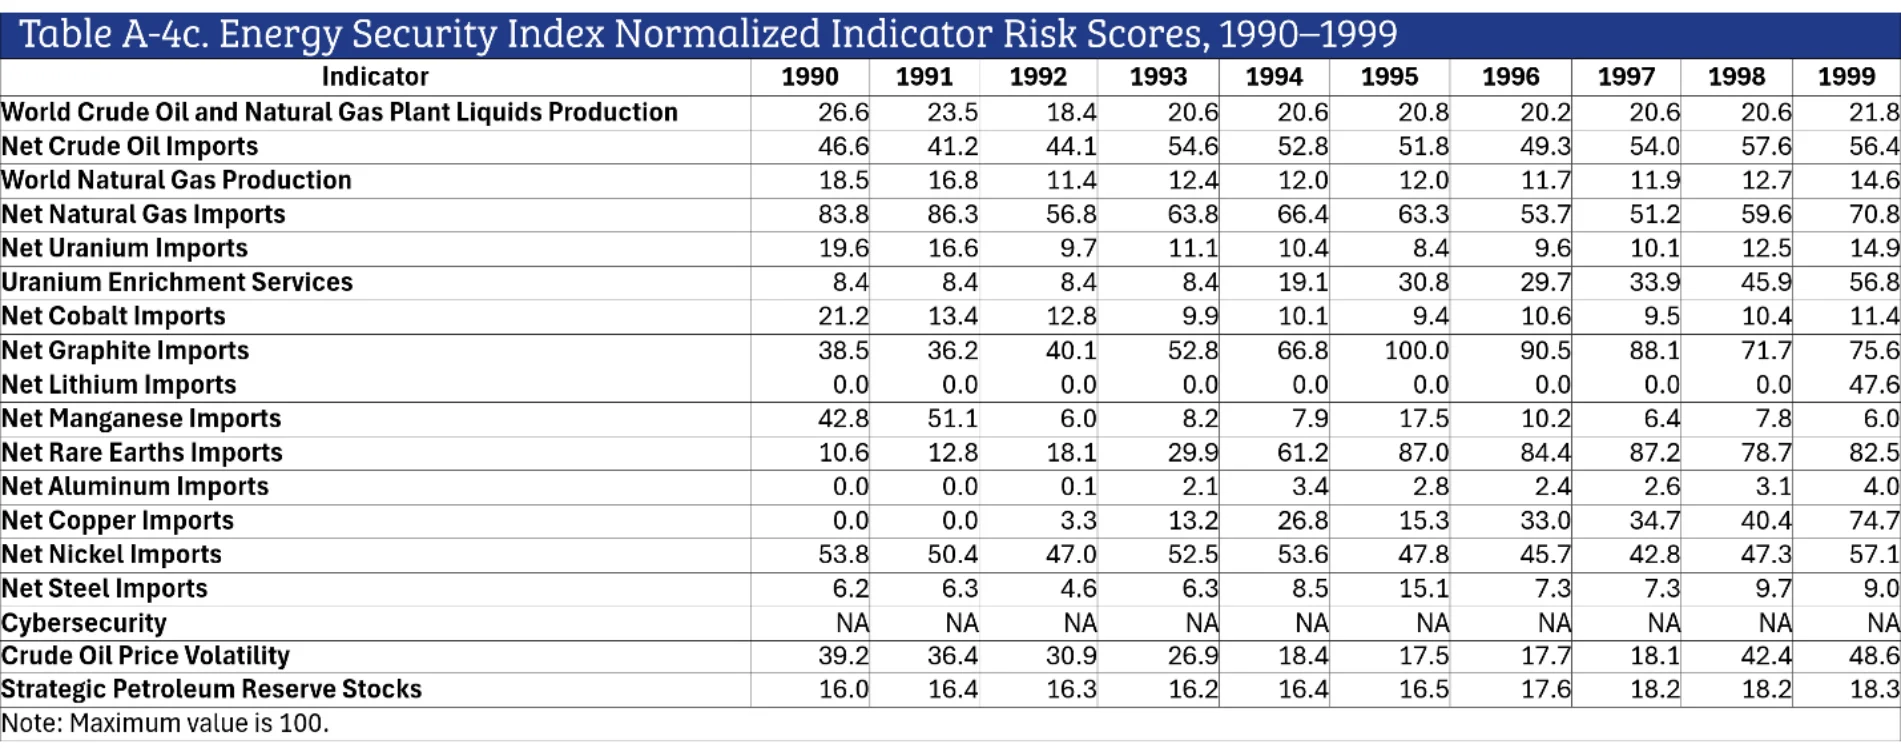
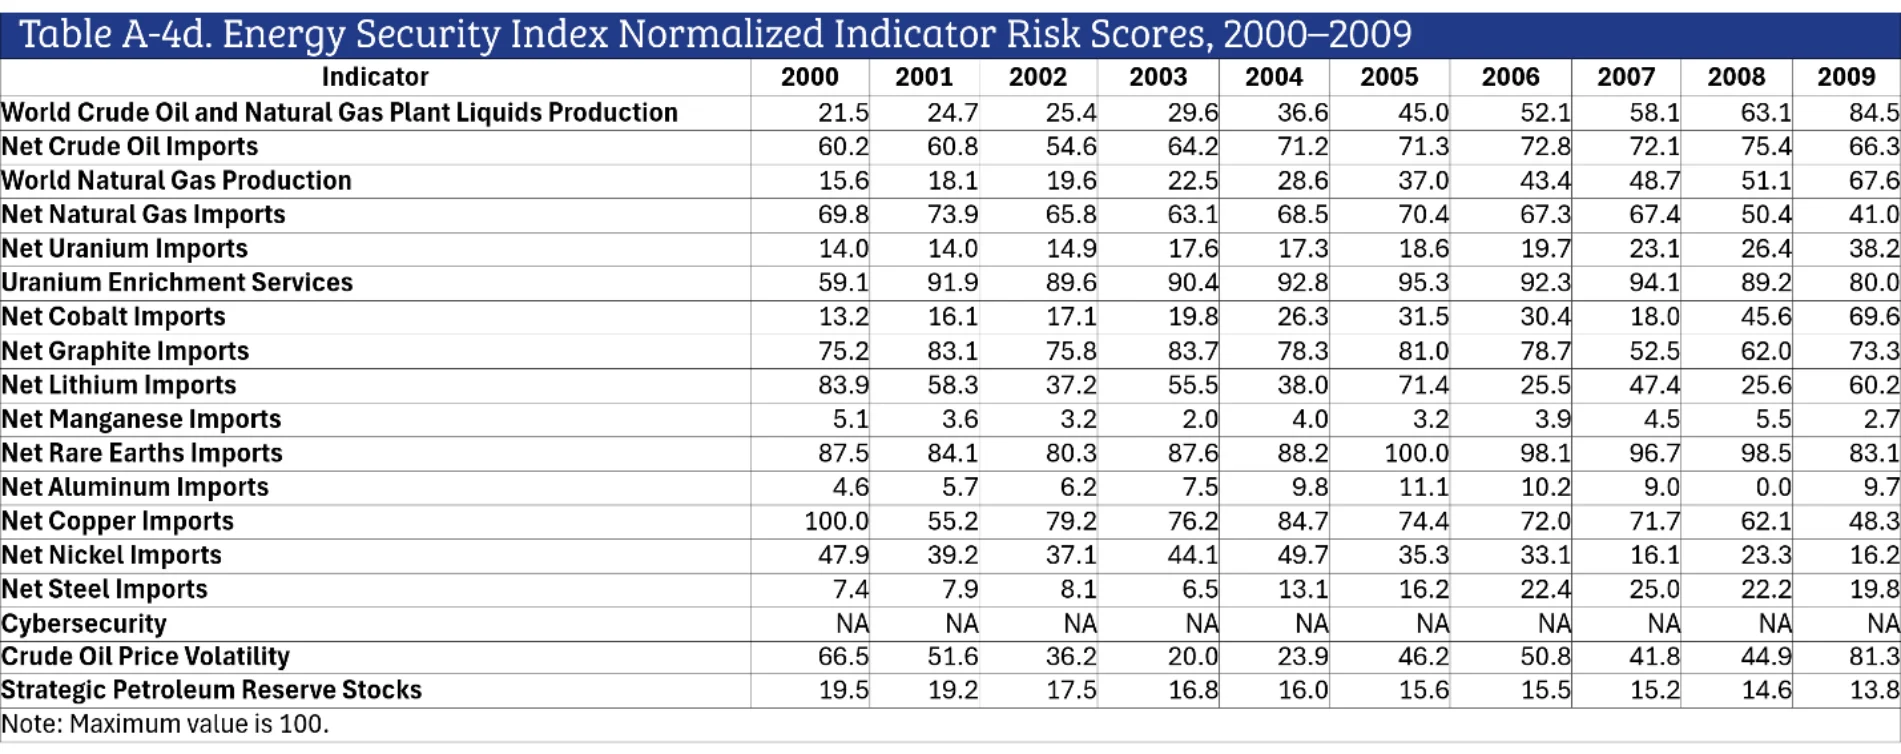
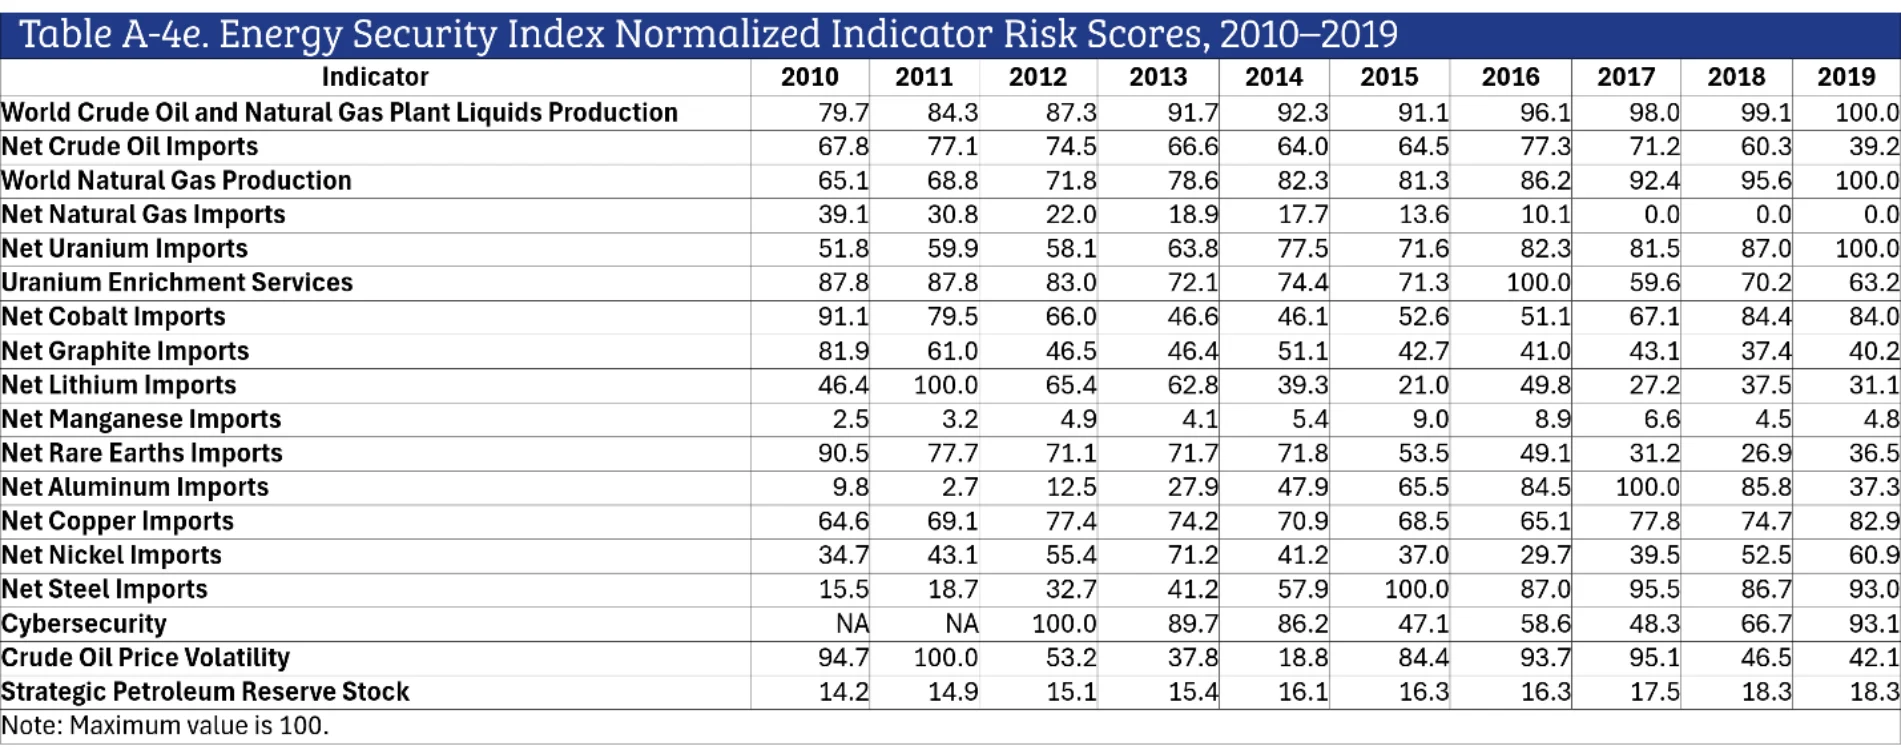
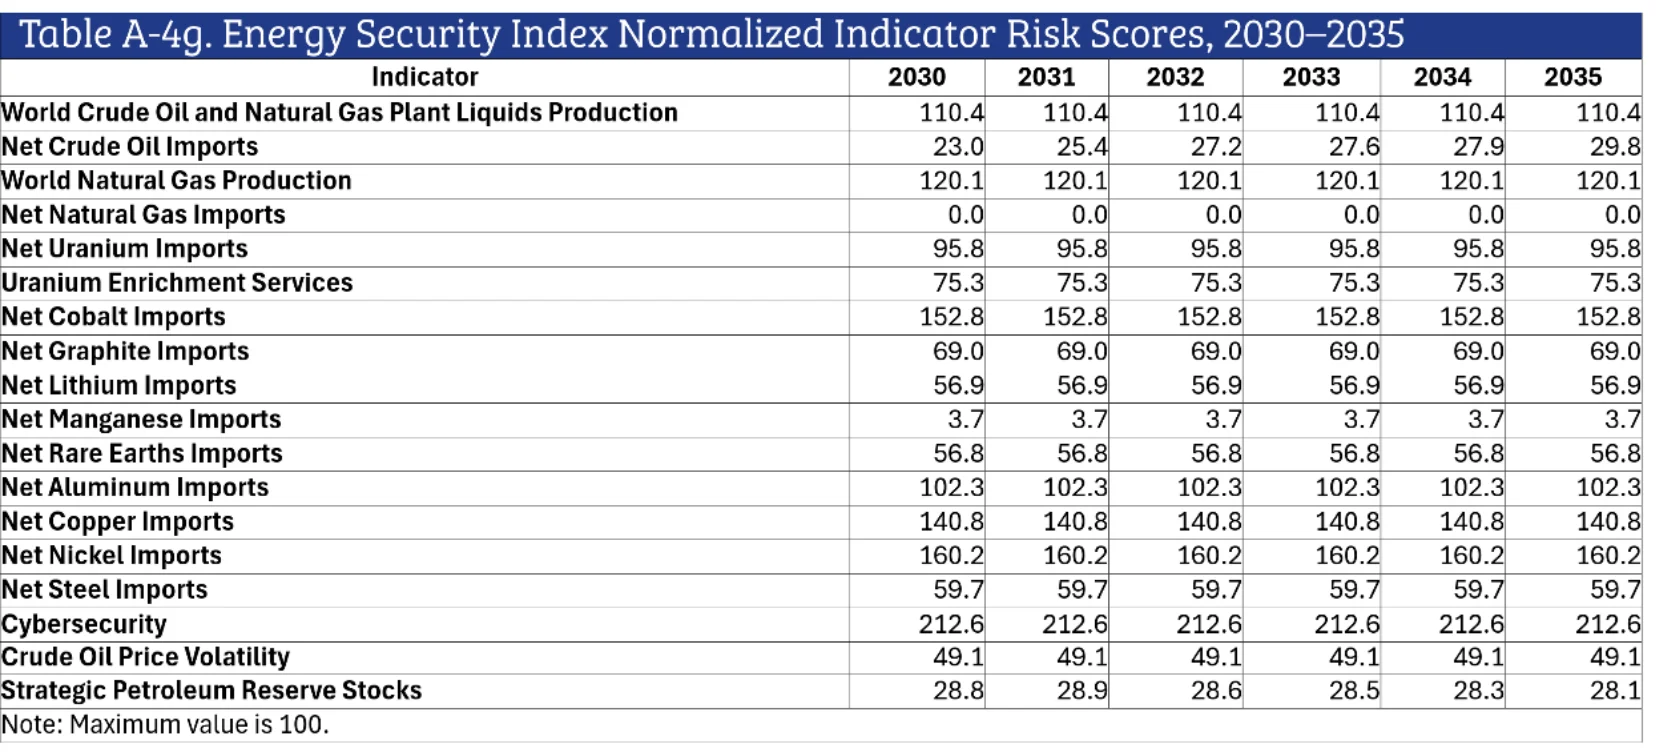
Table A-5. Energy Security Index Indicator Group Weightings, 1970–2035
Data Sources
The following provides a list of the main sources of the data used to compile ESI indicators.
U.S. Energy Information Administration
International Data is a database with historical international crude oil NGPL and natural gas production data. See https://www.eia.gov/international/data/world.
Monthly Energy Review is a series on historical domestic energy production, demand, import, export, refinery inputs, and stocks data, available from https://www.eia.gov/totalenergy/data/monthly.
Petroleum & Other Liquids contains historical crude oil price data. Visit https://www.eia.gov/petroleum/data.php.
Annual Energy Outlook is a report series that forecasts domestic energy production, demand, and refinery inputs data. See https://www.eia.gov/outlooks/aeo.
The Uranium Marketing Annual Report series includes historical data on uranium supplies and imports, available from https://www.eia.gov/uranium/marketing.
U.S. Geological Survey
The Mineral Commodity Summaries series compiles historical international mineral production data and imports data, available from https://www.usgs.gov/centers/national-minerals-information-center/mineral-commodity-summaries.
British Geological Survey
World Mineral Statistics Data includes historical international mineral and uranium production data. See https://www.bgs.ac.uk/mineralsuk/statistics/world-mineral-statistics/world-mineral-statistics-data-download/world-mineral-statistics-data.
Freedom House
Freedom in the World is a series that provides historical data on international political and civil liberties data. Visit https://freedomhouse.org/report/freedom-world.
Contact
For additional information, questions, or comments, use NCEA’s contact form or email NCEAInfo@energyanalytics.org.
Notes
- Coal’s important roles in grid stability, reliability, and affordable electricity will be more apparent in forthcoming components of the Index of Leading Energy Indicators project, which will cover these aspects of the U.S. energy system.
- Crude oil, natural gas plant liquids, and natural gas production and imports.
- Aluminum, copper, steel, and nickel (key minerals common to all energy machinery), as well as cobalt, graphite, lithium, manganese, and rare earths (some of the key minerals used for alternative energy technologies).
- Uranium supplies and enrichment services.
- Cybersecurity, crude oil price volatility, and Strategic Petroleum Reserve crude oil stocks.
- HHI is calculated by taking the market share percentage of each country’s production, squaring that share, and summing those squares across all suppliers. A market with a single supplier would have an HHI score of 10,000. The greater the number of producers, the lower the HHI score.
About the author
Continue Reading




Regional Transmission Organizations: Problem or Solution?
The bulk power system—an interconnected network of generating plants and high-voltage transmission lines—is an often-overlooked part of the electric industry.