Green Energy Mandates and Electricity Affordability
Energy affordability has become an increasingly important issue, withpoliticians in both parties demanding lower-cost energy.
Listen
The Issue
Energy affordability has become an increasingly important issue, with politicians in both parties demanding lower-cost energy. Although all forms of energy are under scrutiny, state-level policy actions are focused on electricity because state regulators directly oversee the rates retail customers pay. New Jersey, for example, commissioned a study on ways to reduce retail electricity rates in the state.1 In New York, Governor Kathy Hochul recently implemented the Protecting Our Wallets Energy Rebate, a $1 billion onetime rebate program to assist New Yorkers with high utility and gasoline prices.2 The Virginia General Assembly has passed several bills to increase funding for energy-efficiency programs.3
But many of the same states demanding greater energy affordability—including New Jersey, New York, and Virginia—have implemented policies to subsidize renewable energy generation that will, it is claimed, reduce greenhouse gas (GHG) emissions and spur economic development. Although specific subsidies differ by state, the key policies that provide subsidies are renewable portfolio standards (RPS) and participation in the Regional Greenhouse Gas Initiative (RGGI). RPS are mandates that require local electric utilities, as well as retail electric suppliers in states allowing direct retail competition, to increase the percentages of electricity supplied to consumers with renewable resources, primarily wind and solar generation.4 RGGI sets a limit on total carbon dioxide emissions from electric generators for the 11 states that participate, including New Jersey and Virginia. Two states, California and Washington, have cap-and-trade programs that establish a decreasing cap on annual carbon emissions and require electric utilities to purchase emissions credits to offset their emissions.5 Although no other states have adopted similar programs, several—including New York—are considering them.
The economics of these policies raises important questions for policymakers. First, have these policies increased electricity costs? And if so, by how much? Second, if these policies are increasing electricity costs, how do they coexist with measures designed to improve energy affordability?6
The Reality
Advocates claim that states’ green energy policies reduce energy costs. For example, many claim that because wind and solar generation are the lowest-cost sources of electricity, policies encouraging the replacement of fossil fuels with wind and solar power are both necessary and beneficial.7 In reality, these policies are taxes on fossil fuels and fossil fuel generation. As basic economics teaches, taxes reduce the output of what is being taxed and always increase market-clearing prices. RPS mandates require electric utilities to purchase credits, in which the costs are then added to customer bills. RGGI requires all fossil fuel generators in the participating states to purchase carbon allowances, which increase the costs of producing electricity and, thus, increase costs to electric consumers. Similarly, California’s and Washington’s cap-and-trade programs force major fossil fuel users (utilities, cement manufacturers, etc.) to purchase carbon credits. These costs are then passed on to consumers through higher prices.
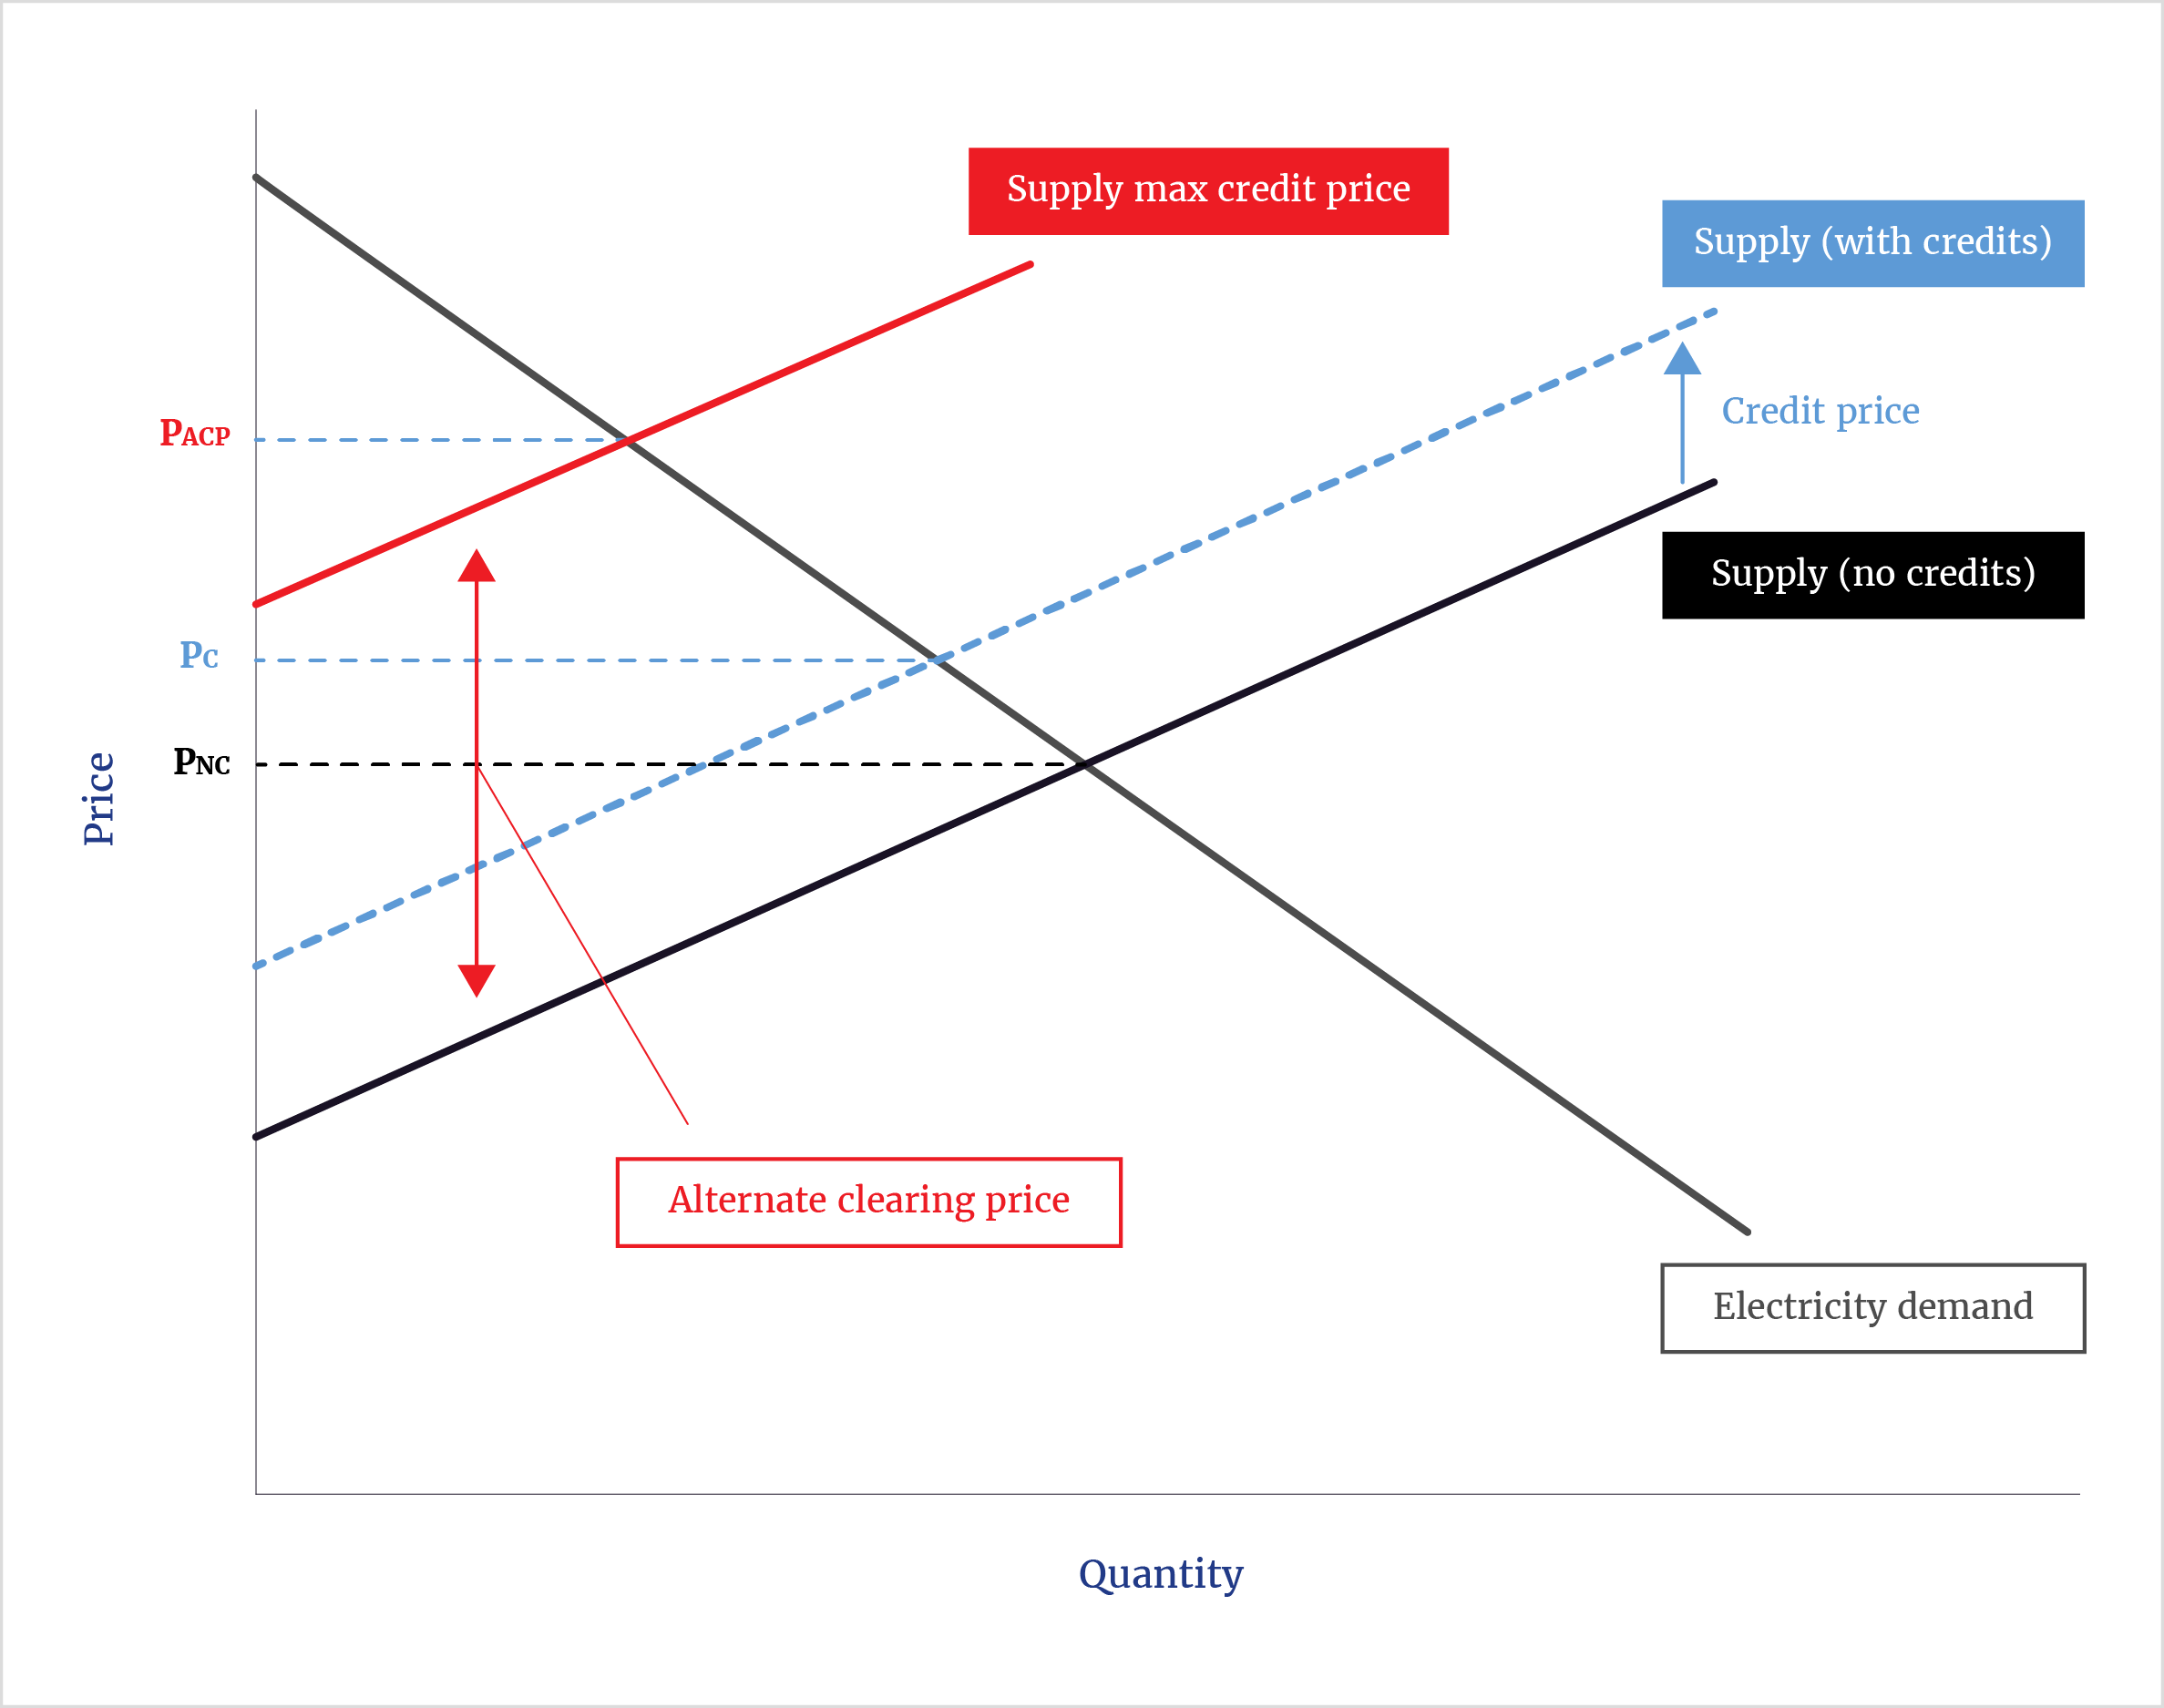
The economic impacts of these programs operate similarly. Because suppliers must purchase various credits, the costs of supplying fossil fuels and products that use fossil fuels as inputs increase. This general mechanism is shown in figure 1. Based on the demand curve and the initial supply (no credits) curve, the resulting pre-credit price is PNC. Requiring suppliers to purchase one credit for each unit of electricity supplied shifts the supply curve upward to the blue dashed line. The new market price increases to PC. If too few credits are supplied, the credit price increases to a constrained maximum called an alternate clearing price. The resulting market price is then PACP.
Figure 1. Impact of Program Mandates on Supply and Market Prices
Source: Author.
One argument for imposing green energy taxes is that they provide an incentive for suppliers to innovate, thereby reducing both emissions and the taxes they must pay. That’s true. However, imposing a tax does not reduce costs enough to drive prices down to pretax levels or lower. The reason is straightforward: If innovation could reduce costs more than taxes increase them, firms would have an incentive to adopt those innovations regardless.8 In other words, there is no free lunch associated with green energy taxes (or any other tax).
Estimating the Direct Costs of Green Energy Policies
The following outlines the direct costs of these different policies, with direct costs referring to the prices paid by consumers. For example, RPS mandates require that electric utilities purchase renewable energy credits (RECs) that are generated by qualifying renewable energy providers, principally wind and solar generators. The utilities then collect the costs of the RECs from their ratepayers.9
RPS Mandates
Twenty-seven states and the District of Columbia impose some type of RPS mandates. All such programs require electricity suppliers—whether electric utilities or retail electric providers in states that allow direct retail competition—to purchase RECs. Although the first program was enacted in Iowa in 1983, most of these mandates were enacted in the mid- to late 1990s. Many states mandate that an overall percentage of total electricity sold to retail customers also be supplied by resources that qualify as renewable, which can include waste coal and even discarded tires.10 Many states also impose additional mandates for specific forms of renewable energy; most commonly, these include solar photovoltaics. In some states, retail electric providers must purchase RECs from in-state providers under the guise of economic development. Such in-state requirements are a form of economic protectionism, which raises costs still further, much as tariffs on foreign-supplied goods raise consumer prices.11
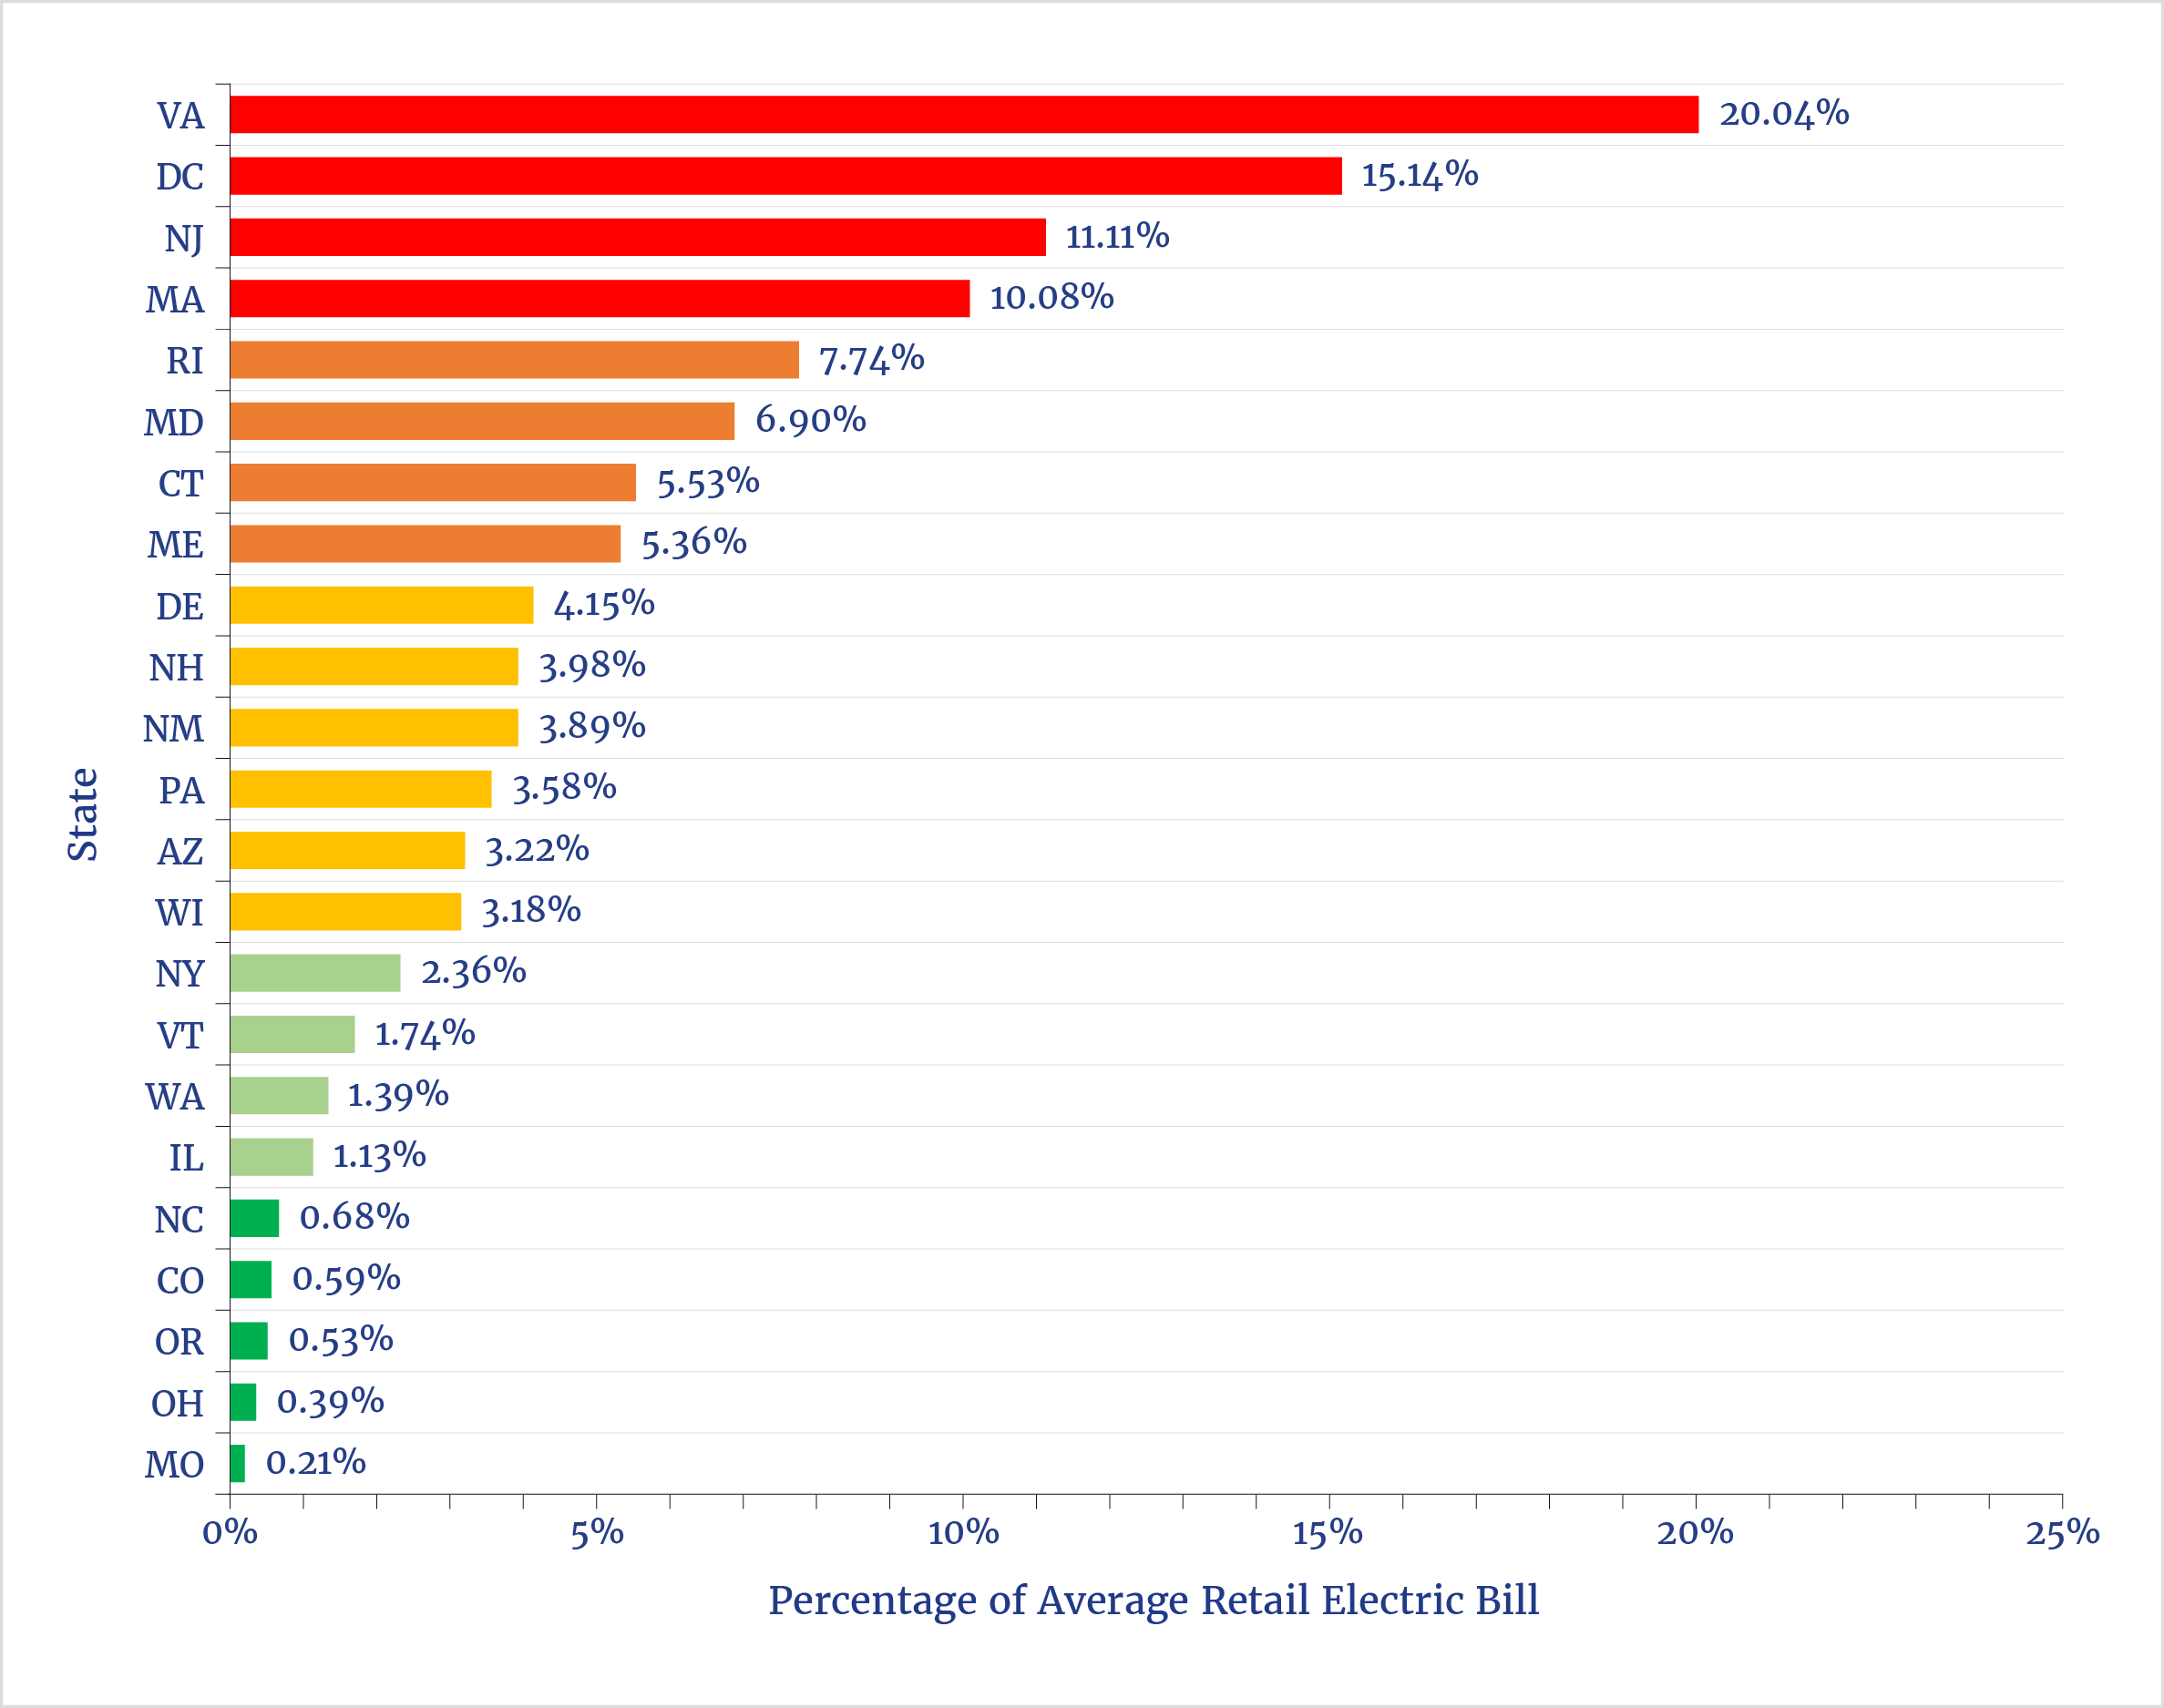
The costs of RPS mandates can be estimated by analyzing total REC purchases by electricity suppliers, which are published by many states’ public utility commissions.12 The most recent percentage costs available for each reporting state are shown in figure 2.13
Figure 2. Cost of Renewable Energy Credits as a Percentage of Average Retail Electric Bills, by Reporting States: 2025
Source: Data from Galen Barbose, “Historical RPS & CES Target Achievement and Compliance Costs,” in U.S. State Electricity Resource Standards: 2026 Data Update (Lawrence Berkeley National Laboratory, 2026).
As figure 2 shows, REC costs accounted for 20% of average retail electric bills in Virginia and 15% in the District of Columbia. In New Jersey and Massachusetts, RECs add about 11% and 10%, respectively, to retail electric bills. Using retail revenue data published by the U.S. Energy Information Administration, these percentages can be converted to total estimated expenditures on RECs for these same states (see figure 3). These costs are net values; in other words, they represent costs that would not otherwise have been paid by electric ratepayers in the absence of RPS mandates.14
Figure 3. REC Cost Totals, by State: 2020–25

Sources: Data from Galen Barbose, “Historical RPS & CES Target Achievement and Compliance Costs,” in U.S. State Electricity Resource Standards: 2026 Data Update (Lawrence Berkeley National Laboratory, 2026); and “Electricity Data Browser,” U.S. Energy Information Administration, accessed October 14, 2026, https://www.eia.gov/electricity/data/browser. Author’s calculations.
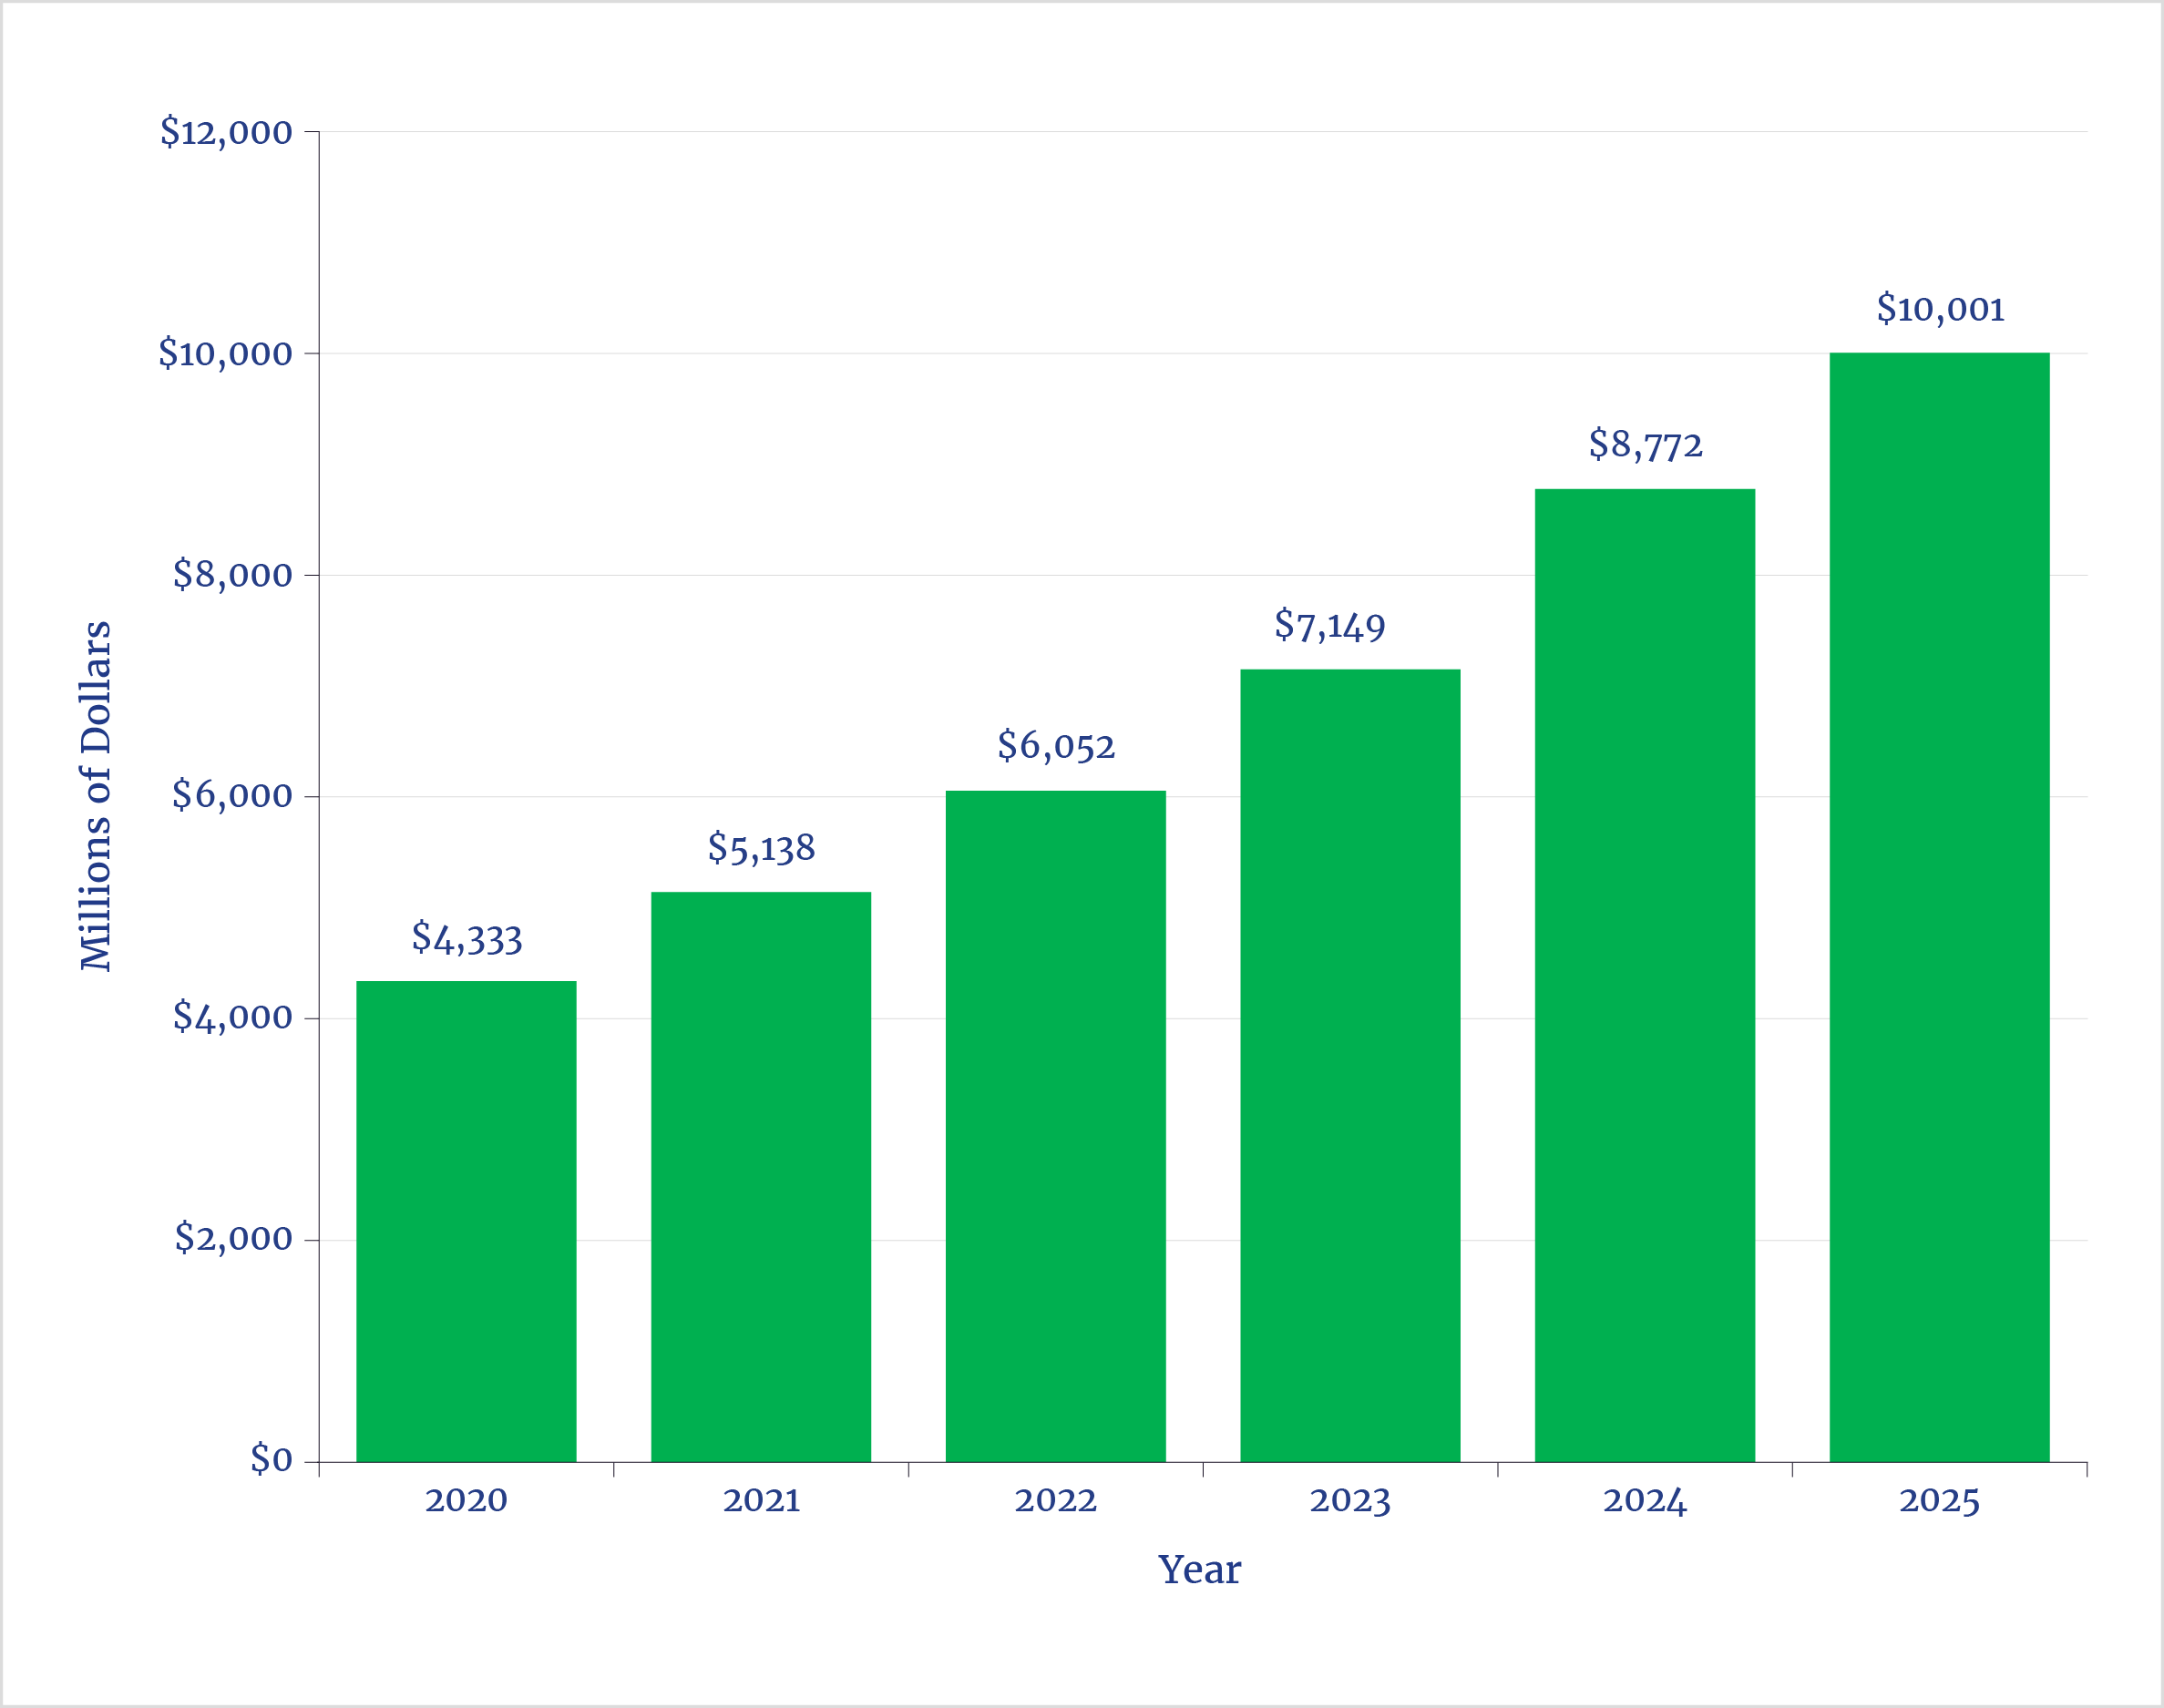
From 2020 to 2025, Massachusetts electric customers paid over $7.1 billion for RECs, while New Jersey and Virginia retail electric customers paid more than $6.6 billion and $6.3 billion, respectively (see figure 3). Customers in Maryland and New York each paid nearly $3 billion, while Pennsylvania consumers paid almost $2.7 billion. In total, over this six-year period, retail customers paid over $41 billion for RECs. In 2025 alone, electric customers paid over $10 billion more for electricity because of RECs (see figure 4).
Figure 4. U.S. Annual REC Costs: 2020–25
Sources: Data from Galen Barbose, “Historical RPS & CES Target Achievement and Compliance Costs,” in U.S. State Electricity Resource Standards: 2026 Data Update (Lawrence Berkeley National Laboratory, 2026). Author’s calculations.
RGGI
First established in 2005 among seven New England and mid-Atlantic states, RGGI is designed to cap GHG emissions from fossil fuel electric generators. The participating states agree to overall annual caps on GHG emissions, principally CO2. All electric generating plants with capacities of 25 megawatts or greater are subject to the program. Eleven eastern states currently participate in RGGI; Virginia rejoined in 2026 after withdrawing in 2023. Pennsylvania previously joined RGGI, but the state’s Commonwealth Court found that participation unconstitutional.
The regional emissions caps decrease each year based on program reviews.15 The auction prices are capped by a cost containment reserve (CCR), which limits market prices growth by increasing the supply of allowances.16 For example, the CCR trigger price in 2026 is $18.22/ton, increasing to $19.50/ton in 2027, then by 7% annually thereafter.17 The allowance cap also decreases each year. In 2027, the cap will be just under 70 million tons of CO2, decreasing to just under 44 million tons in 2030 and just over 11 million tons in 2036.
In 2025, the average auction clearing price was just under $22/ton.18 The March 2026 auction clearing price was $24.99/ton, and the market-clearing price in the June 2026 auction was $35/ton.19 From 2020 and through the first two auctions of 2026, fossil fuel generators paid more than $9.2 billion for allowances. The total costs paid by generators in each state ranged from $0.3 million in Vermont to over $3.0 billion in New York (see figure 5).20
Figure 5. Regional Greenhouse Gas Initiative Allowance Costs Paid by Generators, by State: January 2020–June 2026

Sources: Data from “RGGI CO2 Allowance Tracking System,” Regional Greenhouse Gas Initiative (RGGI), accessed October 15, 2026, https://rggi-coats.org; and “Auction Results,” RGGI, accessed October 15, 2026, https://www.rggi.org/auctions/auction-results.
Estimating the impacts on retail electric rates is difficult because the RGGI states, except Virginia and Vermont, allow retail competition.21 Thus, generators in the RGGI states either have bilateral agreements with local distribution utilities and retail electric providers or sell their generation into the New England, New York, and PJM Interconnection wholesale markets.
As shown in figure 1, requiring generators to purchase allowances raises the operating costs of fossil fuel generators and, thus, raises wholesale market-clearing prices. However, because electricity demand is highly inelastic in the short term—that is, higher prices result in only small changes in consumption—most of the increases in wholesale market prices are ultimately paid by retail electric customers. Moreover, as many of these same RGGI states pursue electrification—such as mandating increasing sales of electric vehicles and replacing fossil fuel space and water heat with electric heat pumps—the RGGI cost impacts will increase gradually, especially as the allowance caps decrease.
Cap-and-Trade Programs
Two states, California and Washington, have carbon cap-and-trade programs that began in 2014 and 2023, respectively. Both are referred to as cap-and-invest, a misleading label because their state legislatures determine how the collected revenues are spent. Oregon’s Climate Protection Program is similar,22 but it limits direct trading of emissions credits.
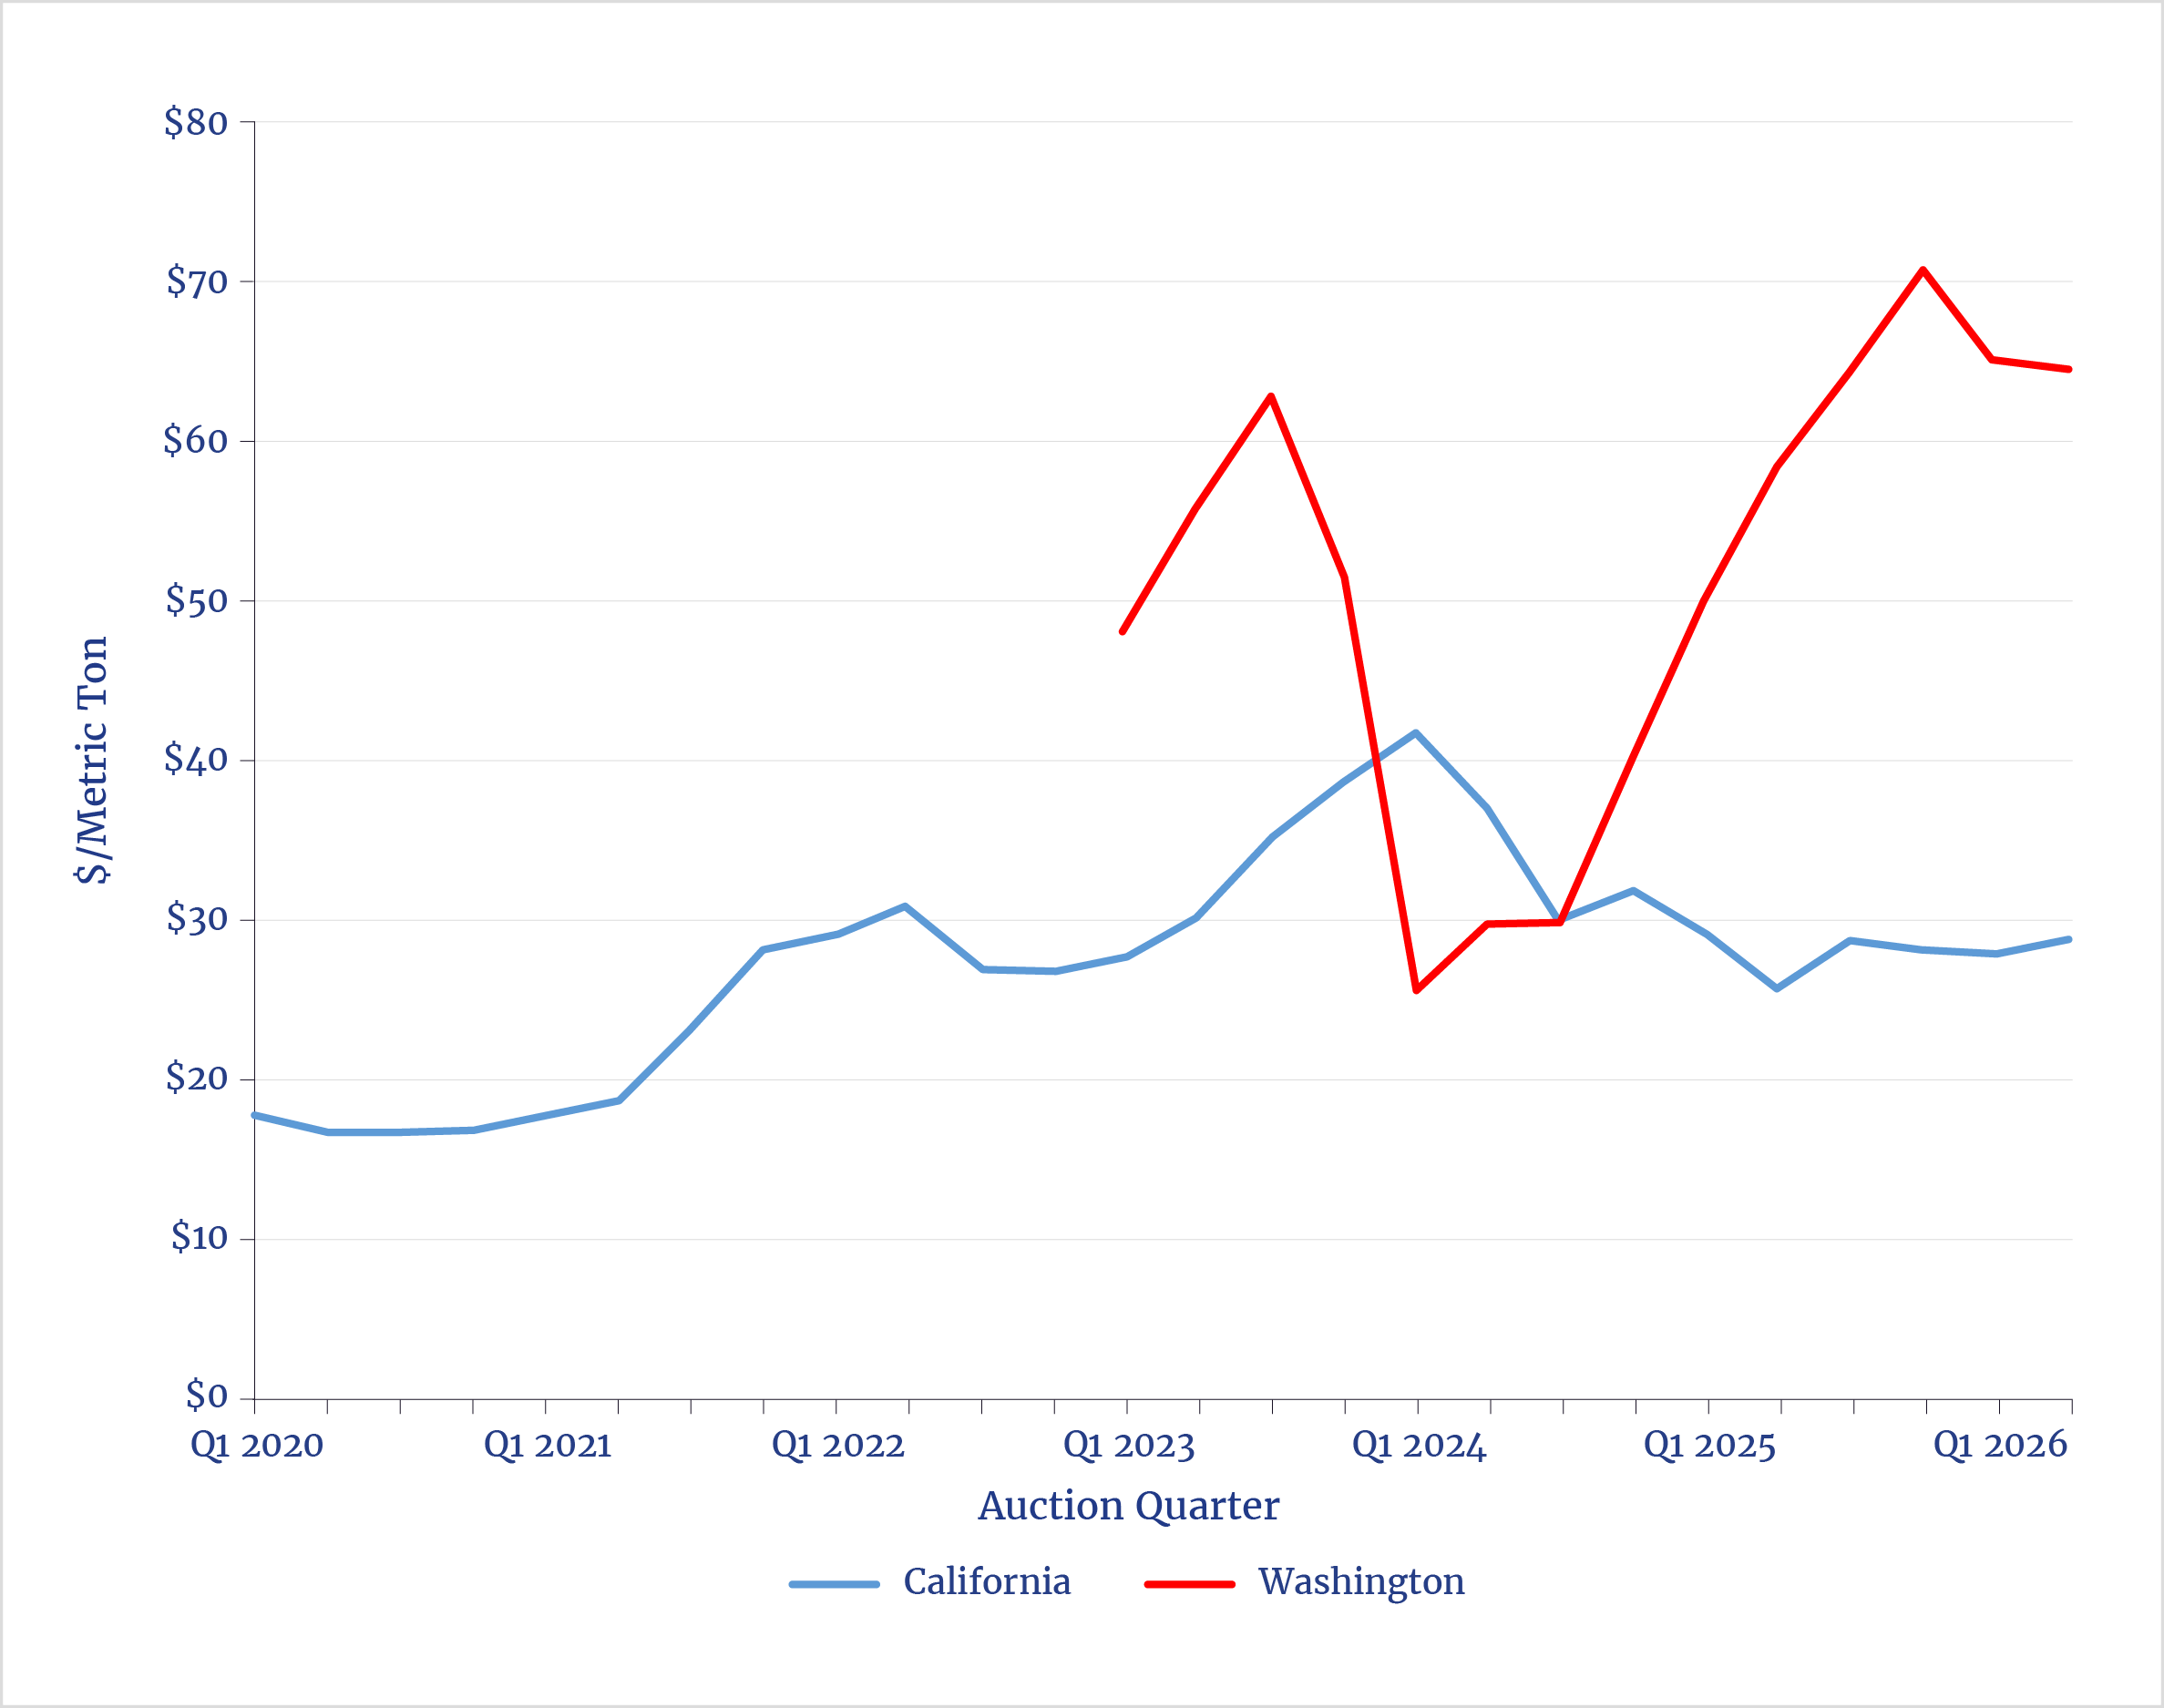
Under these programs, total allowable carbon emissions for major emitters—electric generating plants, natural gas utilities, petroleum refineries, and large industrial emitters, such as cement manufacturing—decrease over time. Nonutility fossil fuel suppliers must also purchase allowances. The overall caps decrease to meet California’s and Washington’s goals of 85% reductions in GHG emissions below 1990 levels by 2045 and 90% below 1990 levels by 2050, respectively.23 Allowances are bought and sold in auctions to determine their market price.24 In California, prices had climbed from just under $20/metric ton in 2020 to about $29/metric ton in the May 2026 auction (see figure 6). Allowance prices in Washington were far higher, at about $65/metric ton in that state’s June 2026 auction.
To reduce the impacts on electric and natural gas utility customers, both states allocate free carbon allowances (one allowance equals one metric ton of CO2).25 Large industrial sources and natural gas utilities are allocated decreasing quantities of allowances over time to assist them with the transition to zero emissions. In California, electric utilities are allocated allowances based on forecast demand and other factors, and they do not necessarily decrease over time.26 In contrast, fuel suppliers are not allocated any allowances.
A key difference between the cap-and-trade and California’s Low Carbon Fuel Standard program is that all allowances are issued by the states themselves rather than created by entities such as electric vehicle manufacturers, biodiesel providers, and so forth.
Figure 6. Cap-and-Trade Allowance Prices: 2020–June 2026
Sources: “Cap-and-Trade Program Data Dashboard,” California Air Resources Board, accessed October 21, 2026, https://ww2.arb.ca.gov/our-work/programs/cap-and-trade-program/program-data/cap-and-trade-program-data-dashboard; and “Cap-and-Invest Auctions and Markets,” State of Washington Department of Ecology, accessed October 21, 2026, https://ecology.wa.gov/air-climate/climate-commitment-act/cap-and-invest/auctions-and-market.
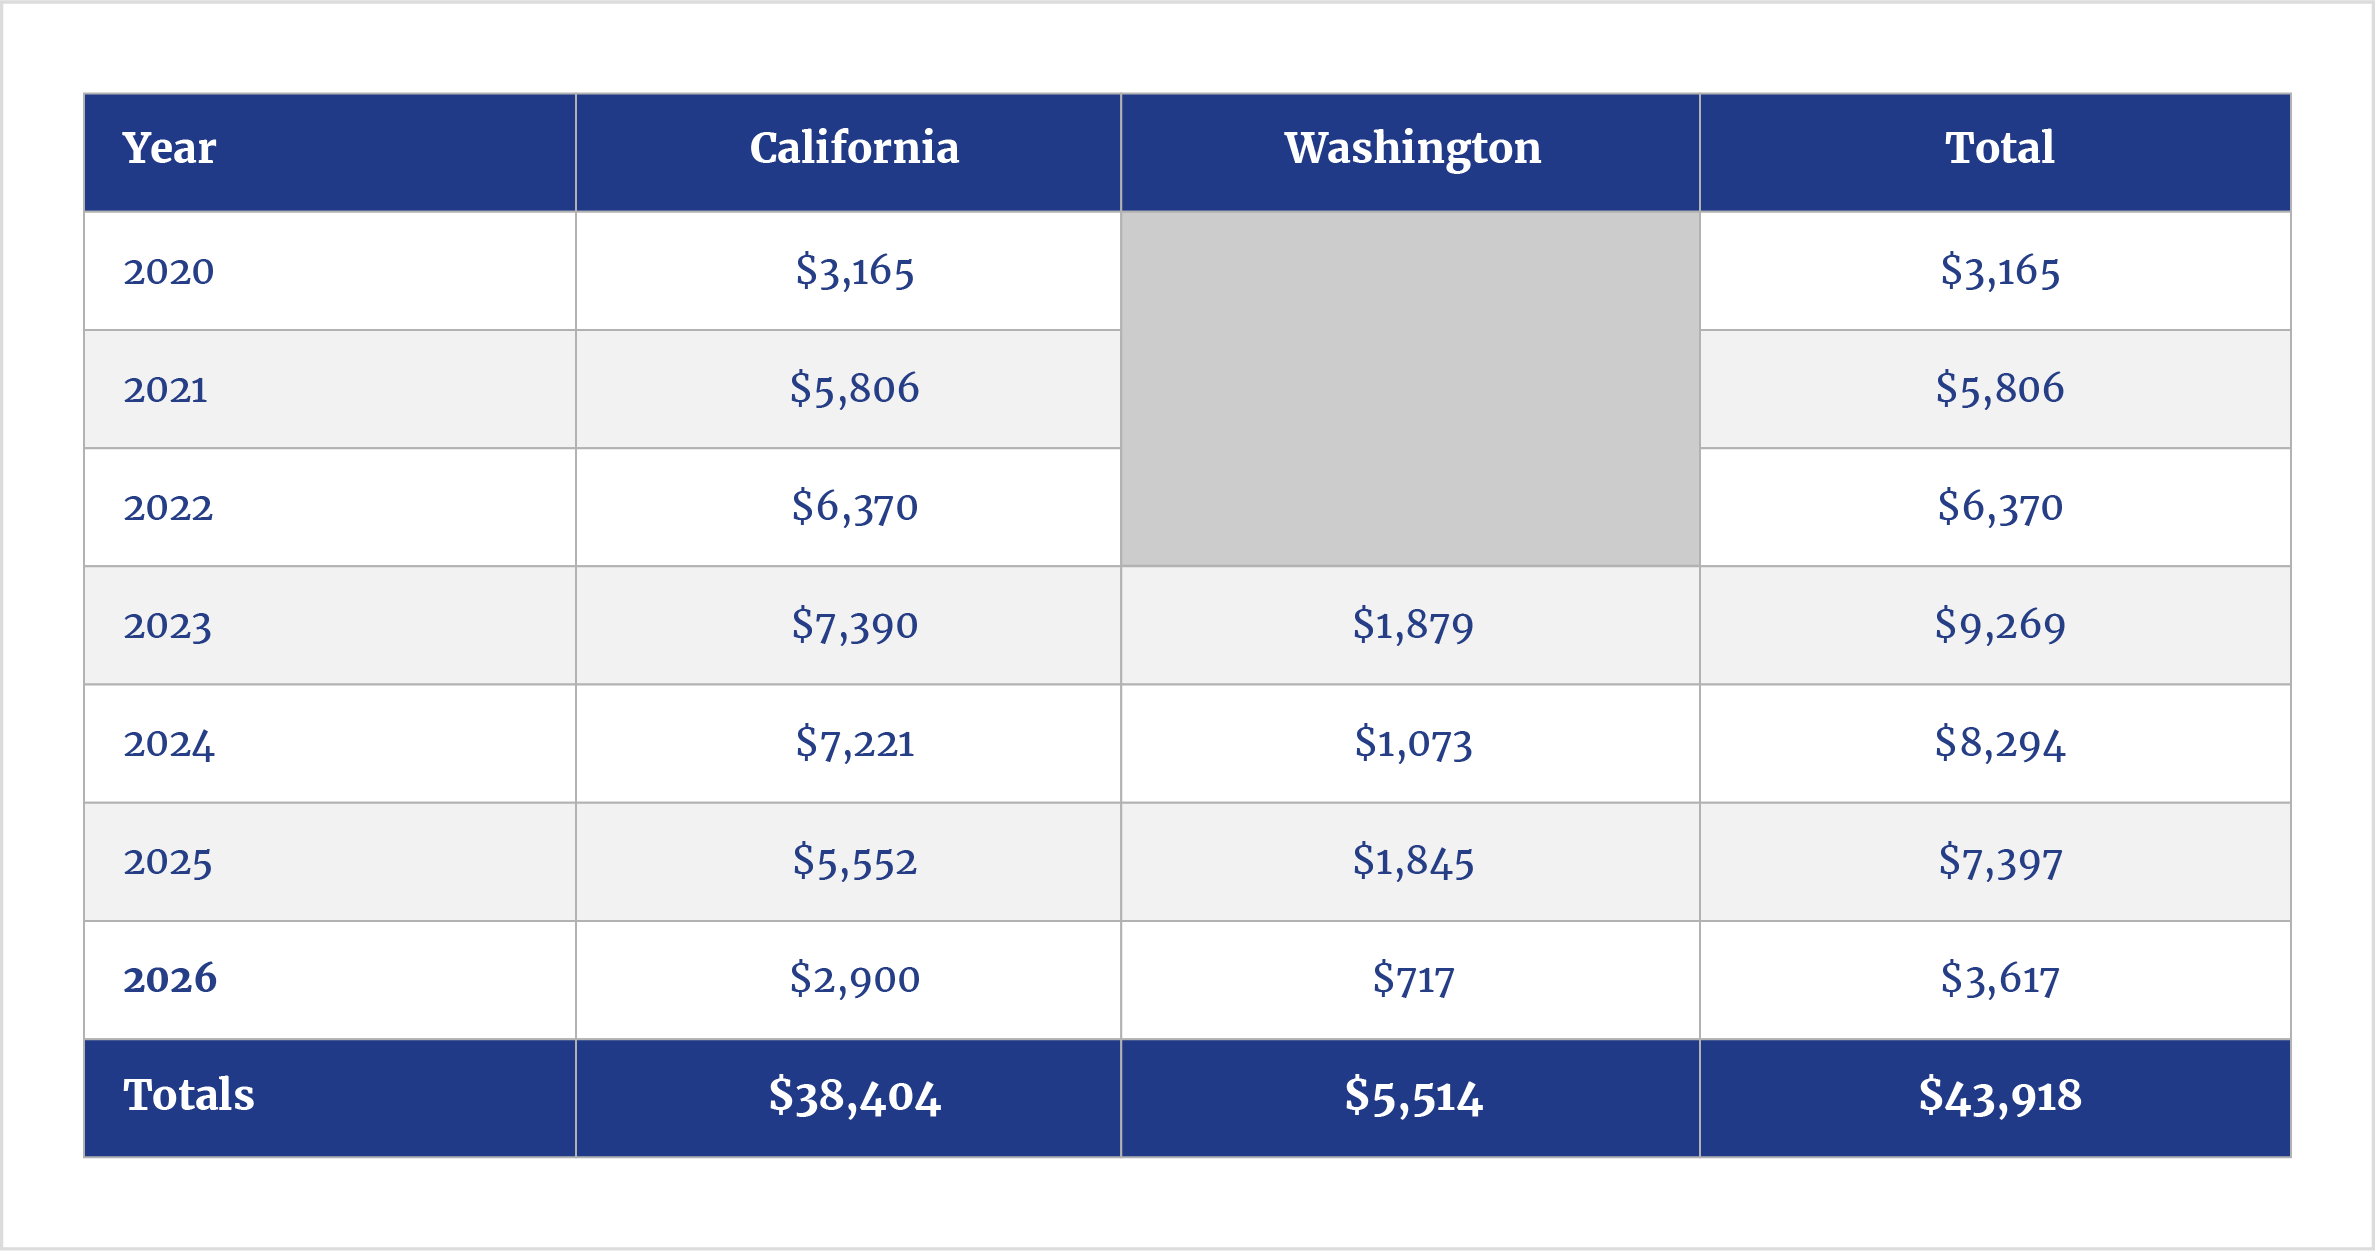
Between 2020 and the first half of 2026, auction revenues totaled $38.4 billion in California and about $5.5 billion in Washington, or just under $44 billion (see table 1). The money raised by the auctions is then allocated by the respective state legislatures. For example, one-fourth of the money raised in California has been spent on that state’s ill-fated high-speed rail project.27
Table 1. Cap-and-Trade Program Revenues: 2020–June 2026 (Millions of Dollars)
Sources: Data from “Auction Notices and Reports,” California Air Resources Board (CARB), accessed October 26, 2026, https://ww2.arb.ca.gov/our-work/programs/cap-and-trade-program/auction-information/auction-notices-and-reports; CARB, Summary of California-Quebec Joint Auction Settlement Prices and Results (CARB, 2026), 1–2; Washington State Department of Ecology, Auction #4 December 2023 Public Proceeds Report, Publication No. 24-14-005 (Washington State Department of Ecology, 2024), 2; Washington State Department of Ecology, Auction #8 December 2024 Public Proceeds Report, Publication No. 24-14-064 (Washington State Department of Ecology, 2024), 3; Washington State Department of Ecology, Auction #12 December 2025 Public Proceeds Report, Publication No. 25-14-084 (Washington State Department of Ecology, 2025), 3; and Washington State Department of Ecology, Auction #14 June 2026 Public Proceeds Report, Publication No. 26-14-040 (Washington State Department of Ecology, 2026), 3. Author’s calculations.
Perspective
Higher electricity costs reduce the affordability of virtually every other good and service in the economy. Yet while the same states complain about rising electricity bills, it is the states’ own green energy policies that are the crux of the energy affordability problem.
If state governments are truly concerned about the affordability of electricity, they should eliminate their RPS mandates and their participation in RGGI. Similarly, the cap-and-trade programs in California and Washington simply function as a convenient way for those states’ respective legislatures to tax fossil fuel users and distribute the monies to their pet projects. These policies have no measurable impact on global climate and are not needed to improve energy security.
- Kush Patel et al., Modernizing New Jersey’s Electric Utility Business Model (Energy & Environmental Economics, 2026).
- Office of Governor Kathy Hochul, New York State, “Governor Hochul Announces Energy Affordability Package to Help New Yorkers Struggling with High Utility Costs and Soaring Gas Prices at the Pump,” news release, May 26, 2026.
- Anna Johnson and Mary Robert Carter, “Virginia Ramps Up Efficiency Efforts to Address Energy Affordability Challenges,” American Council for an Energy-Efficient Economy, April 9, 2026.
- Many states have also adopted clean energy or zero-emissions electricity standards, which are often combined with renewable portfolio standards (RPS) requirements.
- Twenty-four states, plus the District of Columbia, have longer-term clean energy standards that require electric utilities to meet increasing percentages of total supplies with carbon-free electricity. See “Table of 100% Clean Energy States,” Clean Energy States Alliance, accessed October 15, 2026, https://www.cesa.org/projects/100-clean-energy-collaborative/guide/table-of-100-clean-energy-states. Vermont and New York have enacted climate superfund laws that retroactively charge large oil companies for claimed damages caused by those companies’ fossil fuel production; other states have proposed such legislation. These laws are being challenged. However, if they survive legal scrutiny, they, too, will increase energy costs. See Rachel Rothschild, “State Climate Superfunds,” Columbia Law Review 126, no. 4 (May 2026): 586–670.
- A third question is whether the claimed benefits of these policies justify the higher electricity costs that consumers pay. This question will be addressed in a future issue brief.
- See Mark Jacobson et al., “Matching Demand with Supply at Low Cost in 139 Countries Among 20 World Regions with 100% Intermittent Wind, Water, and Sunlight (WWS) for All Purposes,” Renewable Energy 123 (2018): 236–48. See also Nestor A. Sepulveda et al., “The Role of Firm Low-Carbon Electricity Resources in Deep Decarbonization of Electric Power Generation,” Joule 2, no. 11 (November 2018): 2403–20.
- It is theoretically possible that a tax would lead to a serendipitous innovation that reduces costs below pretax levels, but there is no empirical evidence associated with these policies to support such an outcome.
- The same is true in states with direct retail electric competition. Competitive electricity suppliers must also purchase renewable energy credits (RECs), in which costs are then reflected in the prices they charge.
- Jonathan Lesser, The Adverse Impacts of Renewable Portfolio Standards on Electricity Prices and the Economy (National Center for Energy Analytics, 2026). In Pennsylvania, waste coal qualifies as a renewable energy source.
- A 2010 study claimed that, under certain circumstances, an RPS mandate could lead to lower electricity prices by reducing the demand for natural gas used to generate electricity. See Carolyn Fischer, “Renewable Portfolio Standards: When Do They Lower Energy Prices?,” The Energy Journal 31, no. 1 (January 2010): 101–19. There is no evidence that this occurred in wholesale electricity markets.
- See Galen Barbose, “Historical RPS & CES Target Achievement and Compliance Costs,” in U.S. State Electricity Resource Standards: 2026 Data Update (Lawrence Berkeley National Laboratory, 2026). Barbose estimated the cost of RECs as a percentage of total retail electric bills.
- California no longer publishes REC data; it now publishes only total RPS compliance costs, which include the cost of wind and solar generation. Those expenditures are offset by lower expenditures on traditional generating resources; however, the net cost is unknown. Delaware stopped reporting data in 2022. All other states shown in figure 2 reported data in either 2024 or 2025. Texas repealed its RPS mandate in 2021. Arizona repealed its RPS mandate earlier this year.
- The data presented in figures 2 and 3 do not reflect all REC costs, as some states—including California—do not publish those data.
- For a detailed description of the Regional Greenhouse Gas Initiative (RGGI) and auction prices, see Potomac Economics, Annual Report on the Market for RGGI CO2 Allowances: 2025 (Potomac Economics, 2025).
- “Program Review,” RGGI, accessed October 15, 2026, https://www.rggi.org/program-overview-and-design/program-review. Annual price minimums are also called minimum reserve prices.
- In this issue brief, tons refers to short tons; RGGI measures allowances in short tons. California and Washington use metric tons.
- Potomac Economics, Annual Report on the Market, 23.
- “Auction Results,” RGGI, accessed August 5, 2026, https://www.rggi.org/auctions/auction-results.
- As of this writing, no data have been published on state proceeds for Virginia.
- U.S. Energy Information Administration, “Residential Retail Electric Choice Participation Rate Has Leveled Off Since 2019,” Today in Energy, March 15, 2023.
- “Climate Protection Program: Overview,” Oregon Department of Environmental Quality, accessed October 8, 2026, https://www.oregon.gov/deq/ghgp/Documents/cppOverviewFS.pdf.
- CARB adopted more stringent caps on total emissions in May 2026 that took effect on September 1, 2026. See California Air Resources Board (CARB), “CARB Adopts Updates to California’s Cap-and-Invest Program to Support Affordability and Align with Climate Goals,” news release, May 29, 2026.
- California’s program operates jointly with a program in Quebec.
- “Electrical Distribution Utility and Natural Gas Supplier Allowance Allocation,” CARB, accessed October 8, 2026, https://ww2.arb.ca.gov/our-work/programs/cap-and-trade-program/allowance-allocation/edu-ngs; CARB, “Post-2020 Electrical Distribution Utility Allocation Table,” 2016 Regulation, Attachment 10, accessed October 8, 2026; Washington Administrative Code (WAC) § 173-446-230 (2022), “Distribution of Allowances to Electric Utilities”; and WAC § 173-446-240 (2022), “Distribution of Allowances to Natural Gas Utilities.”
- CARB, “Appendix D-1: Updated 2027–2030 and Post-2030 Allowance Allocation to Electrical Distribution Utilities,” in Proposed Amendments to the Regulation for the California Cap on Greenhouse Gas Emissions and Market-Based Compliance Mechanisms (CARB, 2026), 3.
- California Climate Investments, 2026 Annual Report: Annual Report to the Legislature on California Climate Investments Using Cap-and-Invest Auction Proceeds (CARB, 2026).
- “RGGI CO2 Allowance Tracking System,” RGGI, accessed October 15, 2026, https://rggi-coats.org.
- “Auction Results,” RGGI, accessed October 15, 2026, https://www.rggi.org/auctions/auction-results.